Fig. 4.
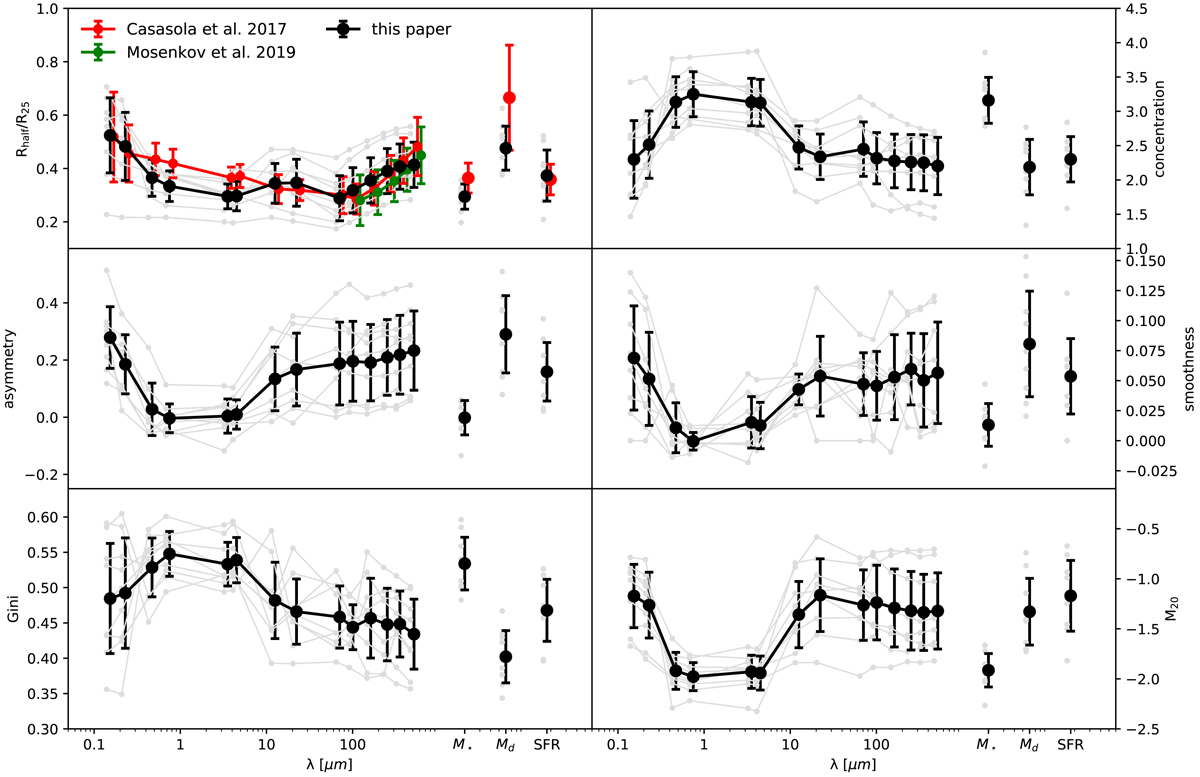
Nonparametric morphological indicators for the galaxy sample as a whole as a function of wavelength, and for the stellar mass, dust mass, and SFR maps. The different panels are the same as in Fig. 3. The gray lines are the measurements for the individual galaxies in the sample, and the black symbols and their error bars correspond to the mean and the standard deviation of the different indicators over our galaxy sample.
Current usage metrics show cumulative count of Article Views (full-text article views including HTML views, PDF and ePub downloads, according to the available data) and Abstracts Views on Vision4Press platform.
Data correspond to usage on the plateform after 2015. The current usage metrics is available 48-96 hours after online publication and is updated daily on week days.
Initial download of the metrics may take a while.