| Issue |
A&A
Volume 699, July 2025
|
|
|---|---|---|
| Article Number | A360 | |
| Number of page(s) | 10 | |
| Section | Extragalactic astronomy | |
| DOI | https://doi.org/10.1051/0004-6361/202451330 | |
| Published online | 23 July 2025 | |
MIDIS
Near-infrared rest-frame morphology of massive galaxies at 3 < z < 5 in the Hubble eXtreme Deep Field
1
Centro de Astrobiología (CAB), CSIC-INTA, Ctra. de Ajalvir km 4, Torrejón de Ardoz, E-28850 Madrid, Spain
2
Cosmic Dawn Center (DAWN), Copenhagen, Denmark
3
DTU-Space, Technical University of Denmark, Elektrovej 327, DK-2800 Kgs. Lyngby, Denmark
4
Max Planck Institute for Astronomy, Königstuhl 17, 69117 Heidelberg, Germany
5
Kapteyn Astronomical Institute, University of Groningen, P.O. Box 800, 9700AV Groningen, The Netherlands
6
Department of Astronomy, Stockholm University, Oscar Klein Centre, AlbaNova University Centre, 106 91 Stockholm, Sweden
7
Dept. of Physics and Astronomy, University College London, Gower Street, London WC1E 6BT, United Kingdom
8
UK Astronomy Technology Centre, Royal Observatory Edinburgh, Blackford Hill, Edinburgh EH9 3HJ, UK
9
Centro de Astrobiología (CAB), CSIC-INTA, Camino Bajo del Castillo s/n, E-28692 Villanueva de la Cañada, Madrid, Spain
10
I.Physikalisches Institut der Universität zu Köln, Zülpicher Str. 77, 50937 Köln, Germany
11
DARK, Niels Bohr Institute, University of Copenhagen, Jagtvej 128, 2200 Copenhagen, Denmark
12
Aix Marseille Université, CNRS, LAM (Laboratoire d’Astrophysique de Marseille) UMR 7326, 13388 Marseille, France
13
Telespazio UK for the European Space Agency, ESAC, Camino Bajo del Castillo s/n, 28692 Villanueva de la Cañada, Spain
14
School of Physics & Astronomy, Space Park Leicester, University of Leicester, 92 Corporation Road, Leicester LE4 5SP, UK
15
Leiden Observatory, Leiden University, P.O. Box 9513, 2300 RA Leiden, The Netherlands
16
Centre for Extragalactic Astronomy, Durham University, South Road, Durham DH1 3LE, UK
17
University of Vienna, Department of Astrophysics, Türkenschanzstrasse 17, 1180 Vienna, Austria
18
Institute of Particle Physics and Astrophysics, ETH Zurich, Wolfgang-Pauli-Str 27, 8093 Zurich, Switzerland
⋆ Corresponding author: This email address is being protected from spambots. You need JavaScript enabled to view it.
Received:
1
July
2024
Accepted:
6
May
2025
Abstract
Context. Thanks to decades of observations using the Hubble Space Telescope (HST), the structure of galaxies at redshift z>2 has been widely studied in the rest-frame ultraviolet regime, which traces recent star formation from young stellar populations. However, we still have little information about the spatial distribution of the older, more evolved stellar populations, constrained by the rest-frame infrared portion of the galaxies’ spectral energy distribution.
Aims. We present the morphological characterization of a sample of 49 massive galaxies (log(M⋆/M⊙)>9) at redshift 3<z<5. These galaxies are observed as part of the MIRI Deep Imaging Survey (MIDIS), the guaranteed time observations program with the MIRI instrument on board the James Webb Space Telescope (JWST). Deep MIRI 5.6 μm imaging (28.64 mag 5σ depth) allows us to characterize the rest-frame near-infrared structure of galaxies beyond cosmic noon, at higher redshifts than possible with NIRCam, tracing their older and dust-insensitive stellar populations.
Methods. We derived the nonparametric morphology of galaxies, focusing on the Gini, M20, concentration, asymmetry, and deviation statistics. Furthermore, we modeled the light distribution of galaxies with a single Sérsic component and derived their parametric morphology (i.e., effective radius and Sérsic index).
Results. We find that at z>3 massive galaxies show a smooth distribution of their rest-infrared light, strongly supporting the increasing number of regular disk galaxies already in place at early epochs. These results are further reinforced by the analysis of JWST/NIRCam data at 4.4 μm. On the contrary, the ultraviolet structure obtained from HST/WFC3 and JWST/NIRCam observations at ∼1.5 μm is generally more irregular, catching the most recent episodes of star formation. Importantly, we find a segregation of morphologies across cosmic time, where galaxies at redshift z>3.75 show later-type morphologies compared to z∼3 galaxies. These findings suggest a transition phase in galaxy assembly and central mass build-up, which takes place already at z∼3−4.
Conclusions. The combined analysis of NIRCam and MIRI imaging datasets allows us to prove that the rest-frame near-infrared morphology of massive galaxies at cosmic noon is typical of compact disk galaxies with a smooth mass distribution.
Key words: galaxies: evolution / galaxies: formation / galaxies: structure
© The Authors 2025
 Open Access article, published by EDP Sciences, under the terms of the Creative Commons Attribution License (https://creativecommons.org/licenses/by/4.0), which permits unrestricted use, distribution, and reproduction in any medium, provided the original work is properly cited.
This article is published in open access under the Subscribe to Open model. This email address is being protected from spambots. You need JavaScript enabled to view it. to support open access publication.
1. Introduction
Galaxy morphology is a key proxy for galaxy diversity, since it provides a first glimpse of the physical processes involved in galaxy evolution. Indeed, the structural evolution of galaxies across cosmic time is shown to be strongly related to stellar mass and star formation history, merger history, and environment (Visvanathan & Sandage 1977; Tully et al. 1982; Kennicutt 1998; Kauffmann et al. 2003; Baldry et al. 2004; De Lucia et al. 2007; Lotz et al. 2008; Blanton & Moustakas 2009; Kormendy et al. 2010).
In the last two decades, our knowledge of galaxy structure beyond the local Universe was based on studies making use of the Hubble Space Telescope (HST), which has given us access to the rest-frame ultraviolet to optical morphology of galaxies up to redshift z∼2−3. At these wavelengths, galaxies at z>1 appear more irregular in their light distribution than local galaxies (Conselice et al. 2000, 2008), and such peculiar systems dominate the galaxy population beyond z∼2.5 (e.g., Buitrago et al. 2013; Huertas-Company et al. 2015).
Based on almost 30 years of HST observational campaigns, multiple results pointed to the conclusion that the Hubble sequence is established around z≳1 (Brinchmann et al. 1998; Faber et al. 2007; Bruce et al. 2012; Barro et al. 2013; Mortlock et al. 2013; Huertas-Company et al. 2016). Nevertheless, properly quantifying the morphological transformation of galaxies using HST datasets suffers some limitations. A combination of insufficient spatial resolution and limited red wavelength coverage makes it difficult to properly resolve the first complex structures assembling in the first 2−3 Gyr after the Big Bang (i.e., z>2−3). Thus, this observational limitation leaves open the question of whether the Hubble sequence was already in place at earlier cosmic times than previously thought. Indeed, spectroscopic observations already suggest an epoch of early disk assembly (e.g., Wisnioski et al. 2015; Simons et al. 2017; Rizzo et al. 2020), with the first complex structures starting to build up at and beyond cosmic noon (e.g., Tacchella et al. 2015; Costantin et al. 2021, 2022; Jin et al. 2024; Jegatheesan et al. 2024).
Now, for the first time, the James Webb Space Telescope (JWST; Gardner et al. 2023) opens up the possibility to characterize the detailed structure of the bulk of the stellar population of the highest-redshift galaxies (z>3) with an unprecedented level of detail (e.g., Ferreira et al. 2022, 2023; Kartaltepe et al. 2023; Costantin et al. 2023a; Treu et al. 2023; Jacobs et al. 2023; Huertas-Company et al. 2025). The prevailing conclusion of these initial studies is that the fraction of galaxies with disk-like morphologies is higher than that inferred with HST, although their exact nature still needs to be investigated (e.g., Vega-Ferrero et al. 2024; Pandya et al. 2024).
In this context, the Mid-Infrared Instrument (MIRI; Rieke et al. 2015; Bouchet et al. 2015; Wright et al. 2023; Dicken et al. 2024) on board JWST, probing the observed near-to-mid infrared regime (4.9 to 27.9 μm), provides a huge jump in sensitivity compared to previous observatories at these wavelengths (∼10 times deeper than IRAC/Spitzer; Fazio et al. 2004). MIRI allows for targeting the rest-frame near-infrared morphology of galaxies at z>3 (up to z∼5), resolving structures on scales of a few kiloparsecs (full width at half maximum FWHM∼0.2 arcsec at 5.6 μm, corresponding to ∼1.6 kpc at z = 3 and ∼1.3 kpc at z = 5). Furthermore, MIRI sensitivity could also allow us to probe the near-infrared morphology of galaxies at 5<z<10 (i.e., F770W and F1000W bands; FWHM∼0.3 arcsec at 10 μm, corresponding to ∼1.4 kpc at z = 10).
At high redshifts, the MIRI Deep Imaging Survey (MIDIS; Östlin et al. 2025) is the best available dataset to address key open questions about the clumpy or irregular distribution of the bulk of the stellar mass, as traced by the older and almost dust-insensitive stellar populations (see, e.g., Boogaard et al. 2024, Gillman et al. in prep.). It consists of ∼41.34 hours of net exposure time for the deep imaging of the Hubble eXtreme Deep Field (XDF; Illingworth et al. 2013) at 5.6 μm, with parallel observations of the surrounding area (see, e.g., Pérez-González et al. 2023) using the Near Infrared Camera (NIRCam) and the Near Infrared Imager and Slitless Spectrograph (NIRISS). Furthermore, 8.5 hours of net exposure time were dedicated to deep imaging in the F1000W band (Pérez-González et al. 2024b; Iani et al. 2025).
In this work, we study the near-infrared rest-frame morphologies of massive galaxies at redshift z>3 in the XDF using MIDIS observations. We derive their nonparametric and parametric morphology, characterizing the structure of their old stellar population and looking at the morphological transformation of the bulk of their stellar mass across cosmic time. The paper is organized as follows: In Sect. 2 we describe the selection of the sample of galaxies. In Sect. 3 we derive the nonparametric and parametric morphology, discussing the implications in the context of galaxy evolution. Finally, in Sect. 4 we summarize our results and provide our conclusions.
Throughout this work we assume a Planck Collaboration VI (2020) cosmology with H0 = 67.4 km s−1 Mpc−1, Ωm = 0.315, and ΩΛ = 0.685. We quote magnitudes in the AB system (Oke & Gunn 1983), and all errors are reported as the 16th–84th percentile interval.
2. Data and sample
We selected galaxies from the MIRI 5.6 μm imaging of the JWST guaranteed time observations (GTO) program MIDIS (PID: 1283), which represents the deepest image of the Universe at these wavelengths (28.64 mag 5σ depth, calculated within circular apertures with a diameter of 0.45 arcsec and corrected for drizzling correlation; Rinaldi et al. 2023, 2024; Iani et al. 2024; Boogaard et al. 2024). The data were calibrated using the procedure described in Östlin et al. (2025), using a modified version of the official JWST pipeline version 1.12.3 (pmap 1137) and applying a background homogenization algorithm (including 1/f-noise removal) before obtaining the final mosaic drizzled at a pixel scale of 0.06 arcsec (see also Pérez-González et al. 2024a,b, for more details). Due to the complex observational strategy of MIDIS, and the lack of bright and isolated stars in the field, we used a varying point spread function (PSF) model built using empirical PSFs at different positions on the MIRI detector according to the MIDIS observational strategy (see Boogaard et al. 2024), oversampling models from Libralato et al. (2024). As complementary datasets, we made use of imaging data from CANDELS (Grogin et al. 2011; Koekemoer et al. 2011) and JADES (Rieke et al. 2023; Eisenstein et al. 2023), covering observed wavelengths from ∼0.4−1.6 to 1.1−4.4 μm, respectively.
We detected and modeled galaxies in the F560W MIRI band and, then, performed forced photometry in HST, NIRCam, and MIRI bands with THE FARMER (Weaver et al. 2022), allowing the flux to vary, whilst keeping the structural parameters fixed. Photometric redshifts and stellar masses were derived from the multiwavelength fluxes with EAZY-PY (Brammer et al. 2008), employing thirteen templates from the Flexible Stellar Populations Synthesis code (FSPS; Conroy & Gunn 2010) as described in Kokorev et al. (2022). The details of the source detection and photometric catalog are extensively described by Gillman et al. (in preparation).
Galaxies were initially selected for having redshifts 3<z<5 and stellar masses log(M⋆/M⊙)>9. The total number of such galaxies in the MIDIS field is 67. Visually inspecting the images of the initial sample, we discarded ten faint galaxies (S/N < 5), four galaxies that are at the edge of the MIRI pointing, and four galaxies that are unresolved or extremely contaminated by foreground sources. The main properties of the sample galaxies are enumerated in Table B.1.
With this selection, we probed for the first time the rest-frame regime ≳0.9 μm for 49 galaxies up to z = 5, which is unique for the MIDIS dataset and where there is essentially no variation in the galaxies’ morphology (e.g., Martorano et al. 2023; Ren et al. 2024). It is lastly worth noticing that galaxy 767 is presented in the ALMA selected sample analyzed in Boogaard et al. (2024), while galaxies 1635 and 2663 are included in the sample of X-ray active galactic nuclei detailed in Gillman et al. (2025).
3. Method and results
In this work, we present the nonparametric and parametric morphology for a sample of 49 massive galaxies at z>3 using MIRI imaging at 5.6 μm. Given the redshift range of our sample (3<z<5), we probed the rest-frame near-infrared structure of galaxies (λrest∼0.9−1.4 μm), which best traces more evolved stellar populations that only MIRI can probe up to such high redshifts. To complement our analysis, we compared the rest-frame near-infrared structure of these galaxies with their rest-frame ultraviolet spatial distribution using HST/F160W imaging from CANDELS. Apart from the different stellar populations probed by these two bands, our choice is also justified by the similar width of the PSF of these two datasets, minimizing the effects related to spatial resolutions (see also Appendix A).
3.1. Nonparametric morphology
We measured the structure of the sample galaxies observed in the MIRI/F560W filter. First, we created segmentation maps of each galaxy with SEP (Barbary 2018), a Python library implementing SExtractor (Bertin & Arnouts 1996). Then, we derived nonparametric morphological diagnostics using statmorph (Rodriguez-Gomez et al. 2019). Following Crespo Gómez et al. (2024), we quantified the uncertainties associated with each parameter by performing 500 Monte Carlo realizations for each galaxy. We perturbed each image pixel-by-pixel with Gaussian noise (σ= root mean square of the background level) and created new segmentation maps at each iteration. The 16th–84th percentile interval of each parameter was used to quantify their uncertainty.
In the following, we focus on the Gini and M20 statistics (see Table B.1 and Figs. 2, 3, and 5). The Gini coefficient quantifies the light distribution of the galaxy, ranging from G = 0 for homogeneous brightness distribution to G = 1 when the entire flux is concentrated in a single pixel (Abraham et al. 2003; Lotz et al. 2004). The M20 statistic is the normalized second-order moment of the brightest 20% of the galaxy's flux, and it provides valuable information on the spatial distribution of any substructure, such as bright nuclei, bars, or spiral arms (Lotz et al. 2004). Thus, the Gini-M20 diagram has been largely employed to separate early, late-type, and merging galaxies from low to high redshift (Lotz et al. 2004, 2008; Rose et al. 2023; Crespo Gómez et al. 2024).
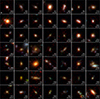 |
Fig. 1. MIRI/F560W, NIRCam/F356W, and NIRCam/F150W RGB images of the 49 galaxies studied in this work, ordered by increasing redshift. The cutouts are 2×2 arcsec2. We report the angular resolution as the FWHM of the MIRI PSF. |
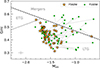 |
Fig. 2. Gini-M20 diagram. The orange stars and green dots correspond to the nonparametric morphology measured on MIRI F560W and WFC3 F160W images, respectively. For each galaxy, gray lines link the observed morphology at different wavelengths. The ETGs, LTGs, and mergers are separated according to Eqs. (4) in Lotz et al. (2008). |
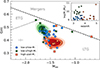 |
Fig. 3. Gini-M20 diagram based on MIRI F560W morphology, separating galaxies at 3<z<3.75 with log(M⋆/M⊙)<9.5 (low-z/low-M⋆; blue dots and shaded region), galaxies at 3<z<3.75 with log(M⋆/M⊙)>9.5 (low-z/high-M⋆; green stars and shaded region), and galaxies at 3.75<z<5 (high-z/all-M⋆; red squares and shaded region). ETGs, LTGs, and mergers are separated according to Eqs. (4) in Lotz et al. (2008). |
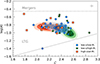 |
Fig. 4. C-A diagram based on MIRI F560W morphology, separating galaxies at 3<z<3.75 with log(M⋆/M⊙)<9.5 (low-z/low-M⋆; blue dots and shaded region), galaxies at 3<z<3.75 with log(M⋆/M⊙)>9.5 (low-z/high-M⋆; green stars and shaded region), and galaxies at 3.75<z<5 (high-z/all-M⋆; red squares and shaded region). Mergers and late-type galaxies are separated according to Conselice (2003). The boundaries between late-type galaxies and intermediate galaxies are defined as in Bershady et al. (2000). |
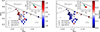 |
Fig. 5. Gini-M20 diagram, color-coded according to concentration (left panel) and deviation (right panel). The galaxies are divided into low-z/low-M⋆ (dots), low-z/high-M⋆ (stars), and high-z/all-M⋆ (squares). The inset plot shows the density distribution, as reported in Fig. 3. |
Furthermore, to better characterize the sample galaxies, using statmorph we derived the concentration–asymmetry–smoothness (CAS; Conselice 2003) and multimode–intensity–deviation statistics (MID; Freeman et al. 2013), which allow us to better discriminate the true nature of galaxies in the Gini-M20 diagram. In particular, we complement the information inferred from the Gini-M20 diagram with that provided by the concentration, asymmetry, and deviation statistics (see Table B.1 and Figs. 4 and 5). The concentration index is defined as the ratio of the radii that enclose 80% and 20% of the light of the galaxy (Conselice 2003; Lotz et al. 2004). As a consequence, elliptical galaxies are the most concentrated systems, and the concentration decreases for later Hubble types (Bershady et al. 2000). The asymmetry coefficient quantifies the degree to which the light distribution of the galaxy is rotationally symmetric. Generally, the asymmetry is more sensitive to merger signatures than concentration, with irregular galaxies more asymmetric than disk-like or spheroidal galaxies. It is worth mentioning that we report the asymmetry coefficients without accounting for the asymmetry of the background, which dominates our measurements and leads to artificially low or even negative asymmetry values (see, e.g., Bignone et al. 2020). The deviation index (Freeman et al. 2013) quantifies the variation of irregular or peculiar morphologies from elliptical symmetry. In this case, it is expected that elliptical or regular disk galaxies with no substructures (e.g., clumps) show values of deviation clustering near zero.
It is worth noting that, while both Gini and M20 usually correlate with concentration, they differ in important respects. On the one hand, the Gini coefficient is independent of the large-scale spatial distribution of light, and high values of Gini can also arise if the bright structures are not located at the center of a galaxy (unlike C). On the other hand, M20 (scaling as r2) is more heavily weighted than C by the spatial distribution of bright regions. Moreover, M20 is more sensitive than C to merger signatures, since it is not measured within circular or elliptical apertures with a fixed center (see Lotz et al. 2004, for further details).
3.1.1. Gini-M20
In Fig. 2, we show the distribution of rest-frame near-infrared morphologies in the (Gini, M20) diagram (orange stars: see also Fig. A.2). The first result is that all the galaxies in our sample occupy the region of late-type systems, even if some (i.e., 947, 1450, 1513, 1635, 2108, and 2663) are quite close to the edge of mergers or early-type objects. Inspecting their visual morphology (Fig. 1), we can confirm that all these galaxies, except for 1450, have very close companions that contaminate their surface-brightness profiles (see also Fig. 5).
As a comparison, we derived the rest-frame ultraviolet morphologies of the sample galaxies using HST/WFC3 imaging from CANDELS (GiniUV and M20,UV; green points). Furthermore, we analyzed NIRCam images from JADES at similar wavelengths (F150W) but different spatial resolution (see Fig. A.1). Already at z>3, galaxies appear more irregular at shorter wavelengths, pointing to the presence of an underlying, mature population with a smooth stellar mass distribution already in place when the Universe was ≲2 Gyr old. These results are confirmed by the analysis of NIRCam datasets at a higher spatial resolution, as shown in Appendix A.
We find that, in the rest-frame near-infrared regime, (F560W) galaxies have Gini  and
and  , while in the ultraviolet regime (F160W) they have Gini
 and
and  . For individual galaxies, we derive median ΔGini
  and
and  . Thus, galaxies move from later-type morphologies to earlier-type ones if observed at shorter or longer wavelengths, respectively. This trend is consistent with previous results based on ultraviolet and optical differences of typical star-forming galaxies at z∼3−4, as reported by Conselice et al. (2008) and Wuyts et al. (2012), and could be interpreted as evidence for disk assembly through the inward migration of clumps and gas accretion.
We explore whether there is any trend with redshift or stellar mass, separating galaxies into two redshift bins with equivalent lookback time of ∼1 Gyr. Furthermore, we separate galaxies in the low-redshift bin according to their stellar mass. Thus, the three classes are defined as follows: low-z/low-M⋆ has 3<z<3.75 and log(M⋆/M⊙)<9.5; low-z/high-M⋆ has 3<z<3.75 and log(M⋆/M⊙)>9.5; and high-z/all-M⋆ has 3.75<z<5 (all masses). In Fig. 3, we show the Gini, M20 diagram for the three different classes. low-z/low-M⋆ galaxies show median Gini  and
and  ; low-z/high-M⋆ galaxies have median Gini
  and
and  ; and high-z/all-M⋆ galaxies have median Gini
  and
and  . We note that galaxies in the higher-redshift bin appear more irregular than galaxies at lower redshift, suggesting a segregation of morphologies from irregular to smoother light (and stellar mass) profiles. A similar transition is also seen when accounting for the different stellar masses of galaxies at 3<z<3.75, even if the trend is milder.
3.1.2. Concentration, asymmetry, and deviation
To better quantify the structure of the sample galaxies, we derived their concentration, asymmetry, and deviation statistics. In Fig. 4, we show the three classes of galaxies in the C-A diagnostic (Bershady et al. 2000; Conselice 2003). We find that all the aforementioned results are confirmed, with low-z/low-M⋆ galaxies having median  and
and  , low-z/high-M⋆ galaxies showing median
  and
and  , and high-z/all-M⋆ presenting median
  and
and  .
.
In the Gini, M20 diagram (Fig. 5), the concentration statistic reflects the trend previously highlighted, with lower-redshift galaxies (all masses) being more concentrated (median  ) than those at higher redshifts (median
  ). As expected, the galaxy's concentration increases when moving from late-type galaxies (LTGs) to early-type galaxies (ETGs) along the empirical trend Gini ∝−M20, which is also used to separate normal from merging systems (Lotz et al. 2008). On the other hand, the deviation statistic allows us to identify more irregular morphologies, such as 795, 947, 1513, 1616, 2108, 2663, and 3119 (Fig. 1).
3.2. Parametric morphology
We performed the 2D photometric decomposition of the MIRI images, modeling the surface brightness of each galaxy with a Sérsic (1968) law. We made use of anduryl (Marrero de la Rosa et al., in preparation), a computational tool designed for 2D photometric fitting of galaxies, leveraging Bayesian inference as its foundational framework. The software accommodates fits based on either a Sérsic model or a combination of Sérsic and exponential models. At the heart of anduryl lies a robust parameter space exploration, executed through nested sampling, a technique for approximating the posterior probability integral implemented through Nestle1. This method enables the inference of the posterior probability distribution, thereby facilitating the extraction of marginal posterior distributions for each parameter. From these distributions, the mean values emerge as the most plausible estimates for each parameter.
Inspecting the size (half-light radius Re) and Sérsic index of the sample galaxies, we find no clear correlation with the Gini-M20 statistics (Fig. 6). In detail, low-z/low-M⋆ galaxies have median  kpc and Sérsic index
  ; low-z/high-M⋆ galaxies show median
  kpc and Sérsic index
  ; and high-z/all-M⋆ galaxies show median
  kpc and Sérsic index
  . Overall, the median values for the entire sample are
  kpc and
  , which could be considered typical of late-type morphologies, but with a wide scatter toward high values.
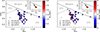 |
Fig. 6. Same as Fig. 5, but for the effective radius (left panel) and Sérsic index (right panel). Galaxy ID 1635 is marked with an “X”, since it has no parametric model. |
4. Summary and conclusions
In this work, we present the first detailed rest-frame near-infrared morphological study of a sample of 49 galaxies at 3<z<5 with log(M⋆/M⊙)>9, observed as part of the MIRI Deep Imaging Survey in the XDF at 5.6 micron (F560W). We employed nonparametric morphological diagnostics to classify the sample galaxies, mainly focusing on the Gini and M20, as well as the concentration, asymmetry, deviation, and parametric Sérsic modeling of the galaxies.
From this study, we can draw three main conclusions. First, massive galaxies at z>3 show more regular structures in the rest-frame near-infrared regime (MIRI F560W) compared to a more peculiar morphology at shorter wavelengths. We measured the morphology of galaxies using the F150W and F160W bands (NIRCam/JWST and WFC3/HST, respectively), probing the rest-frame ultraviolet regime of these galaxies, finding that their structure is more irregular. Second, the visual, nonparametric (Gini-M20, concentration, asymmetry, and deviation), and parametric (Sérsic and Re) analysis points to a compact population of disk-like galaxies, with a mostly regular mass distribution. The analysis of higher resolution images at 4.4 μm (see Appendix A) reinforces our conclusion that massive galaxies at 3<z<5 show disk-like morphologies with a smooth mass distribution and a significantly compact structure. Third, we separate the galaxies into three classes. low-z/low-M⋆ galaxies have 3<z<3.75 and log(M⋆/M⊙)<9.5; low-z/high-M⋆ galaxies have 3<z<3.75 and log(M⋆/M⊙)>9.5; and high-z/all-M⋆ have 3.75<z<5 (all masses). We find a segregation of galaxy morphologies across cosmic time in the Gini-M20 and C-A diagrams from later to earlier types. This could be interpreted as a transition phase in galaxy assembly, where the complex structures (i.e., bulges and bars) start to assemble first.
Building on the results of this work, deep MIRI campaigns in the near future will open the possibility to expand the morphological characterization of galaxies in the early Universe to a larger sample and possibly to a higher redshift (e.g., up to z = 10 using MIRI F770W and F1000W).
Acknowledgments
We would like to thank I. Smail for all the comments that improved the content of the manuscript and C. J. Conselice for the useful discussion. The project that gave rise to these results received the support of a fellowship from the “la Caixa” Foundation (ID 100010434). The fellowship code is LCF/BQ/PR24/12050015. LC and PGPG acknowledge support from grant PID2022-139567NB-I00 funded by Spanish Ministerio de Ciencia e Innovación MCIN/AEI/10.13039/501100011033, FEDER Una manera de hacer Europa. LC, JA-M, AC-G, and LC acknowledge support by grant PIB2021-127718NB-100 from the Spanish Ministry of Science and Innovation/State Agency of Research MCIN/AEI/10.13039/501100011033 and by “ERDF A way of making Europe”. SG acknowledges financial support from the Villum Young Investigator grant 37440 and 13160 and the Cosmic Dawn Center (DAWN), funded by the Danish National Research Foundation under grant DNRF140. LAB acknowledges support by ERC AdG grant 740246 (Cosmic-Gas). EI acknowledges funding from the Netherlands Research School for Astronomy (NOVA). JM and AB acknowledge support from the Swedish National Space Administration (SNSA). AAH acknowledges support from grant PID2021-124665NB-I00 funded by MCIN/AEI/10.13039/501100011033 and by ERDF A way of making Europe”. AE and KIC acknowledges funding from the Netherlands Research School for Astronomy (NOVA) and from the Dutch Research Council (NWO) through the award of the Vici Grant VI.C.212.036. IJ acknowledge support from the Carlsberg Foundation (grant no CF20-0534) and the Cosmic Dawn Center is funded by the Danish National Research Foundation under grant No. 140. FP acknowledges support through the German Space Agency DLR 50OS1501 and DLR 50OS2001 from 2015 to 2023. JPP and TVT acknowledge financial support from the UK Science and Technology Facilities Council, and the UK Space Agency. This work was supported by research grants (VIL16599, VIL54489) from VILLUM FONDEN. The work presented is the effort of the entire MIRI team and the enthusiasm within the MIRI partnership is a significant factor in its success. MIRI draws on the scientific and technical expertise of the following organizations: Ames Research Center, USA; Airbus Defence and Space, UK; CEA-Irfu, Saclay, France; Centre Spatial de Liége, Belgium; Consejo Superior de Investigaciones Científicas, Spain; Carl Zeiss Optronics, Germany; Chalmers University of Technology, Sweden; Danish Space Research Institute, Denmark; Dublin Institute for Advanced Studies, Ireland; European Space Agency, Netherlands; ETCA, Belgium; ETH Zurich, Switzerland; Goddard Space Flight Center, USA; Institute d’Astrophysique Spatiale, France; Instituto Nacional de Técnica Aeroespacial, Spain; Institute for Astronomy, Edinburgh, UK; Jet Propulsion Laboratory, USA; Laboratoire d’Astrophysique de Marseille (LAM), France; Leiden University, Netherlands; Lockheed Advanced Technology Center (USA); NOVA Opt-IR group at Dwingeloo, Netherlands; Northrop Grumman, USA; Max-Planck Institut für Astronomie (MPIA), Heidelberg, Germany; Laboratoire d’Etudes Spatiales et d’Instrumentation en Astrophysique (LESIA), France; Paul Scherrer Institut, Switzerland; Raytheon Vision Systems, USA; RUAG Aerospace, Switzerland; Rutherford Appleton Laboratory (RAL Space), UK; Space Telescope Science Institute, USA; Toegepast- Natuurwetenschappelijk Onderzoek (TNO-TPD), Netherlands; UK Astronomy Technology Centre, UK; University College London, UK; University of Amsterdam, Netherlands; University of Arizona, USA; University of Cardiff, UK; University of Cologne, Germany; University of Ghent; University of Groningen, Netherlands; University of Leicester, UK; University of Leuven, Belgium; University of Stockholm, Sweden; Utah State University, USA. A portion of this work was carried out at the Jet Propulsion Laboratory, California Institute of Technology, under a contract with the National Aeronautics and Space Administration. We would like to thank the following National and International Funding Agencies for their support of the MIRI development: NASA; ESA; Belgian Science Policy Office; Centre Nationale D’Etudes Spatiales (CNES); Danish National Space Centre; Deutsches Zentrum fur Luft-und Raumfahrt (DLR); Enterprise Ireland; Ministerio De Economía y Competitividad; Netherlands Research School for Astronomy (NOVA); Netherlands Organisation for Scientific Research (NWO); Science and Technology Facilities Council; Swiss Space Office; Swedish National Space Board; UK Space Agency.
References
- Abraham, R. G., van den Bergh, S., & Nair, P. 2003, ApJ, 588, 218 [NASA ADS] [CrossRef] [Google Scholar]
- Baldry, I. K., Glazebrook, K., Brinkmann, J., et al. 2004, ApJ, 600, 681 [Google Scholar]
- Barbary, K. 2018, Source Extraction and Photometry, Astrophysics Source Code Library, [record ascl:1811.004] [Google Scholar]
- Barro, G., Faber, S. M., Pérez-González, P. G., et al. 2013, ApJ, 765, 104 [Google Scholar]
- Bershady, M. A., Jangren, A., & Conselice, C. J. 2000, AJ, 119, 2645 [NASA ADS] [CrossRef] [Google Scholar]
- Bertin, E., & Arnouts, S. 1996, A&AS, 117, 393 [NASA ADS] [CrossRef] [EDP Sciences] [Google Scholar]
- Bignone, L. A., Pedrosa, S. E., Trayford, J. W., Tissera, P. B., & Pellizza, L. J. 2020, MNRAS, 491, 3624 [Google Scholar]
- Blanton, M. R., & Moustakas, J. 2009, ARA&A, 47, 159 [Google Scholar]
- Boogaard, L. A., Gillman, S., Melinder, J., et al. 2024, ApJ, 969, 27 [NASA ADS] [CrossRef] [Google Scholar]
- Bouchet, P., García-Marín, M., Lagage, P. O., et al. 2015, PASP, 127, 612 [CrossRef] [Google Scholar]
- Brammer, G. B., van Dokkum, P. G., & Coppi, P. 2008, ApJ, 686, 1503 [Google Scholar]
- Brinchmann, J., Abraham, R., Schade, D., et al. 1998, ApJ, 499, 112 [NASA ADS] [CrossRef] [Google Scholar]
- Bruce, V. A., Dunlop, J. S., Cirasuolo, M., et al. 2012, MNRAS, 427, 1666 [NASA ADS] [CrossRef] [Google Scholar]
- Buitrago, F., Trujillo, I., Conselice, C. J., & Häußler, B. 2013, MNRAS, 428, 1460 [NASA ADS] [CrossRef] [Google Scholar]
- Conroy, C., & Gunn, J. E. 2010, FSPS: Flexible Stellar Population Synthesis, Astrophysics Source Code Library, [record ascl:1010.043] [Google Scholar]
- Conselice, C. J. 2003, ApJS, 147, 1 [NASA ADS] [CrossRef] [Google Scholar]
- Conselice, C. J., Bershady, M. A., & Jangren, A. 2000, ApJ, 529, 886 [NASA ADS] [CrossRef] [Google Scholar]
- Conselice, C. J., Rajgor, S., & Myers, R. 2008, MNRAS, 386, 909 [CrossRef] [Google Scholar]
- Costantin, L., Pérez-González, P. G., Méndez-Abreu, J., et al. 2021, ApJ, 913, 125 [NASA ADS] [CrossRef] [Google Scholar]
- Costantin, L., Pérez-González, P. G., Méndez-Abreu, J., et al. 2022, ApJ, 929, 121 [NASA ADS] [CrossRef] [Google Scholar]
- Costantin, L., Pérez-González, P. G., Guo, Y., et al. 2023a, Nature, 623, 499 [NASA ADS] [CrossRef] [Google Scholar]
- Costantin, L., Pérez-González, P. G., Vega-Ferrero, J., et al. 2023b, ApJ, 946, 71 [NASA ADS] [CrossRef] [Google Scholar]
- Crespo Gómez, A., Colina, L., Álvarez-Márquez, J., et al. 2024, A&A, 691, A325 [NASA ADS] [CrossRef] [EDP Sciences] [Google Scholar]
- De Lucia, G., Poggianti, B. M., Aragón-Salamanca, A., et al. 2007, MNRAS, 374, 809 [Google Scholar]
- Dicken, D., Marín, M. G., Shivaei, I., et al. 2024, A&A, 689, A5 [NASA ADS] [CrossRef] [EDP Sciences] [Google Scholar]
- Eisenstein, D. J., Willott, C., Alberts, S., et al. 2023, ApJS, submitted [arXiv:2306.02465] [Google Scholar]
- Faber, S. M., Willmer, C. N. A., Wolf, C., et al. 2007, ApJ, 665, 265 [Google Scholar]
- Fazio, G. G., Hora, J. L., Allen, L. E., et al. 2004, ApJS, 154, 10 [Google Scholar]
- Ferreira, L., Adams, N., Conselice, C. J., et al. 2022, ApJ, 938, L2 [NASA ADS] [CrossRef] [Google Scholar]
- Ferreira, L., Conselice, C. J., Sazonova, E., et al. 2023, ApJ, 955, 94 [NASA ADS] [CrossRef] [Google Scholar]
- Freeman, P. E., Izbicki, R., Lee, A. B., et al. 2013, MNRAS, 434, 282 [NASA ADS] [CrossRef] [Google Scholar]
- Gardner, J. P., Mather, J. C., Abbott, R., et al. 2023, PASP, 135, 068001 [NASA ADS] [CrossRef] [Google Scholar]
- Gillman, S., Pye, J. P., Alonso-Herrero, A., et al. 2025, A&A, submitted [arXiv:2501.11491] [Google Scholar]
- Grogin, N. A., Kocevski, D. D., Faber, S. M., et al. 2011, ApJS, 197, 35 [NASA ADS] [CrossRef] [Google Scholar]
- Huertas-Company, M., Pérez-González, P. G., Mei, S., et al. 2015, ApJ, 809, 95 [NASA ADS] [CrossRef] [Google Scholar]
- Huertas-Company, M., Bernardi, M., Pérez-González, P. G., et al. 2016, MNRAS, 462, 4495 [CrossRef] [Google Scholar]
- Huertas-Company, M., Shuntov, M., Dong, Y., et al. 2025, A&A, submitted [arXiv:2502.03532] [Google Scholar]
- Iani, E., Caputi, K. I., Rinaldi, P., et al. 2024, ApJ, 963, 97 [NASA ADS] [CrossRef] [Google Scholar]
- Iani, E., Rinaldi, P., Caputi, K. I., et al. 2025, ApJ, submitted [arXiv:2406.18207] [Google Scholar]
- Illingworth, G. D., Magee, D., Oesch, P. A., et al. 2013, ApJS, 209, 6 [Google Scholar]
- Jacobs, C., Glazebrook, K., Calabrò, A., et al. 2023, ApJ, 948, L13 [NASA ADS] [CrossRef] [Google Scholar]
- Jegatheesan, K., Johnston, E. J., Häußler, B., & Nedkova, K. V. 2024, A&A, 684, A32 [NASA ADS] [CrossRef] [EDP Sciences] [Google Scholar]
- Jin, Y., Zhu, L., Zibetti, S., et al. 2024, A&A, 681, A95 [NASA ADS] [CrossRef] [EDP Sciences] [Google Scholar]
- Kartaltepe, J. S., Rose, C., Vanderhoof, B. N., et al. 2023, ApJ, 946, L15 [NASA ADS] [CrossRef] [Google Scholar]
- Kauffmann, G., Heckman, T. M., White, S. D. M., et al. 2003, MNRAS, 341, 54 [Google Scholar]
- Kennicutt, R. C. Jr. 1998, ARA&A, 36, 189 [NASA ADS] [CrossRef] [Google Scholar]
- Koekemoer, A. M., Faber, S. M., Ferguson, H. C., et al. 2011, ApJS, 197, 36 [NASA ADS] [CrossRef] [Google Scholar]
- Kokorev, V., Brammer, G., Fujimoto, S., et al. 2022, ApJS, 263, 38 [NASA ADS] [CrossRef] [Google Scholar]
- Kormendy, J., Drory, N., Bender, R., & Cornell, M. E. 2010, ApJ, 723, 54 [Google Scholar]
- Libralato, M., Argyriou, I., Dicken, D., et al. 2024, PASP, 136, 034502 [Google Scholar]
- Lotz, J. M., Primack, J., & Madau, P. 2004, AJ, 128, 163 [NASA ADS] [CrossRef] [Google Scholar]
- Lotz, J. M., Davis, M., Faber, S. M., et al. 2008, ApJ, 672, 177 [NASA ADS] [CrossRef] [Google Scholar]
- Martorano, M., van der Wel, A., Bell, E. F., et al. 2023, ApJ, 957, 46 [NASA ADS] [CrossRef] [Google Scholar]
- Mobasher, B., Dahlen, T., Ferguson, H. C., et al. 2015, ApJ, 808, 101 [NASA ADS] [CrossRef] [Google Scholar]
- Mortlock, A., Conselice, C. J., Hartley, W. G., et al. 2013, MNRAS, 433, 1185 [NASA ADS] [CrossRef] [Google Scholar]
- Oke, J. B., & Gunn, J. E. 1983, ApJ, 266, 713 [NASA ADS] [CrossRef] [Google Scholar]
- Östlin, G., Pérez-González, P. G., Melinder, J., et al. 2025, A&A, 696, A57 [NASA ADS] [CrossRef] [EDP Sciences] [Google Scholar]
- Pandya, V., Zhang, H., Huertas-Company, M., et al. 2024, ApJ, 963, 54 [NASA ADS] [CrossRef] [Google Scholar]
- Pérez-González, P. G., Costantin, L., Langeroodi, D., et al. 2023, ApJ, 951, L1 [CrossRef] [Google Scholar]
- Pérez-González, P. G., Barro, G., Rieke, G. H., et al. 2024a, ApJ, 968, 4 [CrossRef] [Google Scholar]
- Pérez-González, P. G., Rinaldi, P., Caputi, K. I., et al. 2024b, ApJ, 969, L10 [Google Scholar]
- Planck Collaboration VI. 2020, A&A, 641, A6 [NASA ADS] [CrossRef] [EDP Sciences] [Google Scholar]
- Ren, J., Liu, F. S., Li, N., et al. 2024, ApJ, 969, 4 [NASA ADS] [CrossRef] [Google Scholar]
- Rieke, G. H., Wright, G. S., Böker, T., et al. 2015, PASP, 127, 584 [NASA ADS] [CrossRef] [Google Scholar]
- Rieke, M. J., Robertson, B., Tacchella, S., et al. 2023, ApJS, 269, 16 [NASA ADS] [CrossRef] [Google Scholar]
- Rinaldi, P., Caputi, K. I., Costantin, L., et al. 2023, ApJ, 952, 143 [NASA ADS] [CrossRef] [Google Scholar]
- Rinaldi, P., Caputi, K. I., Iani, E., et al. 2024, ApJ, 969, 12 [NASA ADS] [CrossRef] [Google Scholar]
- Rizzo, F., Vegetti, S., Powell, D., et al. 2020, Nature, 584, 201 [Google Scholar]
- Rodriguez-Gomez, V., Snyder, G. F., Lotz, J. M., et al. 2019, MNRAS, 483, 4140 [NASA ADS] [CrossRef] [Google Scholar]
- Rose, C., Kartaltepe, J. S., Snyder, G. F., et al. 2023, ApJ, 942, 54 [NASA ADS] [CrossRef] [Google Scholar]
- Sérsic, J. L. 1968, Atlas de Galaxias Australes (Cordoba, Argentina: Observatorio Astronomico) [Google Scholar]
- Simons, R. C., Kassin, S. A., Weiner, B. J., et al. 2017, ApJ, 843, 46 [Google Scholar]
- Tacchella, S., Carollo, C. M., Renzini, A., et al. 2015, Science, 348, 314 [NASA ADS] [CrossRef] [Google Scholar]
- Treu, T., Calabrò, A., Castellano, M., et al. 2023, ApJ, 942, L28 [CrossRef] [Google Scholar]
- Tully, R. B., Mould, J. R., & Aaronson, M. 1982, ApJ, 257, 527 [Google Scholar]
- Vega-Ferrero, J., Huertas-Company, M., Costantin, L., et al. 2024, ApJ, 961, 51 [NASA ADS] [CrossRef] [Google Scholar]
- Visvanathan, N., & Sandage, A. 1977, ApJ, 216, 214 [Google Scholar]
- Weaver, J. R., Kauffmann, O. B., Ilbert, O., et al. 2022, ApJS, 258, 11 [NASA ADS] [CrossRef] [Google Scholar]
- Wisnioski, E., Förster Schreiber, N. M., Wuyts, S., et al. 2015, ApJ, 799, 209 [Google Scholar]
- Wright, G. S., Rieke, G. H., Glasse, A., et al. 2023, PASP, 135, 048003 [NASA ADS] [CrossRef] [Google Scholar]
- Wuyts, S., Förster Schreiber, N. M., Genzel, R., et al. 2012, ApJ, 753, 114 [NASA ADS] [CrossRef] [Google Scholar]
Appendix A: Gini-M20 at 1.5 and 4.4 μm
In this Appendix, we complement the results presented in Sect. 3.1.1 deriving the Gini and M20 diagnostics in the UV and near-IR regime through the analysis of NIRCam images in the F150W and F444W bands.
Firstly, we resample NIRCam images to a common pixel scale of 0.06 arcsec to avoid biases due to the different drizzling of the data (see Appendix A in Costantin et al. 2023b). In this case, the PSF FWHM is 0.05 and 0.15 arcsec at 1.5 and 4.4 μm, respectively. Then, we measure the nonparametric morphology of each galaxy as detailed in Sect. 3.1 and compare it with the one derived at 5.6 μm in Figs. A.1 and A.2.
As expected, we further stress how the structure of galaxies changes from UV to optical/near-IR wavelengths, transitioning from irregular to regular morphologies in the Gini-M20 diagram. We derive median Gini and
and  at 1.5 μm, while we measure Gini
 and
and  at 4.4 μm. The overall distribution of galaxies in Fig. A.1 is consistent with the one in Fig. 2, despite the NIRCam dataset being ∼4 times more resolved. This mainly translates into higher Gini (more concentrated galaxies). At 4.4 μm, galaxies show again very compatible M20 but larger Gini coefficient with respect to F560W values (1% and 12% relative difference, respectively), resulting in slightly more concentrated light distributions, possibly explained by the combination of different resolutions and rest-frame wavelengths probed by NIRCam and MIRI.
Appendix B: Morphological statistics at 5.6 μm
Sample galaxies and morphological statistics at 5.6 μm, ordered by increasing redshift.
Continued.
All Tables
Sample galaxies and morphological statistics at 5.6 μm, ordered by increasing redshift.
All Figures
|
Fig. 1. MIRI/F560W, NIRCam/F356W, and NIRCam/F150W RGB images of the 49 galaxies studied in this work, ordered by increasing redshift. The cutouts are 2×2 arcsec2. We report the angular resolution as the FWHM of the MIRI PSF. |
| In the text | |
|
Fig. 2. Gini-M20 diagram. The orange stars and green dots correspond to the nonparametric morphology measured on MIRI F560W and WFC3 F160W images, respectively. For each galaxy, gray lines link the observed morphology at different wavelengths. The ETGs, LTGs, and mergers are separated according to Eqs. (4) in Lotz et al. (2008). |
| In the text | |
|
Fig. 3. Gini-M20 diagram based on MIRI F560W morphology, separating galaxies at 3<z<3.75 with log(M⋆/M⊙)<9.5 (low-z/low-M⋆; blue dots and shaded region), galaxies at 3<z<3.75 with log(M⋆/M⊙)>9.5 (low-z/high-M⋆; green stars and shaded region), and galaxies at 3.75<z<5 (high-z/all-M⋆; red squares and shaded region). ETGs, LTGs, and mergers are separated according to Eqs. (4) in Lotz et al. (2008). |
| In the text | |
|
Fig. 4. C-A diagram based on MIRI F560W morphology, separating galaxies at 3<z<3.75 with log(M⋆/M⊙)<9.5 (low-z/low-M⋆; blue dots and shaded region), galaxies at 3<z<3.75 with log(M⋆/M⊙)>9.5 (low-z/high-M⋆; green stars and shaded region), and galaxies at 3.75<z<5 (high-z/all-M⋆; red squares and shaded region). Mergers and late-type galaxies are separated according to Conselice (2003). The boundaries between late-type galaxies and intermediate galaxies are defined as in Bershady et al. (2000). |
| In the text | |
|
Fig. 5. Gini-M20 diagram, color-coded according to concentration (left panel) and deviation (right panel). The galaxies are divided into low-z/low-M⋆ (dots), low-z/high-M⋆ (stars), and high-z/all-M⋆ (squares). The inset plot shows the density distribution, as reported in Fig. 3. |
| In the text | |
|
Fig. 6. Same as Fig. 5, but for the effective radius (left panel) and Sérsic index (right panel). Galaxy ID 1635 is marked with an “X”, since it has no parametric model. |
| In the text | |
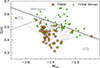 |
Fig. A.1. As Fig. 2, but for MIRI F560W (orange stars) and NIRCam F150W images (green dots). |
| In the text | |
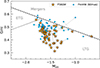 |
Fig. A.2. As Fig. 2, but for MIRI F560W (orange stars) and NIRCam F444W images (cyan dots). |
| In the text | |
Current usage metrics show cumulative count of Article Views (full-text article views including HTML views, PDF and ePub downloads, according to the available data) and Abstracts Views on Vision4Press platform.
Data correspond to usage on the plateform after 2015. The current usage metrics is available 48-96 hours after online publication and is updated daily on week days.
Initial download of the metrics may take a while.