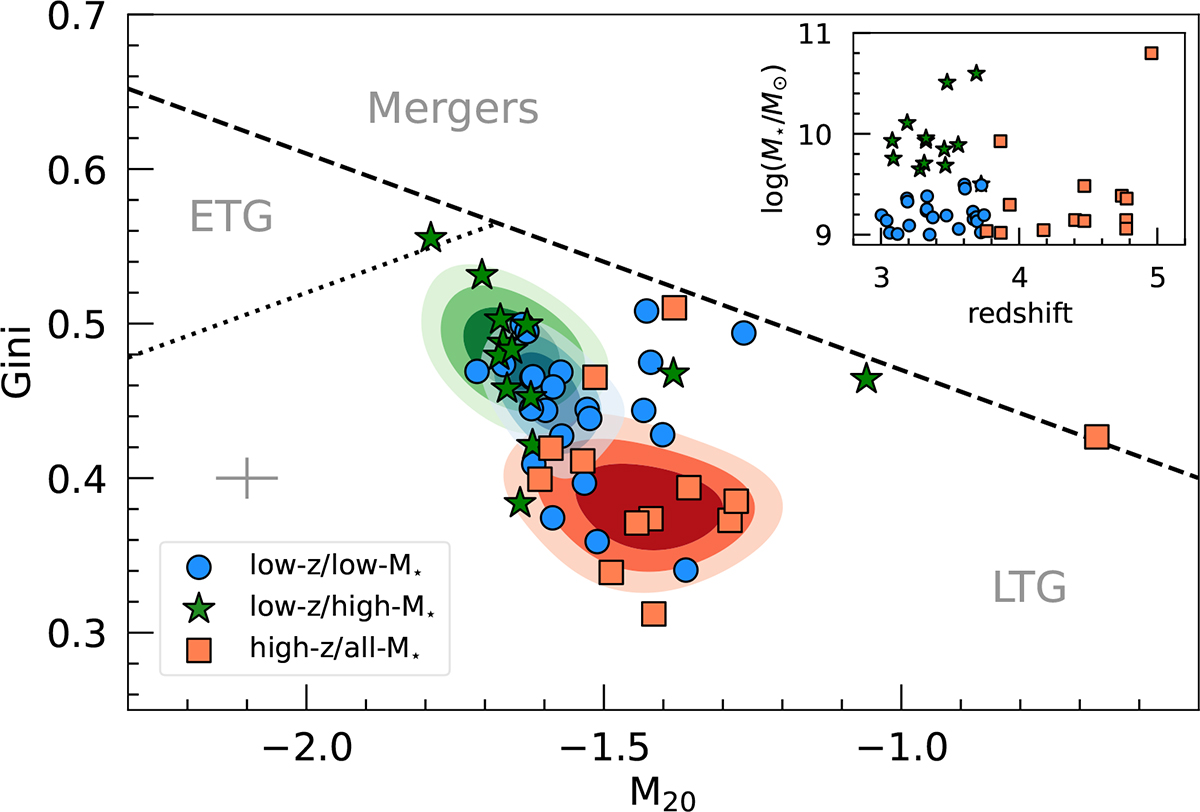
Fig. 3.
Download original image
Gini-M20 diagram based on MIRI F560W morphology, separating galaxies at 3<z<3.75 with log(M⋆/M⊙)<9.5 (low-z/low-M⋆; blue dots and shaded region), galaxies at 3<z<3.75 with log(M⋆/M⊙)>9.5 (low-z/high-M⋆; green stars and shaded region), and galaxies at 3.75<z<5 (high-z/all-M⋆; red squares and shaded region). ETGs, LTGs, and mergers are separated according to Eqs. (4) in Lotz et al. (2008).
Current usage metrics show cumulative count of Article Views (full-text article views including HTML views, PDF and ePub downloads, according to the available data) and Abstracts Views on Vision4Press platform.
Data correspond to usage on the plateform after 2015. The current usage metrics is available 48-96 hours after online publication and is updated daily on week days.
Initial download of the metrics may take a while.