| Issue |
A&A
Volume 676, August 2023
|
|
|---|---|---|
| Article Number | A26 | |
| Number of page(s) | 18 | |
| Section | Extragalactic astronomy | |
| DOI | https://doi.org/10.1051/0004-6361/202346531 | |
| Published online | 31 July 2023 | |
Sub-millimetre galaxies with Webb
Near-infrared counterparts and multi-wavelength morphology
1
Cosmic Dawn Center (DAWN), Denmark
2
DTU-Space, Elektrovej, Building 328, 2800, Kgs., Lyngby, Denmark
e-mail: This email address is being protected from spambots. You need JavaScript enabled to view it.
3
Niels Bohr Institute, University of Copenhagen, Jagtvej 128, 2200 Copenhagen N, Denmark
4
Dept. of Physics and Astronomy, University College London, Gower Street, London, WC1E 6BT
UK
5
Kapteyn Astronomical Institute, University of Groningen, PO Box 800 9700 AV Groningen, The Netherlands
6
European Southern Observatory, Karl-Schwarzschild-Str. 2, 85748 Garching bei München, Germany
Received:
28
March
2023
Accepted:
6
June
2023
Abstract
We utilised the unprecedented depth and resolution of recent early-release science (ERS) JWST observations to define the near-infrared counterparts of sub-millimetre galaxies (SMGs). We identified 45 SCUBA-2 SMG positions within the Cosmic Evolution Early Release Science (CEERS) survey JWST/NIRCam fields. Through an analysis of multi-wavelength p-values, NIRCam colours and predicted SCUBA-2 fluxes, we define 43 JWST/NIRCam counterparts to the SCUBA-2 SMGs, finding a 63 per cent agreement with those identified in prior HST studies. Using EaZy-py, we fitted the available HST and JWST observations to quantify the photometric redshifts of the NIRCam-SMGs, establishing a broad range of redshift from z ≈ 0.2–5.4 with a median of z ≈ 2.29, in agreement with other studies of SMGs. We identified significant variations in the morphology of the NIRCam-SMGs from isolated discs and spheroidal galaxies to irregular interacting systems. We analysed their rest-frame optical and near-infrared morphological properties (e.g. effective radius (Re), Sérsic index (n), concentration (C), asymmetry (A), clumpiness (S), as well as the Gini and M20 parameters), finding, on average, late-type disc-like morphologies with large scatter into the intermediate and merger regions of the non-parametric parameter space. For the non-merging galaxies, we find a median rest-frame optical size and Sérsic index (and 1σ scatter) of Re = 3.10 ± 1.67 kpc and n = 0.96 ± 0.66. Whilst in the rest-frame near-infrared, we establish more compact, higher Sérsic index morphologies (Re = 1.64 ± 0.97, n = 1.85 ± 0.63). We further establish that both the rest-frame optical and near-infrared effective radii correlate negatively (at a 2σ level) with redshift, whilst the Sérsic index remains constant with cosmic time. Our results are consistent with the picture of inside-out galaxy evolution, with more centrally concentrated older stellar populations, and more extended, younger star-forming regions whose stellar emission is heavily attenuated in the central regions.
Key words: galaxies: high-redshift / galaxies: structure / galaxies: evolution / submillimeter: galaxies
© The Authors 2023
 Open Access article, published by EDP Sciences, under the terms of the Creative Commons Attribution License (https://creativecommons.org/licenses/by/4.0), which permits unrestricted use, distribution, and reproduction in any medium, provided the original work is properly cited.
This article is published in open access under the Subscribe to Open model. This email address is being protected from spambots. You need JavaScript enabled to view it. to support open access publication.
1. Introduction
Sub-millimetre galaxies (SMGs), defined by their excess (≳1 – 2 mJy) sub-millimetre (450, 850 μm) flux, were first identified in ground-based wide-field single-dish observations from telescopes such as the Sub-millimetre Common-User Bolometer Array (SCUBA; e.g. Smail et al. 1997; Eales et al. 1999)1. In the last few decades, continued analysis has shown these sub-millimetre bright systems constitute a unique, massive (∼1011 M⊙; Wardlow et al. 2011; Simpson et al. 2014) galaxy population that is heavily dust-obscured and far-infrared (FIR) luminous, commonly exhibiting intense star formation rates (∼102 – 103 M⊙ yr−1; Blain et al. 2002; Chapman et al. 2005; Swinbank et al. 2014).
Reproducing these extremely dusty, massive systems in simulations has been a long-standing problem (e.g. Baugh et al. 2005; Davé et al. 2010; McAlpine et al. 2019). Oftentimes simulations have to be tuned to reproduce the sub-millimetre number counts and redshift distribution, invoking novel modelling assumptions (e.g. top-heavy initial mass function; Cowley et al. 2019). More recent simulations with complex dust models or sub-millimetre flux scaling relations (e.g. Lovell et al. 2021; Hayward et al. 2021) have had more success and established that the sub-millimetre bright phases are a natural consequence of massive galaxy evolution in a ΛCDM universe (e.g. Long et al. 2022; Lower et al. 2023; Cochrane et al. 2023). Despite these recent successes, constraining the multi-wavelength properties of sub-millimetre bright galaxies across cosmic time still poses many observational challenges due to their inherent faintness at optical to infrared wavelengths (e.g. Dey et al. 1999; Weiß et al. 2009; Hodge et al. 2012; Smail et al. 2021).
To ascertain the cosmic evolution of SMGs, their full multi-wavelength (UV to far-infrared) properties need to be quantified. In the far-infrared, wide-field single-dish observations, although often incredibly deep (1σ depth of 2 mJy beam−1; Smail et al. 1997) which is crucial for identifying SMGs, suffer from large beam sizes and poor resolution. For instance, the Sub-millimetre Common-User Bolometer Array 2 (SCUBA-2; Dempsey et al. 2013) at 850 μm has a 14.5″ full width half maximum (FWHM; Holland et al. 2013). Thus identifying the individual multi-wavelength counterparts to the sub-millimetre selected galaxies is very challenging (e.g. Ivison et al. 2007; Biggs et al. 2011; Chen et al. 2016; An et al. 2018). This is compounded at optical – near-infrared wavelengths where SMGs are inherently faint due to their extremely dusty nature, and telescopes such as the Hubble Space Telescope (HST) provide sub-arcsecond resolution revealing a multitude of potential counterparts (e.g. Zavala et al. 2018; Ling & Yan 2022; Shim et al. 2022).
In recent years, high-resolution continuum observations from the Atacama Large Millimetre/sub-millimetre Array (ALMA) have followed up on single-dish surveys, identifying individual galaxy counterparts at sub-millimetre wavelengths (see Hodge & da Cunha 2020 for a review of ALMA SMG studies). A large fraction of these observations have identified that SMGs commonly reside in over-dense regions (e.g. Simpson et al. 2014; Hodge et al. 2016; Miller et al. 2018; Oteo et al. 2018), with 10–80% of bright single-dish sub-millimetre sources being found to be compromised of two or more individual SMGs when observed at sub-mJy rms depths (e.g. Karim et al. 2013; Simpson et al. 2014; Stach et al. 2018; An et al. 2019). A single bright sub-millimetre source, however, can be comprised of multiple SMGs over a broad range of redshifts. Both the negative K-correction, which effectively fixes the luminosity as a function of redshift (e.g. Hill et al. 2018), or alternatively strong gravitational lensing (e.g. Weiß et al. 2013; Díaz-Sánchez et al. 2017; Harrington et al. 2021) can contribute to this ‘line-of-sight’ blending.
Studies such as Hodge et al. 2016; Gullberg et al. 2019; Cochrane et al. 2021, which utilised sub-arcsecond resolution (≤0 2) observations with ALMA, have revealed compact (∼few kpc) dusty galaxies, often with observed-frame far-infrared disc-like morphologies (i.e. n ≈ 1) and kinematics (e.g. Lelli et al. 2021; Rizzo et al. 2021). In contrast, rest-frame ultra-violet HST studies of z ≈ 1–3 SMGs identified extended (Rdust/Rstellar ≈ 0.6) irregular morphologies with multiple components (e.g. Swinbank et al. 2010; Chen et al. 2015; Gómez-Guijarro et al. 2018; Zavala et al. 2018; Lang et al. 2019; Ling & Yan 2022).
Detecting and resolving SMGs’ rest-frame near-infrared emission, which reflects the bulk of the stellar population, has, however, previously been incredibly challenging. Observations with the Infrared Array Camera (IRAC; Fazio et al. 2004) on the Spitzer space telescope, whilst providing the required near-infrared wavelength coverage from 3.6–8 μm, lacks the spatial (sub-arcsecond) resolution required to constrain the underlying morphologies of the stellar emission in SMGs (e.g. Krick et al. 2021). With the advent of recent high-resolution observations from JWST, the near-infrared counterparts of sub-millimetre bright galaxies can be identified and their subsequent properties (e.g. stellar morphology) quantified. With JWST observations, we can robustly constrain the total mass budget of this unique galaxy population and constrain their evolution across cosmic time.
To this end, in this paper, we present an analysis of the infrared counterparts to SCUBA-2 450 and 850 μm selected SMGs detected in public JWST observations from the early-release science programme; The Cosmic Evolution Early Release Science (CEERS; programme ID:1345, PI: Finkelstein; Bagley et al. 2023)2 survey. In Sect. 2, we define the sample of SCUBA-2 SMGs that have been observed with JWST and compile the public multi-wavelength data. Through an analysis of the near-infrared NIRCam colours, multi-wavelength (850 μm, 24 μm, 4.44 μm) p-values, and predicted spectral energy distribution (SED) fluxes, we first identified the NIRCam counterparts to the SMGs in Sect. 3 before analysing their rest-frame multi-wavelength morphology in Sect. 4 and summarising our analysis in Sect. 5. Throughout the paper, we assume a ΛCDM cosmology with Ωm = 0.3, ΩΛ = 0.7, and H0 = 70 km s−1 Mpc−1. All quoted magnitudes are on the AB system and stellar masses were calculated assuming a Chabrier initial mass function (IMF; Chabrier 2003).
2. Sample selection
To identify the near-infrared counterparts to the SMGs observed with JWST, we first compile a list of previously characterised SMGs in the literature, including samples from Zavala et al. 2017; Geach et al. 2017. We then cross-match this sample with the JWST/NIRCam observations from the Cycle 1 ERS programme CEERS, resulting in 45 SCUBA-2 pointings falling within the field of view of the NIRCam observations. This sample of 45 is comprised of both 850 μm and 450 μm SCUBA-2 pointings from the Zavala et al. (2017) sample3, as we describe in the next section and present in Table 1.
Summary of the SCUBA-2 SMGs identified in CEERS Epoch 1 NIRCam Imaging.
2.1. SCUBA-2 observations
We utilise the sample of SMGs presented in Zavala et al. (2017) which were observed with SCUBA-2 camera on the James Clark Maxwell Telescope (JCMT) between 2012 and 2015 as part of the SCUBA-2 Cosmic Legacy Survey (S2CLS; Geach et al. 2017) in the extragalactic deep field Extended Growth Strip (EGS; Davis et al. 2007). The SMG sample defined in Zavala et al. (2017) derive from the ‘deep tier’ observations of the survey, whilst the ‘wider tier’ observations are presented in Geach et al. (2017). For details of the observations, data reduction and SMG identification we refer the reader to Zavala et al. (2017) and references therein.
In short, observations were carried out at 450 and 850 μm in the EGS field with 8 and 14.5″ FWHM beams respectively. The 450 (850) positions, signal-to-noise (S/N) ratio and fluxes of the SMGs are reported in Appendix A of Zavala et al. (2017) and summarised in Table 1. We use these target positions and 450 (850) beam sizes as positions and search radii, respectively, within JWST/NIRCam observations to identify near-infrared counterparts to the SCUBA-2 SMGs. If the SCUBA-2 SMG is detected in both 450 and 850 μm observations, we use the 450 position and beam due to its smaller FWHM. The 850 μm selected SMGs have a deboosted median (and 16th–84th quartile) flux of S850 = 1.62 mJy beam−1 whilst the 450μm selected SMGs have a median (and 16th–84th quartile) deboosted flux of S450 = 5.2
 mJy beam−1.
2.2. HST and JWST/NIRCam observations
To identify the near-infrared counterparts of the 45 SMGs outlined above we analyse the CEERS Epoch 1 JWST/NIRCam imaging. The NIRCam imaging covers 34.7 sq. arcmin of the EGS field with observations taken in both short wavelength (F115W, F200W) and long wavelength (F277W, F356W, F444W) filters. The level-2 data products were downloaded from STScI portal4 and processed using Grizli pipeline (Brammer & Matharu 2021; Brammer et al. 2022) with routines to derive accurate NIRCam photometric zeropoints and correct for cosmic rays and stray light (e.g. Boyer et al. 2022; Nardiello et al. 2022; Bradley et al. 2022a). Further incorporating available optical and near-infrared HST observations from the Complete Hubble Archive for Galaxy Evolution (CHArGE; Kokorev et al. 2022), the final images were aligned to Gaia DR3 (Gaia Collaboration 2021) and drizzled (Fruchter & Hook 2002) to a resolution of 0.04″ per pixel.
Sources were then identified using SEP5 (Barbary et al. 2016), a python-wrapped Source Extractor (Bertin & Arnouts 1996) run on a noise-weighted combined long-wavelength channel NIRCam image (F277W + F356W + F444W). Aperture photometry was performed on each source using 0 5 circular apertures corrected to ‘total’ values within an elliptical Kron aperture as defined in (Kron 1980)6. The aperture correction is derived on the long-wavelength detection image and applied to all bands. For the HST wavelength bands we apply an additional correction of order 10 per cent to correct for flux outside the Kron aperture, derived from curve of growth analysis of the PSFs7.
For each source identified in the CEERS Epoch 1 observations, we run the EaZy-py8 (Brammer et al. 2008) SED fitting code on the available HST and JWST photometry to derive photometric redshifts. We use thirteen templates from the Flexible Stellar Populations Synthesis code (FSPS; Conroy & Gunn 2010) described in Kokorev et al. (2022) linearly combined to allow for maximum flexibility. We note however given the uncertainties associated with SED fitting (e.g. Pacifici et al. 2023) we only focus on the photometric redshift, dust attenuation and 450 and 850 μm predicted fluxes for our analysis. Further defining the full SED of the NIRCam-SMGs will be presented in future papers. Examples of the Eazy-py SED fitting are given in Appendix B. We now use the positions, fluxes, and photometric redshift information for all the sources in CEERS NIRCam observations, in addition to the ancillary multi-wavelength data described in the next section, to identify the SMG counterparts.
2.3. Ancillary data
In addition to the JWST/NIRCam and SCUBA-2 observations detailed in prior sections, we take advantage of other publicly available multi-wavelength observations of the EGS field to aid the identification of the near-infrared counterparts of the SMGs. For each of the SCUBA-2 positions outlined in Table 1, we compile the available Radio 1.4 GHz data products from the All Wavelength Extended Groth Strip International Survey (AEGIS20; Ivison et al. 2007) and MIPS 24 μm data products (images and source catalogue) from the Far-Infrared Deep Extragalactic Legacy (FIDEL; PI: Dickinson & FIDEL Team 2007) survey. We identify five sources with 1.4 GHz counterparts to the sub-millimetre detection, within the SCUBA-2 (450/850) beam as listed in Table 1. All the SCUBA-2 SMG pointings are identified to have MIPS 24 μm imaging with the majority (40/45) having 24 μm sources identified in the SCUBA-2 beam, as derived by the FIDEL consortium9. Using this multi-wavelength dataset for each of the SCUBA-2 positions we proceed to first identify the near-infrared counterpart of the SMGs and then measure their multi-wavelength morphological properties.
3. Near-Infrared counterparts
Defining the near-infrared counterparts of the SMGs requires us to analyse all the available multi-wavelength data for each SCUBA-2 SMG. Firstly, for the SCUBA-2 SMG positions detailed in Table 1, we make 15″ × 15″ NIRCam F444W cutouts centred on the 850 μm or 450 μm SCUBA-2 source position. As shown in Fig. 1, we then overlay all the potential NIRCam sources which fall within the beam. Using a combination of p-values, near-infrared colours, EaZy-py predicted SCUBA-2 fluxes, and dust attenuation AV, as described in the following sections, we define a decision tree to identify the near-infrared counterparts of the SMGs (see Appendix A).
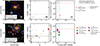 |
Fig. 1. Two examples of the multi-wavelength data used to identify the NIRCam-SMGs for 450 μm (upper) and 850 μm (lower) detected SCUBA-2 SMGs. We show a F277W, F356W, F444W three colour NIRCam image centred on the SCUBA-2 position (a). In panel b we correlate the NIRCam F200W–F444W colour with the EaZy-pyAV values for the NIRCam sources, where the marker size reflects the MIPS to F444Wp-value of the NIRCam source (lower p-value, larger marker) and the grey-dashed line indicates a colour of zero. Finally in panel c the Eazy-py predicted fluxes as a function of MIPS to F444Wp-values are shown. We also indicate the classical p-value < 0.1 threshold (vertical blue-dashed line) and observed 450 μm (850 μm) deboosted SCUBA-2 fluxes (red-dashed horizontal lines). NIRCam SMGs are identified, following the decision tree (Appendix A), by having high AV, red colour, low p-values and EaZy-py predicted fluxes comparable to the SCUBA-2 fluxes in Zavala et al. (2017). |
3.1. NIRCam colours and dust attenuation
It is well known that SMGs will exhibit very red optical-to-infrared colours due to their extremely dusty nature (e.g. Dey et al. 1999; Weiß et al. 2009; Walter et al. 2012). Thus, to aid our identification of the SMGs in the JWST/NIRCam observations, we calculate the F200W–F444W colour for each potential counterpart within the SCUBA-2 beam. We correlate this NIRCam colour with the dust attenuation (AV) from EaZy-py SED fitting as detailed in Sect. 2.2. Given the degeneracy between infrared colour and dust attenuation, we expect the SMGs’ NIRCam counterparts to occupy the top-right of this plane with ‘red’ NIRCam colour and high AV value (e.g. Martis et al. 2022). We show an example of the correlation between F200W–F444W colour and AV in Fig. 1.
3.2. Multi-wavelength p-values and predicted fluxes
Classically the SMG-counterpart selection is achieved through p-value calculations. This method is typically used to identify radio or far-infrared counterparts. In addition to the well-known FIR-radio correlation (e.g. Barger et al. 2014), the FIR source density is often low and the FWHM of the observations is ∼few arcsec, thus reducing the probability of source mis-identification. First introduced in Downes et al. (1986), the p-value corresponds to the probability the counterpart identified is a ‘by-chance’ association. The p-value is a function of the magnitude of the potential counterpart and its proximity to the beam centre, whereby brighter and closer counterparts will have lower p-values. Typically counterparts with p(m, r) < 0.1 are used as the selection criteria (e.g. Ivison et al. 2007; Biggs et al. 2011; Zavala et al. 2018).
For our analysis, we calculate the p-value to go from the SCUBA-2 450 μm (850 μm) beam to MIPS 24 μm imaging and then MIPS 24 μm to F444W NIRCam imaging. For the five sources without MIPS coverage we calculate the p-value to go from SCUBA-2 450 μm (850 μm) to F444W NIRCam directly. In addition to the p-values of the NIRCam sources, we can also use their predicted 450 μm (850 μm) SCUBA-2 fluxes from the EaZy-py code (Sect. 2.2), as further information in the counterpart identification10. For each SMG position, we plot the EaZy-py predicted SCUBA-2 450 μm (850 μm) fluxes as a function of the MIPS 24 μm to F444Wp-values, an example of which is shown in Fig. 1. We also overlay the observed SCUBA-2 450 μm (850 μm) fluxes from Zavala et al. (2017). We expect the NIRCam counterpart to the SCUBA-2 SMG to exhibit low p-values with SCUBA-2 fluxes comparable to those reported in Zavala et al. (2017). However, we do not use p-values as the only criteria for the NIRCam-SMG selection given the sub-arcsecond resolution of the JWST observations.
3.3. Near-infrared counterparts
To identify the near-infrared counterpart(s) in the NIRCam F444W imaging, we construct a decision tree as shown in Appendix A. The decision tree is designed to consider all of the available information for the SCUBA-2 positions, including the p-values, NIRCam colours, EaZy-py outputs (fluxes, AV), and MIPS coverage to define the most likely SMG counterpart. To make this process more robust, our team have made independent selections of the 45 SMG counterpart(s) using the information shown in Fig. 1 and following the decision tree. We remove eight SCUBA-2 SMGs from the sample, due to poor multi-wavelength data resulting in inconclusive counterpart selection. From the remaining 37 SCUBA-2 SMGs, we identify 43 NIRCam counterparts with 1, 4, and 32 SCUBA-2 SMGs having 3, 2, and 1 NIRCam counterparts respectively. Of the 43 NIRCam counterparts, 23 have 100 per cent agreement in all independent selections. We label these quality 1 (Q1). Counterparts with ≥80% agreement (12/43) are labelled quality 2 (Q2) and < 80% as quality 3 (Q3) (8/43). In the following analysis, we focus on Q1 and Q2 counterparts, but it is important to note that the inclusion of Q3 counterparts does not alter our conclusions. In Fig. 2 we show 6″ × 6″ NIRCam colour images at the positions of the SCUBA-2 SMGs with the NIRCam-SMGs labelled by source ID, which in a number of cases contain multiple NIRCam sources.
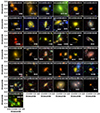 |
Fig. 2. 6″ × 6″ three-band (F115W/F200W, F277W/F356W, F444W) colour images for each SCUBA-2 SMGs with the NIRCam-SMGs labelled. In each image we indicate the ID of the NIRCam counterpart(s) with 1, 4, and 32 SCUBA-2 SMGs having 3, 2 and 1 NIRCam counterparts respectively. It is clear that the sample of NIRCam-SMGs contains a broad range of morphologies from isolated disc and spheroidal galaxies to disturbed interacting systems. We indicate the 11 galaxies classified non-parametrically (and visually) as Mergers from Fig. 5 with an (M). |
For just under half (19/43) of the SCUBA-2 SMGs in our sample, the optical counterparts have previously been identified in HST F160W observations using similar analysis techniques (see Zavala et al. 2018). To validate our counterpart selection we compare to those identified in Zavala et al. (2018), finding agreement with 63% of previously identified sources. We note that given the increased depth and sensitivity of the JWST/NIRCam observations compared to HST/WFC3 used in the Zavala et al. (2018) selection, as well as the difference in observed wavelength (4.44 μm compared to 1.6 μm), our selection is more sensitive to optically faint, redder objects that are not identified in Zavala et al. (2018). Furthermore, studies indicate that a non-negligible fraction sub-mm detected sources are expected to have no counterpart below 3.6 μm (e.g. Franco et al. 2018; Manning et al. 2022) and thus be HST (F160W) dark.
In Fig. 3 we show the photometric redshift distribution of SCUBA-2 SMG NIRCam counterparts (hereafter NIRCam-SMGs) identifying a median redshift (and 16th–84th quartile) of  = 2.29
 which is comparable to that identified in Zavala et al. (2018) for 850 μm selected SMGs. The redshift distribution is also comparable to other studies of single-dish detected SMGs (e.g. Stach et al. 2019; Dudzevičiūtė et al. 2020) indicating the NIRCam-SMGs do not represent a new population of higher redshift SMGs, rather a population undetected by HST. For 15 NIRCam-SMGs we also have a spectroscopic redshift from archival observations. In the inset panel of Fig. 3 we show the correlation between spectroscopic and photometric redshift identifying a median ratio (and 16th – 84th quartile) of zphot/zspec = 1.0
 . If a spectroscopic redshift is available for the NIRCam-SMG we adopt this redshift, as opposed to the EaZy-py photometric redshift, in all following analysis. In future papers, we will present both the complete SED properties of the NIRCam-SMGs (Lee & Vijayan et al. in prep.) and their close environment (Gullberg et al., in prep.). In the following section, we focus on quantifying the multi-wavelength morphology of the NIRCam-SMGs.
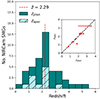 |
Fig. 3. Photometric redshift distribution from EaZy-py for the NIRCam counterparts, with a median redshift of |


4. Multi-wavelength morphology
As shown in Fig. 2, the NIRCam-SMGs exhibit a diverse range of stellar morphology, from compact spheroidal galaxies to extended spiral structures and even potentially merging systems. As a first attempt to quantify the morphology of the galaxies, we employ a non-parametric approach, in which no prior assumptions about the galaxies’ structure are made.
Throughout this section, the analysis is carried out on 0 04 per pixel 10 arcsec cutouts in each filter centred on the NIRCam-SMG identified in Sect. 311. We use the segmentation map generated from SEP (Sect. 2.2) to mask other sources in the cutout, which we dilate using the binary dilation routine in photutils (Bradley et al. 2022b) to ensure full masking of contaminants. Unmasked contaminants would alter the non-parametric measures of morphology, thus we visually inspect the galaxies growth curves to ensure full masking. We further use photutils to model (and remove) the background level in each cutout as well as to quantify the root mean-square (rms) noise. In the following sections ‘cutout’ refers to this 10-arcsec, background subtracted masked cutout and is used in the morphological analysis that follows.
Prior to measuring the morphology of the galaxies we derive the point spread function (PSF) in each NIRCam and HST band. For NIRCam we first use WebbPSF (Perrin et al. 2014) to generate PSF models across the NIRCam detectors for both short- and long-wavelength channels which are calibrated with wavefront models at the epoch of the CEERS observations. For HST we use well-defined PSF models for WFC3 incorporated into grizli12. The PSFs for each filter are then inserted into individual exposures of the final mosaic and drizzled to the final world coordinate system (wcs) solution. For each NIRCam-SMG we evaluate the PSF model at the position of the galaxy, resulting in a position-dependent PSF that accurately resembles the PSF of the final mosaics used in our analysis and accounts for the detector level variations.
4.1. Non-parametric morphology
To constrain the multi-wavelength morphology of the NIRCam-SMGs, we first derive the galaxies’ non-parametric morphology via two independent methods. We first perform a curve of growth analysis in each of the NIRCam and HST WFC3 wavelength bands above 1 μm for the 43 NIRCam-SMGs. This is achieved by fitting a Gaussian profile to the cutout of each galaxy, allowing the centroid (x,y), axis ratio (b/a) and position angle (PA) to vary. We note the original centroid of the cutout is derived from the SEP source detection on the stacked long-wavelength NIRCam bands (Sect. 2.2), and thus may not be the true centre of the galaxy at shorter (bluer) wavelengths. A curve of growth is then derived in each band using ellipses which align to the galaxies axis ratio (b/a) and position angle (PA).
From the curve of growth, examples of which are shown in Fig. 4, we measure the convolved 20, 50, and 80 per cent radii of each galaxy. The intrinsic radii of the galaxies’ are derived by de-convolving the sizes with the PSF size in each band, measured through a similar curve of growth analysis. To quantify the uncertainty on the intrinsic radius of a galaxy, we perform bootstrapping over the rms noise of the cutout with 1000 iterations. The final intrinsic 20, 50, and 80% radii (and uncertainty) of each galaxy are defined as the median (and standard deviation) of these 1000 iterations.
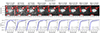 |
Fig. 4. Non-parametric growth-curve analysis for one of the NIRCam-SMGs. For each wavelength band, we show the 5 arcsec cutout, masked regions (red contours) and derived half-light radius (black ellipse) in the upper panel. In the lower panel we show the growth curve from the image (black curve) and growth from the parametric model (blue curve) derived in Sect. 4.2. |
We derive a median (and 16th – 84th quartile) axis ratio of b/a = 0.67 in the NIRCam F444W band. This is comparable to the axis ratio of b/a ∼ 0.6 expected for a population of triaxial ellipsoids and higher than that expected for randomly orientated discs with exponential light profiles (e.g. Law et al. 2012; van der Wel et al. 2014a; Zhang et al. 2019; Robertson et al. 2023; Kartaltepe et al. 2023). The dust (850 μm) morphology of SMGs have also been shown to exhibit similar axis ratios, with Gullberg et al. (2019) reporting a median axis ratio of b/a = 0.62. The median half-light radius in F444W band is Rh = 3.26
 kpc, which is comparable to that derived from similar studies of SMGs (e.g. Zavala et al. 2018; Ling & Yan 2022; Cheng et al. 2023), although we note the rest-frame wavelength probed by these studies various.
We further measure the concentration index (C) of the galaxies stellar light profile in each wavelength band using Eq. (4) from Conselice (2014)13 defined as,
 (1)
(1)
where C28 uses rinner = 20% and router = 80%. A higher concentration indicates a larger fraction of the galaxies light is contained within the central regions. For the NIRCam-SMGs, we derive a median (and 16th – 84th quartile) concentration index of C28 = 3.77 in the NIRCam F444W band. The 16th – 84th quartile is comparable to the range derived for local late-type discs and ellipticals from optical R-band imaging (0.65 μm; Conselice et al. 2003). However, at the median redshift of our sample the F444W band probes the rest-frame ∼1 μm emission, so this is not a direct comparison, as we analyse in Sect. 4.1.
To provide an alternative measure of half-light radius and concentration index, as well as more quantiative morphological indicators, we use the statmorph14 code (Rodriguez-Gomez et al. 2019). We run statmorph on the NIRCam and HST WFC3 wavelength bands above 1 μm for each of the 43 NIRCam-SMGs, using the same segmentation and PSFs as for the growth curve analysis described above. The statmorph code derives the concentration, asymmetry and clumpiness (CAS; Abraham et al. 2003; Lotz et al. 2008; Conselice 2014) parameters which quantify how concentrated, asymmetrical and clumpy the galaxies’ surface brightness profiles are, with higher values indicating more concentrated, asymmetric, clumpier light profiles.
In addition, the Gini and M20 parameters are also derived (for full definitions see Lotz et al. 2004; Snyder et al. 2015). In short, the Gini parameter defines the pixel distribution of the galaxy’s light, where G = 1 means all of the light is concentrated in one pixel whilst G = 0 indicates each pixel contributes equally. The M20 parameter measures the moment of the galaxy’s brightest regions containing 20% of the total flux. This is then normalised by the total light moment for all pixels. Highly negative values indicates a high concentration of light, not necessarily at the centre of the galaxy.
To quantify the uncertainty on the non-parametric measures of morphology, we run statmorph 1000 times, each time adding random noise to the cutout of magnitude equal to the original rms noise measured in the cutout. The final properties (and uncertainty) for each galaxy are defined as the median (and standard deviation) of these 1000 iterations. To validate the robustness of the statmorph measurements we compare the half-light radius and concentration index to that derived from our growth curve analysis. We derive a median (and 16th – 84th quartile) growth curve to statmorph concentration index ratio of C28, GC / C28, statmorph = 1.08 and median half-light radius ratio of Rh, GC / Rh, statmorph = 1.0
 , indicating good agreement between the independent morphological measurements15.
Having quantified the non-parametric morphology of the NIRCam-SMGs we now have multi-wavelength morphological measurements for the 43 NIRCam-SMGs from 1.15 to 4.44 μm. This sample however encapsulates a broad range of rest-frame wavelengths given the redshift range of the NIRCam-SMGs (see Fig. 3) and therefore can not be directly compared. To allow a more accurate comparison, for each NIRCam-SMG, we determine the rest-frame wavelength probed by the multi-wavelength imaging using the galaxy’s redshift, separating the wavelengths into rest-frame optical (0.25 to 0.75 μm) and near-infrared (1.0 to 1.5 μm) samples. In addition, statmorph returns the S/N per pixel for each cutout as well as a quality flag of the non-parametric measurements, with flag = 0 indicating robust measurements were obtained.
If a galaxy has multiple optical or near-infrared measurements we select the measurement with the highest S/N per pixel and further remove any measurements with statmorph flag ≥ 1 and S/N per pixel < 2.5 to ensure the most robust morphological parameters are analysed for each galaxy. In total, this results in 32 and 26 robust non-parametric morphological measurements in the optical and near-infrared respectively for the NIRCam-SMGs for which we summarise the median properties in Table 2.
Median (and 1 − σ) non-parametric morphology of the NIRCam-SMGs at rest-frame optical and near-infrared wavelengths.
The concentration and asymmetry of the NIRCam-SMGs at both rest-frame optical and near-infrared wavelengths (as quantified in Table 2) are comparable to that identified in local irregular galaxies from R-band (0.65 μm) imaging of C28 = 2.7 ± 0.2 and A = 0.17 ± 0.11 (Conselice 2014). However, the local irregular galaxies studied in Conselice (2014) have much higher clumpiness (S = 0.40 ± 0.20) than the NIRCam-SMGs. We suspect this is driven by resolution effects, smoothing out the morphology of the high-redshift galaxies.
In Fig. 5 we correlate the different non-parametric morphology measures, showing the Gini – M20 (left), clumpiness (S) – concentration (middle) and asymmetry – concentration (right) correlations for the optical and near-infrared samples. In each panel, we overlay the different morphological classifications which distinguish between mergers, disc-like galaxies and ellipticals in the local Universe (e.g. Lotz et al. 2008; Conselice et al. 2003; Bershady et al. 2000). On average both optical and near-infrared measurements lie in the disc-like region of the different planes, with some scatter towards intermediate, elliptical-like systems, reflecting the range of morphology seen in Fig. 2. This is typical of the rest-frame optical properties of galaxies identified in the CEERS survey from z = 3 to z = 9 (Kartaltepe et al. 2023) as well as other studies of SMGs non-parametric morphology (e.g. Ling & Yan 2022). The average optical measurement has a larger M20 value at fixed Gini parameter, pushing it closer to the merger region of the Gini – M20 diagram. We infer this could be driven by the optical measurements probing more recent events of star formation (e.g. spiral arms, star-forming clumps) as opposed to the near-infrared measurements that probe the bulk of the older stellar population. We, therefore, expect the optical morphology to be more clumpy and asymmetrical compared to the near-infrared measurements.
 |
Fig. 5. Non-parametric rest-frame optical and near-infrared morphology of the NIRCam-SMGs. We show the Gini and M20 plane (left). The dashed black lines indicate the division between Mergers, Elliptical and Disc galaxies as defined by Lotz et al. (2008). In the middle panel we show the correlation between clumpiness (S) and concentration (C28), with the parameter space of local galaxies from Conselice et al. (2003) overlaid. Finally, in the right panel we show the asymmetry (A) concentration (C28) plane with dashed lines showing the distinction between Mergers, Disc, Intermediate and Ellipticals from Bershady et al. (2000) and Conselice et al. (2003). In all three panels, the optical and near-infrared samples occupy the region with disc-like morphology. |
To investigate this further, for galaxies which have both an optical and near-infrared measurement in Fig. 5 (26 galaxies), we quantify the ratio between the two measurements for each non-parametric parameter. On average we identify no significant offset between the optical and near-infrared concentration or Gini parameters with median ratios of C28, NIR/C28, OPT = 1.02 and GiniNIR/GiniOPT = 1.00 respectively but with an offset in the M20 parameter of M20, NIR/M20, OPT = 1.1. Whilst the optical measurements, for individual galaxies, have on average larger asymmetry and clumpiness with ANIR/AOPT = 0.95 and SNIR/SOPT = 0.73 respectively, reflecting the fact that the optical morphologies trace recent star-formation.
There are a number of NIRCam-SMGs (9) that fall into the non-parametric merger classification in Fig. 5. These objects are indicated by the ‘M’ in Fig. 2. Visual inspection of their morphology further indicates the presence of potential galaxy interactions and we also flag two other NIRCam-SMGs as mergers, S2CLS-EGS-450.18 and S2CLS-EGS-850.108, from visual inspection. Previous studies of SMGs have suggested they commonly reside in over-dense environments and are prone to galaxy interactions (e.g. Conselice et al. 2003; Oteo et al. 2018; An et al. 2019; Cardona-Torres et al. 2023; Calvi et al. 2023). However, this is in contrast to more recent JWST studies of ALMA-detected SMGs that on average identify isolated systems with stable disc-like morphologies (e.g. Chen et al. 2022, 2023). To investigate the NIRCam-SMGs morphology further, we undertake a parametric analysis of the non-merging systems, as discussed in the next section, using the non-parametric measures (e.g. x,y, PA, and b/a) as priors.
4.2. Parametric morphology
The parametric modelling of the SMG counterparts is carried out using GalfitM16 (Häußler et al. 2013). GalfitM is a multi-wavelength wrapper for Galfit (Peng et al. 2010), in which a range of parametric models can be fitted to a galaxy’s morphology as a function of wavelength. The model parameters can be constrained to be independent at each wavelength provided or vary following some functional form (Häußler et al. 2022).
For our analysis, we fitted17 all wavelength bands above 1μm (with a S/N per pixel > 2.5) from HST WFC3 and JWST NIRCam with a single Sérsic model, convolved with the PSF, using GalfitM. We fix the centroid (x, y), axis ratio (b/a), and position angle (PA) to be constant across the wavelength bands, allowing the effective radius (Re) and Sérsic index (n) to vary linearly whilst the magnitude is modelled quadratically as a function of wavelength (Häußler et al. 2022). We also provide GalfitM with a sigma image for each source generated from the ERR18 extension of the final mosaics.
We identify a median (and 16th – 84th quartile) ratio of GalfitM to statmorph Sérsic index and half-light radius of nGalfitM/nstatmorph = 0.98 and Rh, GalfitM/Rh, statmorph = 0.97
 respectively, indicating strong agreement between the two independent measures of parametric morphology. Despite the agreement between the two parametric codes, it does not guarantee that the galaxies’ underlying morphology is well-modelled by a single Sérsic model. Given the complex morphologies seen in Fig. 2 and the broad scatter in non-parametric morphology in Fig. 5, as well as the diverse morphology identified in previous SMG studies (e.g Conselice et al. 2003; Chang et al. 2018; Calvi et al. 2023), the NIRCam-SMGs morphology may in fact be more accurately described by a two-component model.
To investigate this further, we perform two-component multi-wavelength Sérsic fits using GalfitM. We constrain the first component to be an exponential disc (n = 1) and allow the second component’s Sérsic index to vary. This is similar to the approach taken in studies of intermediate redshift galaxies with HST, whose resolved morphologies often show complex multi-component features (e.g. dos Reis et al. 2020). We further constrain the centroid of the two components to be co-located within ±3 pixels (0 12), whilst the axis ratio, position angle and magnitude of the models are constrained in the same way as the single Sérsic fits described above.
To assess whether the two-component fitting is more appropriate, we quantify the quality of GalfitM modelling using both the multi-wavelength reduced chi-squared ( ) and the Bayesian Information Criteria (BIC; Liddle 2007) which are defined as,
 (2)
(2)
 (3)
(3)
 (4)
(4)
where  is the sum of the residual image, Nd is the number of data points, and Nvarys is the number of variable parameters. Both of these statistical parameters reflect the goodness of fit whilst the BIC parameter penalises models with a large number of parameters and is commonly used to determine between two parametric models (e.g. Head et al. 2014; Lange et al. 2016). The model with the lower BIC values and
  close to unity is preferred.
For the single Sérsic fitting we identify a median  = 1.76 with a 16th–84th quartile range of
  = 1.44–4.41. Whilst for two components we establish a median
  = 1.69 with a and 16th–84th quartile range of
  = 1.38–3.60. However, on average the two-component models have a higher BIC value than the single Sérsic models, with ⟨ΔBIC⟩ = ⟨BICsingle − BICtwo⟩= − 172. This indicates that although the two-component model produces smaller residuals, it is over-fitting the morphology of the galaxies and not providing new physical information. We note also two-component models with two free Sérsic indexes produce similar results. We, therefore, proceed with the single Sérsic models to represent the NIRCam-SMGs parametric morphology, an example of which is shown in Fig. 6.
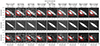 |
Fig. 6. Parametric morphological analysis for a NIRCam-SMG (S2CLS-EGS-450.88) for which we have coverage in every wavelength band. For each filter, we show a 5″ cutout (a) with masked regions (red contours) and a black ellipse which indicates the growth curve derived half-light radius (Sect. 4.1). The multi-wavelength galfitM model and residual are shown in panels (b) and (c) respectively with masked regions indicated as before. For each filter, we indicate the statmorph S/N per pixel as well as the reduced chi-squared per band, and overall, from GalfitM. |
We again split the sample into rest-frame optical and near-infrared measurements as before, removing galaxies with a single-band reduced chi-squared of  and those objects that occupy the non-parametric merger regions in Fig. 5. In total, this results in 25 and 14 robust parametric morphological measurements in the optical and near-infrared of the NIRCam-SMGs respectively. The image, model and residuals for each of the galaxies for this final sample are shown in Appendix C, for which we summarise the median parametric morphology properties in Table 3.
Median (and 1 − σ) parametric morphology of the NIRCam-SMGs at rest-frame optical and near-infrared wavelengths.
On average we identify almost twice as large optical effective radius (∼3 kpc) than in the near-infrared (∼1.64 kpc). Whilst for the Sérsic index, the optical measurements more resemble exponential discs (n = 1) with the rest-frame near-infrared observations having higher Sérsic index of order n ∼ 2. This is similar to the trends seen in the non-parametric morphology and further reflects the near-infrared measurements probing older, less dust-attenuated, stellar populations in the process of bulge-formation (i.e. more compact), whilst rest-frame optical observations are more sensitive to recent star-formation, and consequently dust attenuation, thus seen in the extended regions of galaxies.
To analyse the cosmic evolution of the rest-frame optical and near-IR morphology of the NIRCam-SMGs, in Fig. 7 we correlate the effective radius of the GALFITM model and the Sérsic index with the galaxies’ redshift. We also show a running median (of 5 points) and standard deviation in each panel (squares) along with a linear parametric fit and 1 − σ uncertainty (solid line and shaded region). On each axis, we indicate the redshift distribution of the optical and near-infrared samples.
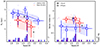 |
Fig. 7. Median rest-frame effective radius (Re; left) and Sérsic index (n; right) for optical and near-infrared parametric sub-samples as a function of redshift. The squares represent the median (and 1 − σ scatter) for redshift and morphological property (Re, n) in a running median. On the x-axis we show the distribution of redshift for each optical and near-infrared sub-samples. For each sub-sample, in each panel, we show a linear parametric fit and 1-σ scatter. We also indicate the median size and Sérsic index from literature studies of SMGs (Swinbank et al. 2014; Gullberg et al. 2019). We identify larger (lower) effective radius (Sérsic index) at optical wavelengths compared to near-infrared measurements, with general a negative (∼2σ) correlation between the SMGs size and redshift whilst no strong correlation is identified with Sérsic index. |
For comparison we show the median 870 μm effective radius and Sérsic index (Re ∼ 0.8 kpc, n ∼ 1) from Gullberg et al. (2019) for 153 bright SMGs with a median redshift of z ≈ 2.9. We also indicate the median H-band (1.6 μm) effective radius and Sérsic index (Re ∼ 2.8 kpc and n ∼ 2) from Swinbank et al. (2014) for 25 SMGs with a median redshift of z ≈ 2.1.
At both optical and near-infrared wavelengths, we identify a negative correlation of order ∼2σ between galaxy effective radius and redshift. In the optical we identify a linear slope of α = −0.92 ± 0.45 whilst for the near-infrared the linear slope is α = −0.74 ± 0.34. This evolution can be attributed to the expected growth of galaxies with cosmic time (e.g.van der Wel et al. 2014b), with the larger optical size reflecting the extended star-forming regions probed in the rest-frame optical.
Our optical and near-infrared continuum sizes are larger than the far-infrared (dust) sizes derived in Gullberg et al. (2019), as expected from the compact nature of the far-IR dust component of these galaxies (e.g. Gullberg et al. 2018; Hodge et al. 2019; Lang et al. 2019). The rest-frame optical sizes are consistent with those reported by Zavala et al. (2018) with Rh = 4.8 ± 0.4 kpc as well as other studies of the SMG morphology with HST (Swinbank et al. 2014; Chen et al. 2015; Ling & Yan 2022). These studies, on average, are probing the rest-frame UV, and thus should only be compared to our optical sample. A similar offset between optical and far-IR, is found in resolved Hα studies of z ∼ 2 SMGs (e.g. Chen et al. 2020) as well as in hydrodynamical simulations of typical high-redshift (1 < z < 5) main-sequence galaxies (e.g. Popping et al. 2022) which both identify significantly larger optical sizes compared to the galaxies’ far-infrared dust sizes.
Using Illustris The Next Generation 50 (TNG50; Nelson et al. 2019) simulation, Popping et al. (2022) identify for high-redshift (2 < z < 3) massive (log10(M*) > 10) galaxies, a FIR (850 μm) to 1.6 μm size ratio of ≤ 0.5. At z = 2.9, our linear parametric fit predicts a rest-frame optical size of 2.45 kpc. Taking the 850 μm size as that derived in Gullberg et al. (2019) (0.8 kpc), we identify an 850 μm to optical size ratio of 0.33. This is comparable to that predicted by Popping et al. (2022), although we note this is not a direct comparison due to the different selection functions across the samples.
In the right-hand panel of Fig. 7 we show the Sérsic index correlation with redshift, identifying a linear slope of α = −0.05 ± 0.23 in the rest-frame optical whilst for the near-infrared the linear slope is α = −0.25 ± 0.44. This indicates there is no correlation with redshift for Sérsic index both at optical and near-infrared wavelengths for the non-merging SMGs in our sample. The elevated near-infrared Sérsic index, in comparison to the optical Sérsic index, might be driven by the compact dusty nature of the SMGs. The dust will heavily attenuate the short-wavelength (optical) emission in the central regions of the galaxies, resulting in centrally less-peaked surface brightness profiles. As a consequence the observed size and Sérsic index would be higher (lower) in the rest-frame optical, than for the intrinsic (un-attenuated) light profiles.
A similar trend has been identified in recent cosmological simulations which identify that massive, intrinsically compact galaxies appear significantly more extended when the affects of dust are taken into account (e.g. Roper et al. 2022, 2023). Our sample is intrinsically selected to have high levels of dust attenuation (Sect. 3), and therefore dust is potentially driving the trends seen in Fig. 7. Recent studies of high-redshift (2 < z < 6) optically faint galaxies have identified high-dust content and compact (Re ∼ 1–2 kpc) near-infrared morphologies (e.g. Nelson et al. 2023). Whilst the dominance of the disc-like morphologies in the rest-frame optical has been shown to continue out to z = 8 (e.g. Ferreira et al. 2022). These studies are in agreement with our morphological analysis of non-merging NIRCam-SMGs, with compact (extended) near-infrared (optical) sizes and disc-dominated optical morphologies out to z = 5.4.
5. Conclusions
In this paper we have presented an analysis of the near-infrared JWST/NIRCam counterparts to 45 previously observed SCUBA-2 sub-mm selected galaxies (Table 1). Through a combination of the multi-wavelength p-values, NIRCam colours and Eazy-py predicted fluxes we construct a decision tree to identify the NIRCam counterpart to each sub-mm selected SCUBA-2 source (Fig. 1). We establish 43 NIRCam counterparts, from 37 SCUBA-2 sources, which cover a broad range of redshift from z ≈ 0.21–5.4 with a median of  = 2.29.
We then proceed to quantify the rest-frame optical and near-infrared morphology of these 43 NIRCam-SMGs, utilising a variety of parametric and non-parametric morphological measures and taking advantage of the unprecedented depth and resolution of the CEERS JWST NIRCam observations (Fig. 2). We establish, on average, the non-parametric measures of the NIRCam-SMGs morphology indicate late-type discs but with a broad scatter with some galaxies exhibiting galaxy interactions and mergers, whilst others resemble elliptical spheroidal systems (Fig. 5). For individual NIRCam-SMGs, we establish the rest-frame optical morphology is on average more asymmetrical and clumpy in comparison to near-infrared morphology, with the largest offset towards higher M20 parameter (Table 2). We infer this is likely driven by the rest-frame optical morphology reflecting recent and on-going star-formation whilst the near-infrared probes the older stellar populations.
The parametric morphology of the galaxies is quantified using GALFITM and is well-modelled by a single component Sérsic model, as we identify two-component models result in over fitting of the data. On average the optical stellar continuum half-light radii exhibit larger sizes (Table 3) than the near-infrared measurements, likely driven by dust attenuation at UV and optical wavelengths. We establish a negative correlation with effective radius and redshift (i.e. larger sizes at later cosmic times; Fig. 7) reflecting the general growth of galaxies and build-up of stellar mass with cosmic time. The median Sérsic index at optical wavelengths is identified to be a factor of 2 smaller than at near-infrared wavelengths, with both exhibiting minimal evolution with cosmic time (Fig. 7). The implications of dust on the observed properties of the NIRCam-SMGs are likely driving the offsets between near-infrared and optical morphologies in addition to the age of the stellar populations probed. Our results are consistent with the picture of inside-out galaxy evolution, with more centrally concentrated older stellar populations, and more extended, younger star-forming regions whose stellar emission is heavily attenuated in the central regions.
Overall we have shown the morphology of single-dished detected SMGs at optical and near-infrared wavelengths is diverse. ranging from compact spheroidal galaxies, grand design spirals and interacting merging systems. We have identified an evolution in morphology from small, disc-dominated structures to more extended galaxies with disc-like optical morphologies and more centrally concentrated (late-type disc) near-infrared morphologies. Future quantification of the morphology and underlying stellar population of SMGs with JWST/MIRI imaging and spectroscopy will further build upon this picture and the wider cosmic evolution of SMGs.
We note SMGs are often also classified as IR-selected dusty star-forming galaxies (DSFG; see Casey et al. 2014 for review), but here we focus on the original single-dish selected definition of SMGs.
We note six of the galaxies in our sample are also studied in Chen et al. (2022) with JWST/CEERS observations, where their selection is based on combined 450 and 850 μm detections and the Zavala et al. (2018) HST counterpart identification.
The photometry catalogue and mosaics are available online https://doi.org/10.17894/ucph.e3d897af-233a-4f01-a893-7b0fad1f66c2.
See https://www.stsci.edu/hst/instrumentation/wfc3/data-analysis/psf for details.
We note however, these can be uncertain when using EaZy-py for the FIR. Discussion of this will be presented in future papers with more sophisticated SED fitting codes.
This cutout size is chosen to optimise the background estimation and modelling of the sources whilst minimising contamination from neighbours and computation time.
See also Abraham et al. (2003).
We note however we expect some variation between the two methods due to the definitions of centroid and total fluxes used in statmorph (see Lotz et al. 2004).
We do not perform simultaneous modelling of galaxies since we have masked out all other objects (see Sect. 4).
The ERR extension is derived from the Grizli pipeline and contains the read and Poisson noise of the observations.
Acknowledgments
We thank the referee for a constructive review and also Ian Smail, Stephen Wilkins, Julie Wardlow, and Oliver Newton for helpful discussions on this project. We would also like to thank the CEERS team for designing and executing the Early Release Science observations upon which this work is based. The observations analysed in this work are made with the NASA/ESA/CSA James Webb Space Telescope (DOI: https://archive.stsci.edu/doi/resolve/resolve.html?doi=10.17909/z7p0-8481). This work made used of the following open-source software; Astropy (Astropy Collaboration 2013, 2018), Photutils (Bradley et al. 2022b), Source Extractor (Bertin & Arnouts 1996) SEP (Barbary et al. 2016) Eazy-py (Brammer & Matharu 2021) GriZli (Brammer et al. 2022) GalfitM (Häußler et al. 2013) The Cosmic Dawn Center (DAWN) is funded by the Danish National Research Foundation (DNRF) under grant No. 140. B.G. acknowledges support from the Carlsberg Foundation Research Grant CF20-0644 ‘Physical pRoperties of the InterStellar Medium in Luminous Infrared Galaxies at High redshifT: PRISM- LIGHT’. A.P.V., I.J. and T.R.G. are grateful for support from the Carlsberg Foundation via grant No. CF20-0534. G.M. acknowledges the Villum Fonden research grants 13160 and 37440. S.J. is supported by the European Union’s Horizon Europe research and innovation programme under the Marie Skłodowska-Curie grant agreement No. 101060888. V.K. acknowledges funding from the Dutch Research Council (NWO) through the award of the Vici Grant VI.C.212.036. Cloud-based data processing and file storage for this work is provided by the AWS Cloud Credits for Research programme. This work was partially supported by DeiC National HPC (g.a. DeiC-DTU-L-20210103) and by the dtu_00026 project.
References
- Abraham, R. G., van den Bergh, S., & Nair, P. 2003, ApJ, 588, 218 [NASA ADS] [CrossRef] [Google Scholar]
- An, F. X., Stach, S. M., Smail, I., et al. 2018, ApJ, 862, 101 [NASA ADS] [CrossRef] [Google Scholar]
- An, F. X., Simpson, J. M., Smail, I., et al. 2019, ApJ, 886, 48 [NASA ADS] [CrossRef] [Google Scholar]
- Astropy Collaboration (Robitaille, T. P., et al.) 2013, A&A, 558, A33 [NASA ADS] [CrossRef] [EDP Sciences] [Google Scholar]
- Astropy Collaboration (Price-Whelan, A. M., et al.) 2018, AJ, 156, 123 [Google Scholar]
- Bagley, M. B., Finkelstein, S. L., Koekemoer, A. M., et al. 2023, ApJ, 946, L12 [NASA ADS] [CrossRef] [Google Scholar]
- Barbary, K., Boone, K., McCully, C., et al. 2016, https://doi.org/10.5281/zenodo.159035 [Google Scholar]
- Barger, A. J., Cowie, L. L., Chen, C. C., et al. 2014, ApJ, 784, 9 [NASA ADS] [CrossRef] [Google Scholar]
- Baugh, C. M., Lacey, C. G., Frenk, C. S., et al. 2005, MNRAS, 356, 1191 [Google Scholar]
- Bershady, M. A., Jangren, A., & Conselice, C. J. 2000, AJ, 119, 2645 [NASA ADS] [CrossRef] [Google Scholar]
- Bertin, E., & Arnouts, S. 1996, A&AS, 117, 393 [NASA ADS] [CrossRef] [EDP Sciences] [Google Scholar]
- Biggs, A. D., Ivison, R. J., Ibar, E., et al. 2011, MNRAS, 413, 2314 [Google Scholar]
- Blain, A. W., Smail, I., Ivison, R. J., Kneib, J. P., & Frayer, D. T. 2002, Phys. Rep., 369, 111 [Google Scholar]
- Boyer, M. L., Anderson, J., Gennaro, M., et al. 2022, Res. Notes Am. Astron. Soc., 6, 191 [Google Scholar]
- Bradley, L. D., Coe, D., Brammer, G., et al. 2022a, ApJ, submitted [arXiv:2210.01777] [Google Scholar]
- Bradley, L., Sipőcz, B., Robitaille, T., et al. 2022b, https://doi.org/10.5281/zenodo.6825092 [Google Scholar]
- Brammer, G., & Matharu, J. 2021, https://doi.org/10.5281/zenodo.5012699 [Google Scholar]
- Brammer, G. B., van Dokkum, P. G., & Coppi, P. 2008, ApJ, 686, 1503 [Google Scholar]
- Brammer, G., Strait, V., Matharu, J., & Momcheva, I. 2022, https://doi.org/10.5281/zenodo.6672538 [Google Scholar]
- Calvi, R., Castignani, G., & Dannerbauer, H. 2023, A&A, accepted [arXiv:2302.10323] [Google Scholar]
- Cardona-Torres, L., Aretxaga, I., Montaña, A., Zavala, J. A., & Faber, S. M. 2023, MNRAS, 520, 5446 [NASA ADS] [CrossRef] [Google Scholar]
- Casey, C. M., Narayanan, D., & Cooray, A. 2014, Phys. Rep., 541, 45 [Google Scholar]
- Chabrier, G. 2003, PASP, 115, 763 [Google Scholar]
- Chang, Y.-Y., Ferraro, N., Wang, W.-H., et al. 2018, ApJ, 865, 103 [NASA ADS] [CrossRef] [Google Scholar]
- Chapman, S. C., Blain, A. W., Smail, I., & Ivison, R. J. 2005, ApJ, 622, 772 [NASA ADS] [CrossRef] [Google Scholar]
- Chen, C.-C., Smail, I., Swinbank, A. M., et al. 2015, ApJ, 799, 194 [NASA ADS] [CrossRef] [Google Scholar]
- Chen, C.-C., Smail, I., Swinbank, A. M., et al. 2016, ApJ, 831, 91 [NASA ADS] [CrossRef] [Google Scholar]
- Chen, C.-C., Harrison, C. M., Smail, I., et al. 2020, A&A, 635, A119 [NASA ADS] [CrossRef] [EDP Sciences] [Google Scholar]
- Chen, C.-C., Gao, Z.-K., Hsu, Q.-N., et al. 2022, ApJ, 939, L7 [NASA ADS] [CrossRef] [Google Scholar]
- Cheng, C., Huang, J.-S., Smail, I., et al. 2023, ApJ, 942, L19 [NASA ADS] [CrossRef] [Google Scholar]
- Cochrane, R. K., Best, P. N., Smail, I., et al. 2021, MNRAS, 503, 2622 [NASA ADS] [CrossRef] [Google Scholar]
- Cochrane, R. K., Hayward, C. C., Anglés-Alcázar, D., & Somerville, R. S. 2023, MNRAS, 518, 5522 [Google Scholar]
- Conroy, C., & Gunn, J. E. 2010, ApJ, 712, 833 [Google Scholar]
- Conselice, C. J. 2014, ARA&A, 52, 291 [CrossRef] [Google Scholar]
- Conselice, C. J., Chapman, S. C., & Windhorst, R. A. 2003, ApJ, 596, L5 [CrossRef] [Google Scholar]
- Cowley, W. I., Lacey, C. G., Baugh, C. M., et al. 2019, MNRAS, 487, 3082 [NASA ADS] [CrossRef] [Google Scholar]
- Davé, R., Finlator, K., Oppenheimer, B. D., et al. 2010, MNRAS, 404, 1355 [NASA ADS] [Google Scholar]
- Davis, M., Guhathakurta, P., Konidaris, N. P., et al. 2007, ApJ, 660, L1 [NASA ADS] [CrossRef] [Google Scholar]
- Dempsey, J. T., Friberg, P., Jenness, T., et al. 2013, MNRAS, 430, 2534 [Google Scholar]
- Dey, A., Graham, J. R., Ivison, R. J., et al. 1999, ApJ, 519, 610 [Google Scholar]
- Díaz-Sánchez, A., Iglesias-Groth, S., Rebolo, R., & Dannerbauer, H. 2017, ApJ, 843, L22 [Google Scholar]
- Dickinson, M., & FIDEL Team 2007, Am. Astron. Soc. Meet. Abstr., 211, 52.16 [Google Scholar]
- dos Reis, S. N., Buitrago, F., Papaderos, P., et al. 2020, A&A, 634, A11 [NASA ADS] [CrossRef] [EDP Sciences] [Google Scholar]
- Downes, A. J. B., Peacock, J. A., Savage, A., & Carrie, D. R. 1986, MNRAS, 218, 31 [NASA ADS] [CrossRef] [Google Scholar]
- Dudzevičiūtė, U., Smail, I., Swinbank, A. M., et al. 2020, MNRAS, 494, 3828 [Google Scholar]
- Eales, S., Lilly, S., Gear, W., et al. 1999, ApJ, 515, 518 [NASA ADS] [CrossRef] [Google Scholar]
- Fazio, G. G., Hora, J. L., Allen, L. E., et al. 2004, ApJS, 154, 10 [Google Scholar]
- Ferreira, L., Conselice, C. J., Sazonova, E., et al. 2022, ApJ, submitted [arXiv:2210.01110] [Google Scholar]
- Franco, M., Elbaz, D., Béthermin, M., et al. 2018, A&A, 620, A152 [NASA ADS] [CrossRef] [EDP Sciences] [Google Scholar]
- Fruchter, A. S., & Hook, R. N. 2002, PASP, 114, 144 [NASA ADS] [CrossRef] [Google Scholar]
- Gaia Collaboration (Brown, A. G. A., et al.) 2021, A&A, 649, A1 [NASA ADS] [CrossRef] [EDP Sciences] [Google Scholar]
- Geach, J. E., Dunlop, J. S., Halpern, M., et al. 2017, MNRAS, 465, 1789 [Google Scholar]
- Gómez-Guijarro, C., Toft, S., Karim, A., et al. 2018, ApJ, 856, 121 [Google Scholar]
- Gullberg, B., Swinbank, A. M., Smail, I., et al. 2018, ApJ, 859, 12 [Google Scholar]
- Gullberg, B., Smail, I., Swinbank, A. M., et al. 2019, MNRAS, 490, 4956 [Google Scholar]
- Harrington, K. C., Weiss, A., Yun, M. S., et al. 2021, ApJ, 908, 95 [NASA ADS] [CrossRef] [Google Scholar]
- Häußler, B., Bamford, S. P., Vika, M., et al. 2013, MNRAS, 430, 330 [Google Scholar]
- Häußler, B., Vika, M., Bamford, S. P., et al. 2022, A&A, 664, A92 [NASA ADS] [CrossRef] [EDP Sciences] [Google Scholar]
- Hayward, C. C., Sparre, M., Chapman, S. C., et al. 2021, MNRAS, 502, 2922 [Google Scholar]
- Head, J. T. C. G., Lucey, J. R., Hudson, M. J., & Smith, R. J. 2014, MNRAS, 440, 1690 [Google Scholar]
- Hill, R., Chapman, S. C., Scott, D., et al. 2018, MNRAS, 477, 2042 [Google Scholar]
- Hodge, J. A., & da Cunha, E. 2020, R. Soc. Open Sci., 7 [Google Scholar]
- Hodge, J. A., Carilli, C. L., Walter, F., et al. 2012, ApJ, 760, 11 [Google Scholar]
- Hodge, J. A., Swinbank, A. M., Simpson, J. M., et al. 2016, ApJ, 833, 103 [Google Scholar]
- Hodge, J. A., Smail, I., Walter, F., et al. 2019, ApJ, 876, 130 [Google Scholar]
- Holland, W. S., Bintley, D., Chapin, E. L., et al. 2013, MNRAS, 430, 2513 [Google Scholar]
- Ivison, R. J., Greve, T. R., Dunlop, J. S., et al. 2007, MNRAS, 380, 199 [Google Scholar]
- Karim, A., Swinbank, A. M., Hodge, J. A., et al. 2013, MNRAS, 432, 2 [Google Scholar]
- Kartaltepe, J. S., Rose, C., Vanderhoof, B. N., et al. 2023, ApJ, 946, L15 [NASA ADS] [CrossRef] [Google Scholar]
- Kokorev, V., Brammer, G., Fujimoto, S., et al. 2022, ApJS, 263, 38 [NASA ADS] [CrossRef] [Google Scholar]
- Krick, J. E., Lowrance, P., Carey, S., et al. 2021, AJ, 161, 177 [NASA ADS] [CrossRef] [Google Scholar]
- Kron, R. G. 1980, ApJS, 43, 305 [Google Scholar]
- Lang, P., Schinnerer, E., Smail, I., et al. 2019, ApJ, 879, 54 [Google Scholar]
- Lange, R., Moffett, A. J., Driver, S. P., et al. 2016, MNRAS, 462, 1470 [NASA ADS] [CrossRef] [Google Scholar]
- Law, D. R., Steidel, C. C., Shapley, A. E., et al. 2012, ApJ, 745, 85 [NASA ADS] [CrossRef] [Google Scholar]
- Lelli, F., Di Teodoro, E. M., Fraternali, F., et al. 2021, Science, 371, 713 [Google Scholar]
- Liddle, A. R. 2007, MNRAS, 377, L74 [NASA ADS] [Google Scholar]
- Ling, C., & Yan, H. 2022, ApJ, 929, 40 [CrossRef] [Google Scholar]
- Long, A. S., Casey, C. M., Lagos, C. d. P., et al. 2022, ApJ, submitted [arXiv:2211.02072] [Google Scholar]
- Lotz, J. M., Primack, J., & Madau, P. 2004, AJ, 128, 163 [NASA ADS] [CrossRef] [Google Scholar]
- Lotz, J. M., Davis, M., Faber, S. M., et al. 2008, ApJ, 672, 177 [NASA ADS] [CrossRef] [Google Scholar]
- Lovell, C. C., Geach, J. E., Davé, R., Narayanan, D., & Li, Q. 2021, MNRAS, 502, 772 [NASA ADS] [CrossRef] [Google Scholar]
- Lower, S., Narayanan, D., Li, Q., & Davé, R. 2023, ApJ, 950, 94 [CrossRef] [Google Scholar]
- Manning, S. M., Casey, C. M., Zavala, J. A., et al. 2022, ApJ, 925, 23 [CrossRef] [Google Scholar]
- Martis, N. S., Marchesini, D. M., Muzzin, A., Willott, C. J., & Sawicki, M. 2022, MNRAS, 518, 4961 [NASA ADS] [CrossRef] [Google Scholar]
- McAlpine, S., Smail, I., Bower, R. G., et al. 2019, MNRAS, 488, 2440 [NASA ADS] [CrossRef] [Google Scholar]
- Miller, T. B., Chapman, S. C., Aravena, M., et al. 2018, Nature, 556, 469 [CrossRef] [Google Scholar]
- Nardiello, D., Bedin, L. R., Burgasser, A., et al. 2022, MNRAS, 517, 484 [NASA ADS] [CrossRef] [Google Scholar]
- Nelson, D., Pillepich, A., Springel, V., et al. 2019, MNRAS, 490, 3234 [Google Scholar]
- Nelson, E. J., Suess, K. A., Bezanson, R., et al. 2023, ApJ, 948, L18 [NASA ADS] [CrossRef] [Google Scholar]
- Oteo, I., Ivison, R. J., Dunne, L., et al. 2018, ApJ, 856, 72 [Google Scholar]
- Pacifici, C., Iyer, K. G., Mobasher, B., et al. 2023, ApJ, 944, 141 [NASA ADS] [CrossRef] [Google Scholar]
- Peng, C. Y., Ho, L. C., Impey, C. D., & Rix, H.-W. 2010, AJ, 139, 2097 [Google Scholar]
- Perrin, M. D., Sivaramakrishnan, A., Lajoie, C. P., et al. 2014, SPIE Conf. Ser., 9143, 91433X [NASA ADS] [Google Scholar]
- Popping, G., Pillepich, A., Calistro Rivera, G., et al. 2022, MNRAS, 510, 3321 [CrossRef] [Google Scholar]
- Rizzo, F., Vegetti, S., Fraternali, F., Stacey, H. R., & Powell, D. 2021, MNRAS, 507, 3952 [NASA ADS] [CrossRef] [Google Scholar]
- Robertson, B. E., Tacchella, S., Johnson, B. D., et al. 2023, ApJ, 942, L42 [NASA ADS] [CrossRef] [Google Scholar]
- Rodriguez-Gomez, V., Snyder, G. F., Lotz, J. M., et al. 2019, MNRAS, 483, 4140 [NASA ADS] [CrossRef] [Google Scholar]
- Roper, W. J., Lovell, C. C., Vijayan, A. P., et al. 2022, MNRAS, 514, 1921 [NASA ADS] [CrossRef] [Google Scholar]
- Roper, W. J., Lovell, C. C., Vijayan, A. P., et al. 2023, ArXiv e-prints [arXiv:2301.05228] [Google Scholar]
- Shim, H., Lee, D., Kim, Y., et al. 2022, MNRAS, 514, 2915 [NASA ADS] [CrossRef] [Google Scholar]
- Simpson, J. M., Swinbank, A. M., Smail, I., et al. 2014, ApJ, 788, 125 [Google Scholar]
- Smail, I., Ivison, R. J., & Blain, A. W. 1997, ApJ, 490, L5 [NASA ADS] [CrossRef] [Google Scholar]
- Smail, I., Dudzevičiūtė, U., Stach, S. M., et al. 2021, MNRAS, 502, 3426 [NASA ADS] [CrossRef] [Google Scholar]
- Snyder, G. F., Torrey, P., Lotz, J. M., et al. 2015, MNRAS, 454, 1886 [NASA ADS] [CrossRef] [Google Scholar]
- Stach, S. M., Smail, I., Swinbank, A. M., et al. 2018, ApJ, 860, 161 [Google Scholar]
- Stach, S. M., Dudzevičiūtė, U., Smail, I., et al. 2019, MNRAS, 487, 4648 [Google Scholar]
- Swinbank, A. M., Smail, I., Chapman, S. C., et al. 2010, MNRAS, 405, 234 [NASA ADS] [Google Scholar]
- Swinbank, A. M., Simpson, J. M., Smail, I., et al. 2014, MNRAS, 438, 1267 [Google Scholar]
- van der Wel, A., Chang, Y.-Y., Bell, E. F., et al. 2014a, ApJ, 792, L6 [NASA ADS] [CrossRef] [Google Scholar]
- van der Wel, A., Franx, M., van Dokkum, P. G., et al. 2014b, ApJ, 788, 28 [Google Scholar]
- Walter, F., Decarli, R., Carilli, C., et al. 2012, Nature, 486, 233 [Google Scholar]
- Wardlow, J. L., Smail, I., Coppin, K. E. K., et al. 2011, MNRAS, 415, 1479 [Google Scholar]
- Weiß, A., Ivison, R. J., Downes, D., et al. 2009, ApJ, 705, L45 [CrossRef] [Google Scholar]
- Weiß, A., De Breuck, C., Marrone, D. P., et al. 2013, ApJ, 767, 88 [Google Scholar]
- Zavala, J. A., Aretxaga, I., Geach, J. E., et al. 2017, MNRAS, 464, 3369 [NASA ADS] [CrossRef] [Google Scholar]
- Zavala, J. A., Aretxaga, I., Dunlop, J. S., et al. 2018, MNRAS, 475, 5585 [Google Scholar]
- Zhang, H., Primack, J. R., Faber, S. M., et al. 2019, MNRAS, 484, 5170 [NASA ADS] [CrossRef] [Google Scholar]
Appendix A: Decision tree
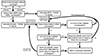 |
Fig. A.1. Schematic of the decision tree used to determine the NIRCam counterpart(s) to the SCUBA-2 selected SMGs. If a MIPS counterpart has been identified in the SCUBA-2 beam then p-values from the MIPS 24μm image to NIRCam F444W are calculated, else directly from SCUBA-2 to NIRCam F444W. Then considering the NIRCam colours and EaZy-py outputs as shown in Figure 1, a decision is made. |
Appendix B: SED fitting
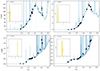 |
Fig. B.1. Eazy-py fitting results for four of the NIRCam counterparts across a broad range of redshift. The inset panel indicates the p(z) distribution. |
Appendix C: GALFITM modelling
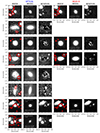 |
Fig. C.1. Rest-frame optical and near-infrared GALFITM modelling of the final rest-frame sample presented in Figure 7. For each NIRCam-SMG we present the 4-arcsecond optical image, GALFITM model and residual. We further indicate the mask regions of nearby objects (red contours) and indicate for each model the redshift, derived Sérsic index, effective radius, instrument band and rest-frame wavelength probed. Where available (14/25) we display the near-infrared image, model and residual. |
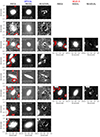 |
Fig. C.1. continued. |
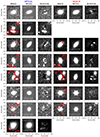 |
Fig. C.1. continued. |
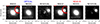 |
Fig. C.1. continued. |
All Tables
Median (and 1 − σ) non-parametric morphology of the NIRCam-SMGs at rest-frame optical and near-infrared wavelengths.
Median (and 1 − σ) parametric morphology of the NIRCam-SMGs at rest-frame optical and near-infrared wavelengths.
All Figures
|
Fig. 1. Two examples of the multi-wavelength data used to identify the NIRCam-SMGs for 450 μm (upper) and 850 μm (lower) detected SCUBA-2 SMGs. We show a F277W, F356W, F444W three colour NIRCam image centred on the SCUBA-2 position (a). In panel b we correlate the NIRCam F200W–F444W colour with the EaZy-pyAV values for the NIRCam sources, where the marker size reflects the MIPS to F444Wp-value of the NIRCam source (lower p-value, larger marker) and the grey-dashed line indicates a colour of zero. Finally in panel c the Eazy-py predicted fluxes as a function of MIPS to F444Wp-values are shown. We also indicate the classical p-value < 0.1 threshold (vertical blue-dashed line) and observed 450 μm (850 μm) deboosted SCUBA-2 fluxes (red-dashed horizontal lines). NIRCam SMGs are identified, following the decision tree (Appendix A), by having high AV, red colour, low p-values and EaZy-py predicted fluxes comparable to the SCUBA-2 fluxes in Zavala et al. (2017). |
| In the text | |
|
Fig. 2. 6″ × 6″ three-band (F115W/F200W, F277W/F356W, F444W) colour images for each SCUBA-2 SMGs with the NIRCam-SMGs labelled. In each image we indicate the ID of the NIRCam counterpart(s) with 1, 4, and 32 SCUBA-2 SMGs having 3, 2 and 1 NIRCam counterparts respectively. It is clear that the sample of NIRCam-SMGs contains a broad range of morphologies from isolated disc and spheroidal galaxies to disturbed interacting systems. We indicate the 11 galaxies classified non-parametrically (and visually) as Mergers from Fig. 5 with an (M). |
| In the text | |
|
Fig. 3. Photometric redshift distribution from EaZy-py for the NIRCam counterparts, with a median redshift of |
| In the text | |
|
Fig. 4. Non-parametric growth-curve analysis for one of the NIRCam-SMGs. For each wavelength band, we show the 5 arcsec cutout, masked regions (red contours) and derived half-light radius (black ellipse) in the upper panel. In the lower panel we show the growth curve from the image (black curve) and growth from the parametric model (blue curve) derived in Sect. 4.2. |
| In the text | |
|
Fig. 5. Non-parametric rest-frame optical and near-infrared morphology of the NIRCam-SMGs. We show the Gini and M20 plane (left). The dashed black lines indicate the division between Mergers, Elliptical and Disc galaxies as defined by Lotz et al. (2008). In the middle panel we show the correlation between clumpiness (S) and concentration (C28), with the parameter space of local galaxies from Conselice et al. (2003) overlaid. Finally, in the right panel we show the asymmetry (A) concentration (C28) plane with dashed lines showing the distinction between Mergers, Disc, Intermediate and Ellipticals from Bershady et al. (2000) and Conselice et al. (2003). In all three panels, the optical and near-infrared samples occupy the region with disc-like morphology. |
| In the text | |
|
Fig. 6. Parametric morphological analysis for a NIRCam-SMG (S2CLS-EGS-450.88) for which we have coverage in every wavelength band. For each filter, we show a 5″ cutout (a) with masked regions (red contours) and a black ellipse which indicates the growth curve derived half-light radius (Sect. 4.1). The multi-wavelength galfitM model and residual are shown in panels (b) and (c) respectively with masked regions indicated as before. For each filter, we indicate the statmorph S/N per pixel as well as the reduced chi-squared per band, and overall, from GalfitM. |
| In the text | |
|
Fig. 7. Median rest-frame effective radius (Re; left) and Sérsic index (n; right) for optical and near-infrared parametric sub-samples as a function of redshift. The squares represent the median (and 1 − σ scatter) for redshift and morphological property (Re, n) in a running median. On the x-axis we show the distribution of redshift for each optical and near-infrared sub-samples. For each sub-sample, in each panel, we show a linear parametric fit and 1-σ scatter. We also indicate the median size and Sérsic index from literature studies of SMGs (Swinbank et al. 2014; Gullberg et al. 2019). We identify larger (lower) effective radius (Sérsic index) at optical wavelengths compared to near-infrared measurements, with general a negative (∼2σ) correlation between the SMGs size and redshift whilst no strong correlation is identified with Sérsic index. |
| In the text | |
|
Fig. A.1. Schematic of the decision tree used to determine the NIRCam counterpart(s) to the SCUBA-2 selected SMGs. If a MIPS counterpart has been identified in the SCUBA-2 beam then p-values from the MIPS 24μm image to NIRCam F444W are calculated, else directly from SCUBA-2 to NIRCam F444W. Then considering the NIRCam colours and EaZy-py outputs as shown in Figure 1, a decision is made. |
| In the text | |
|
Fig. B.1. Eazy-py fitting results for four of the NIRCam counterparts across a broad range of redshift. The inset panel indicates the p(z) distribution. |
| In the text | |
|
Fig. C.1. Rest-frame optical and near-infrared GALFITM modelling of the final rest-frame sample presented in Figure 7. For each NIRCam-SMG we present the 4-arcsecond optical image, GALFITM model and residual. We further indicate the mask regions of nearby objects (red contours) and indicate for each model the redshift, derived Sérsic index, effective radius, instrument band and rest-frame wavelength probed. Where available (14/25) we display the near-infrared image, model and residual. |
| In the text | |
|
Fig. C.1. continued. |
| In the text | |
|
Fig. C.1. continued. |
| In the text | |
|
Fig. C.1. continued. |
| In the text | |
Current usage metrics show cumulative count of Article Views (full-text article views including HTML views, PDF and ePub downloads, according to the available data) and Abstracts Views on Vision4Press platform.
Data correspond to usage on the plateform after 2015. The current usage metrics is available 48-96 hours after online publication and is updated daily on week days.
Initial download of the metrics may take a while.