Open Access
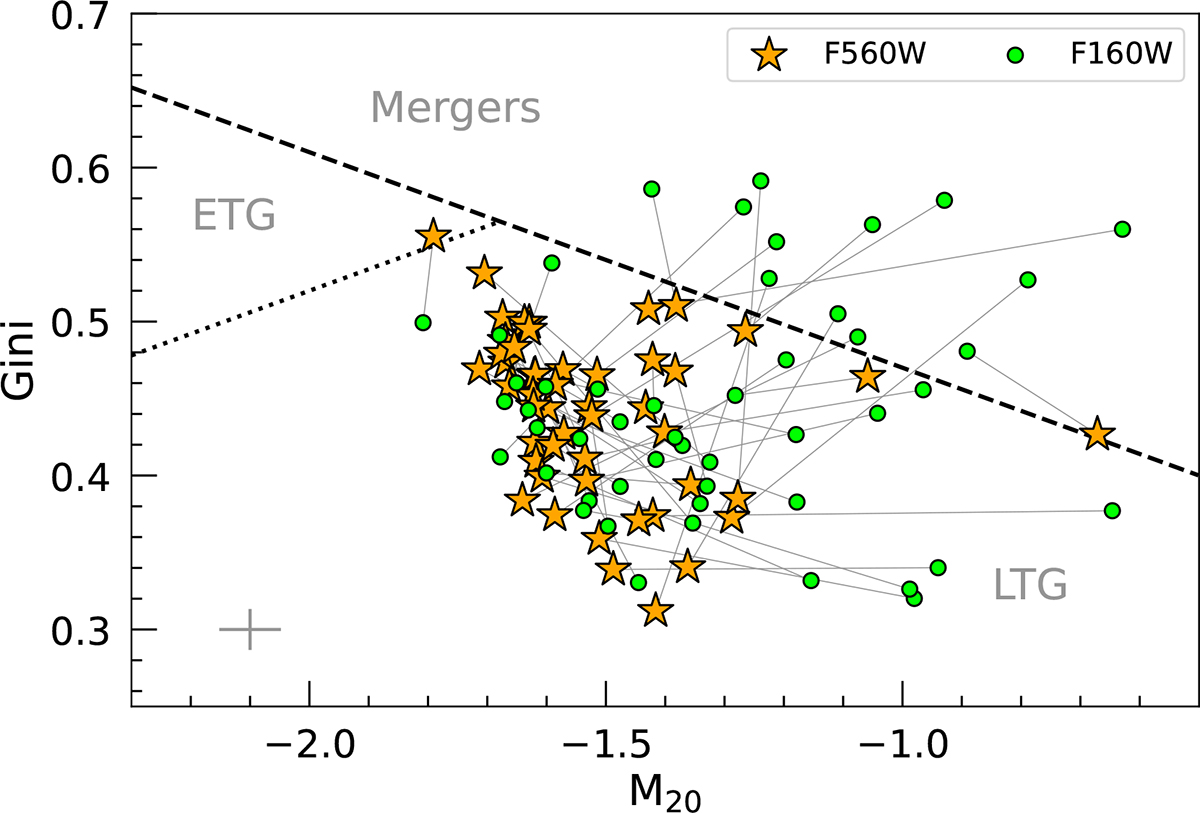
Fig. 2.
Download original image
Gini-M20 diagram. The orange stars and green dots correspond to the nonparametric morphology measured on MIRI F560W and WFC3 F160W images, respectively. For each galaxy, gray lines link the observed morphology at different wavelengths. The ETGs, LTGs, and mergers are separated according to Eqs. (4) in Lotz et al. (2008).
Current usage metrics show cumulative count of Article Views (full-text article views including HTML views, PDF and ePub downloads, according to the available data) and Abstracts Views on Vision4Press platform.
Data correspond to usage on the plateform after 2015. The current usage metrics is available 48-96 hours after online publication and is updated daily on week days.
Initial download of the metrics may take a while.