| Issue |
A&A
Volume 640, August 2020
|
|
|---|---|---|
| Article Number | A137 | |
| Number of page(s) | 27 | |
| Section | Extragalactic astronomy | |
| DOI | https://doi.org/10.1051/0004-6361/202038043 | |
| Published online | 01 September 2020 | |
The Fornax Deep Survey with VST
X. The assembly history of the bright galaxies and intra-group light in the Fornax A subgroup
1
INAF-Astronomical observatory of Capodimonte, Via Moiariello 16, Naples 80131, Italy
e-mail: This email address is being protected from spambots. You need JavaScript enabled to view it.
2
University of Naples “Federico II”, C.U, Monte Santangelo, Via Cinthia, 80126 Naples, Italy
3
European Southern Observatory, Karl-Schwarzschild-Strasse 2, 85748 Garching bei Munchen, Germany
4
School of Physics and Astronomy, Sun Yat-sen University Zhuhai Campus, 2 Daxue Road, Tangjia, Zhuhai, Guangdong 519082, PR China
5
Kapteyn Astronomical Institute, University of Groningen, PO Box 72, 9700 AV Groningen, The Netherlands
6
Division of Astronomy, Department of Physics, University of Oulu, Oulu, Finland
7
Instituto de Astrofìsica de Canarias, C Via Lactea s/n, 38200 La Laguna, Canary Islands, Spain
8
Departamento de Astrofìsica, Universidad de La Laguna, 38200 La Laguna, Tenerife, Spain
9
Department of Astrophysics, University of Vienna, Türkenschanzstrasse, 17, 1180 Vienna, Austria
10
INAF-Astronomical Abruzzo Observatory, Via Maggini, 64100 Teramo, Italy
11
INAF – Osservatorio Astronomico di Cagliari, Via della Scienza 5, 09047 Selargius, (CA), Italy
12
European Southern Observatory, Alonso de Cordova 3107, Vitacura, Santiago, Chile
13
INFN – Sezione di Napoli, Napoli 80126, Italy
Received:
27
March
2020
Accepted:
18
June
2020
Abstract
Context. We present the study of the south-west group in the Fornax cluster centred on the brightest group galaxy (BGG) Fornax A, which was observed as part of the Fornax Deep Survey (FDS). This includes the analysis of the bright group members (mB < 16 mag) and the intra-group light (IGL).
Aims. The main objective of this work is to investigate the assembly history of the Fornax A group and to compare its physical quantities as a function of the environment to that of the Fornax cluster core.
Methods. For all galaxies, we extracted the azimuthally averaged surface brightness profiles in three optical bands (g, r, i) by modelling the galaxy’s isophotes. We derived their colour (g − i) profiles, total magnitude, effective radius in all respective bands, stellar mass, and the break radius in the r-band. The long integration time and large covered area of the FDS allowed us to also estimate the amount of IGL.
Results. The majority of galaxies in the Fornax A group are late-type galaxies (LTGs), spanning a range of stellar mass of 8 < log(M* M⊙) < 10.5. Six out of nine LTGs show a Type III (up-bending) break in their light profiles, which is either suggestive of strangulation halting star formation in their outskirts or their H I-richness causing enhanced star formation in their outer-discs. Overall, we do not find any correlations between their physical properties and their group-centric distance. The estimated luminosity of the IGL is 6 ± 2 × 10¹⁰ L⊙ in the g-band, which corresponds to about 16% of the total light in the group.
Conclusions. The Fornax A group appears to be in an early-stage of assembly with respect to the cluster core. The environment of the Fornax A group is not as dense as that of the cluster core, with all galaxies except the BGG showing similar morphology, comparable colours and stellar masses, and Type III disc-breaks, without any clear trend in these properties with group-centric distances. The low amount of IGL is also consistent with this picture, since there were no significant gravitational interactions between galaxies that modified the galaxies’ structure and contributed to the build-up of the IGL. The main contribution to the IGL is from the minor merging in the outskirts of the BGG NGC 1316 and, probably, the disrupted dwarf galaxies close to the group centre.
Key words: surveys / galaxies: groups: individual: Fornax A / galaxies: spiral / galaxies: structure / galaxies: evolution / galaxies: photometry
© ESO 2020
1. Introduction
Galaxies tend to gather in gravitationally bound systems during their evolution, which are seen as dense knots in the cosmic web filaments. In the Local Universe, it has been found that about half of the population of galaxies are found in groups and clusters (Karachentsev 2005). According to the hierarchical structure formation, these galaxy clusters are formed from the merging of smaller structures such as galaxy groups (e.g. Blumenthal et al. 1984; Sommer-Larsen 2006; Rudick et al. 2009). The terminology “galaxy group” and “galaxy cluster” depends on various factors, for example, the galaxy number density, the virial mass, X-ray luminosity, and velocity dispersion. Groups of galaxies or poor clusters have masses in the range from 1013 to 1014 M⊙ (Bower & Balogh 2004; Mamon et al. 2007), and rich clusters are more massive > 1014 M⊙ (e.g. Bahcall 1996). In addition to this, the intra-cluster medium (ICM) of rich clusters is hotter (X-ray temperature = 2–14 keV) than that of poor clusters and groups, and the radial velocity dispersion of galaxies in rich clusters is higher than that of groups (e.g. Bahcall 1988, 1996).
The definition of these gravitationally bound systems range from binary galaxies to superclusters, all of which are important in the studies of environmental mechanisms. Several surveys have shown variations in observed properties of galaxies in different environments, that is, from the field to the core of clusters in the Local Universe (e.g. Lewis et al. 2002; Kauffmann et al. 2004; Peng et al. 2010; Grootes et al. 2017; Barsanti et al. 2018) and also at higher redshifts, up to z ∼ 1 (e.g. Poggianti et al. 2008; Lubin et al. 2009; Cucciati et al. 2010, 2017; Cooper et al. 2012; Muzzin et al. 2012; Paulino-Afonso et al. 2018; Guglielmo et al. 2019). Such transitions in galaxy properties typically occur around cluster or group scales of ∼2 − 3 virial radii (Gómez et al. 2003). One such observed property is the decrease in the star formation rate in galaxies of a given morphological type in groups and clusters that is visible out to 2r200 (Lewis et al. 2002). The mechanisms causing such changes are proposed to depend on the local density of the environment and, hence, they are different in groups and clusters.
The physical processes which are prominent in dense environments of clusters are ram-pressure stripping (Gunn & Gott 1972) and harassment (Moore et al. 1996). Ram-pressure stripping is not prevalent in poor clusters and galaxy groups as it depends on the velocity of the galaxy and the hot ICM. Mergers and strangulation are more common in groups of galaxies (e.g. Barnes 1985; Zabludoff & Mulchaey 1998). Major mergers can significantly alter the morphology of spiral galaxies by destroying their discs and therefore producing a major remnant that resembles an elliptical galaxy (Dekel et al. 2005). Sometimes, the disc can survive gas-rich mergers albeit resulting in the build-up of a galactic bulge (e.g. Stewart et al. 2009; Hopkins et al. 2010). On the other hand, disc strangulation is a result of the tidal forces in the group and cluster that suppresses the infall of gas onto the discs of galaxies which in turn reduces star formation (Larson et al. 1980). The aforementioned processes that occur in groups of galaxies are most effective when the velocity dispersion of the group is similar to the internal velocity (rotation or dispersion) of its galaxy members (Barnes 1985; Zabludoff & Mulchaey 1998).
During the infall of galaxy groups which then form a cluster, the stripped material of galaxies settles to constitute the intra-group light (IGL) or the intra-cluster light (ICL; Napolitano et al. 2003; Fujita 2004; Contini et al. 2014). Therefore, the ICL and IGL are fossil records of past interactions and mergers as their growth and evolution over time provide a link to the assembly state of the cluster and group (Mihos 2015, and references therein).
Overall, high density environments provide a plethora of information for galaxy formation and evolution. There have been several studies on the effect of the environment on galaxy structures and properties in the Local Universe (e.g. Dressler 1980; Pastoriza et al. 1994; de Mello et al. 2002; Lewis et al. 2002; Gómez et al. 2003; Bower & Balogh 2004; Boselli et al. 2006; Mamon et al. 2007; Huertas-Company et al. 2013; Tully et al. 2014; Deeley et al. 2017; Finn et al. 2018, and references therein) and at higher redshifts, up to z ∼ 1 (e.g. Cooper et al. 2006; van der Wel et al. 2007; Tasca et al. 2009; Nantais et al. 2013; Kelkar et al. 2015; Allen et al. 2016; Krywult et al. 2017; Paulino-Afonso et al. 2019, and references therein). With the advent of deep photometry (e.g. Zibetti et al. 2005), exploring faint regions of galaxy outskirts, ICL and IGL have gained importance over the last years (e.g. Rudick et al. 2009; Mihos et al. 2017; Iodice et al. 2016, 2017a,b; Spavone et al. 2017, 2018, and references therein).
As such, the Fornax cluster has been an environment of interest. It is the second most massive galaxy concentration within 20 Mpc, after the Virgo cluster, with a virial mass of Mvir = 7 × 10¹³ M⊙ (Drinkwater et al. 2001a). The Fornax cluster has been extensively studied by several surveys in multiple wavelengths (e.g. Martin & GALEX 2005; Scharf et al. 2005; Jordán et al. 2007; Davies et al. 2013; Muñoz et al. 2015; Su et al. 2017; Eigenthaler et al. 2018; Zabel et al. 2019; Serra et al. 2019).
The Fornax Deep Survey (FDS) with the VLT Survey Telescope (VST, Venhola et al. 2017; Iodice et al. 2019a) is one of the deepest and widest data sets mapping the Fornax cluster out to the virial radius (∼0.7 Mpc). With FDS we (i) mapped the surface brightness around the brightest cluster members NGC 1399 and NGC 1316 out to an unprecedented distance of about ∼200 kpc (R ∼ 6Re) and down to μg ≃ 29 − 31 mag arcsec−2 (Iodice et al. 2016, 2017b); (ii) traced the spatial distribution of candidate globular clusters (GCs) inside ∼0.5 deg2 of the cluster core (D’Abrusco et al. 2016; Cantiello et al. 2018; iii) studied the galaxy outskirts, detected the ICL and faint (μg ≃ 28 − 30 mag arcsec−2) features in the intra-cluster region in the core of the cluster (Iodice et al. 2016, 2017a, 2019a; Raj et al. 2019) and in the outskirts of NGC 1316 (Iodice et al. 2017b; iv) provided the largest size and magnitude limited catalogue of dwarf galaxies in the cluster (Venhola et al. 2017, 2018, 2019). The analysis of the deep images from FDS suggests that the Fornax cluster is not completely relaxed inside the virial radius. The bulk of the gravitational interactions between galaxies takes place in the west-northwest core region, where most of the bright early-type galaxies (ETGs) are located and where the intra-cluster baryons (i.e. diffuse light, GCs, and PNe) are found (Pota et al. 2018; Spiniello et al. 2018; Iodice et al. 2019a).
This paper focuses on the south-west (SW) Fornax A group using the FDS data to study the bright group members (mB < 16 mag) and their physical properties as a function of the environment and, thus, compare them with those observed for late-type galaxies (LTGs) in the Fornax cluster. Maddox et al. (2019) presented a spectroscopic census of all the galaxies in the Fornax environment, covered by FDS which also includes background objects. We use this data to study and compare the kinematics of the assembly history of the bright galaxies in the Fornax A subgroup to those of the core.
The outline of this paper is as follows. In Sect. 2, we give a brief summary of FDS. In Sect. 3, we describe our methods of analysis along with the estimated parameters. In Sect. 4, we explain the results based on the surface photometry analysis. In Sect. 5, we address the assembly history of the bright galaxies in Fornax A. In Sect. 6, we discuss the formation history of the IGL in the Fornax A group. In Sect. 7, we compare the environments of the Fornax cluster core and Fornax subgroup. In Sect. 8, we summarise our results. A brief description of each of the galaxies presented in this work is given in Appendix A and their corresponding images (g-band), surface brightness profiles, (g − i) colour maps and colour profiles are shown in Appendix B. Methodologies of some of this work are presented in Appendix C.
2. The Fornax Deep Survey
The Fornax Deep Survey is a multi-band (u, g, r, i) survey, and a part of the Guaranteed Time Observation surveys FOCUS (P.I. R. Peletier) and VEGAS (P.I. E. Iodice, Capaccioli et al. 2015). The observations were acquired with the ESO VLT Survey Telescope (VST), located at Cerro Paranal, which is a 2.6 m optical telescope (Schipani et al. 2012) equipped with the wide field camera OmegaCam (Kuijken 2011), that covers 1 × 1 deg2 field of view. FDS data sample 26 deg2 of the Fornax cluster, which also includes the in-falling Fornax A subgroup (Iodice et al. 2017b). Detailed explanations of the observing strategy and reduction are given by Iodice et al. (2016, 2017a) and Venhola et al. (2018). The FWHM (arcsec) and depth (mag arsec−2) of the FDS fields in each filter (g, r, i), used in this work, are given in Table 1 (see also Venhola et al. 2018).
Image quality of FDS fields used in this work.
Catalogues and data products provided by FDS were presented by Venhola et al. (2018) on dwarf galaxies in the Fornax cluster, Iodice et al. (2019a) on photometry of ETGs, and Raj et al. (2019) on LTGs in the central 9 deg2. The g-band mosaic covering 3.6 ×2 deg2 around NGC 1316 and the SW side of the Fornax cluster with named circles indicating the galaxies studied in this work, is shown in Fig. 1. In this image, we also mark all galaxies taken from the catalogue by Venhola et al. (2019) that are part of the Fornax A subgroup for the purpose of group-environmental analysis. The galaxies marked in Fig. 1 are grouped into giant LTGs (mB < 16 mag), dwarf elliptical (dE), and dwarf late-type (dl) galaxies. The sample of spiral galaxies (mB< 16 mag) has been selected from Ferguson (1989) and are listed in Table 2. In this study, we adopt a distance of D = 20.8 ± 0.5 Mpc for NGC 1316 (Cantiello et al. 2013).
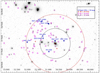 |
Fig. 1. VST mosaic in g-band of the Fornax A subgroup covering 3 × 2 deg2. The red dashed circle is an approximate measure of the virial radius of the group, which is ∼1 deg2 (Drinkwater et al. 2001a). The black dashed circle (r = 0.58 deg) is the region where the IGL is estimated. All galaxies part of the Fornax cluster and Fornax A subgroup, taken from Venhola et al. (2019) are indicated. The red cross indicates NGC 1316. Bright galaxies (mB < 16 mag) are represented with blue circles. Red diamond represents dE (mB < 16 mag), pink squares represent dE (mB > 16 mag), and purple squares represent dl (mB > 16 mag). |
LTGs brighter than mB < 16 mag in the Fornax A subgroup.
3. Analysis
In this section, we briefly describe the procedures to derive galaxy parameters. We adopt the methods presented by Iodice et al. (2019a) and Raj et al. (2019). Results for individual galaxies of the sample are given in Appendix A.
3.1. Isophote fitting
The azimuthally averaged surface brightness (SB) profiles of each source were extracted in three bands (g, r, i) using the IRAF task ELLIPSE1 (Jedrzejewski 1987). As preliminary steps to the isophote fitting, we masked all bright sources (e.g. galaxies, stars) that are close to the galaxies in the sample. In some cases, for galaxies that are close in projection to each other (NGC 1326A and NGC 1326B; NGC 1316 and NGC 1317), we adopted an iterative process by modelling the neighbouring source using the BMODEL task in IRAF. This model is created from the results of the isophotal analysis (ELLIPSE) and then subtracted from the original image. In the fitting routine, we adopted the k-sigma clipping algorithm for cleaning deviant sample points at each annulus2.
Isophotes are fitted in elliptical annuli, starting from the centre3 of the galaxy to the edge of the FDS field (∼0.5 deg). Since most of the galaxies have dust absorption and/or irregular shape close to their centre, we keep the geometrical centre fixed, while the position angle and ellipticity are free parameters. According to Iodice et al. (2016), the intensity profiles are then used to derive (i) the limiting radius (Rlim) that corresponds to the outer-most annulus, where the light of the source blends into the average background level (it is the residual after subtracting the sky frame resulting in a value close to zero); (ii) derive the residual sky background of each source from their outer annuli in three respective bands. The limiting radius and the residual background levels are locally estimated for each galaxy in the sample. The background levels are computed at R ≥ Rlim as the average counts out to the edge of the image.
3.2. Products: Total magnitude, effective radius, colours, and stellar mass
For each galaxy of the sample, we derived the “total magnitude”, “effective radius” Re, average “g − i” and “g − r” colours following the method presented by Iodice et al. (2019a) and Raj et al. (2019). All parameters are given in Table 3. Firstly, the intensity profiles from the output of the isophote fit are used to derive azimuthally averaged SB profiles. The residual background level estimated at R ≥ Rlim of each band for all galaxies is subtracted. We also took into account the uncertainties on the photometric calibration and sky subtraction in estimating the errors on magnitudes (see Capaccioli et al. 2015; Iodice et al. 2016, 2019a). For all galaxies in the sample, we derived the g − i colour profiles from the SB profiles, and colour maps from the images, which are shown in Appendix B. We then derived total magnitudes and effective radii in the g, r, i bands of all galaxies in our sample using the growth curve from the isophote fits. We estimated the stellar mass M* using the empirical relation from Taylor et al. (2011) which assumes a Chabrier IMF, that is,  . Here Mi is the absolute magnitude in i-band, g − i is the average colour derived in the previous step. We then estimated the stellar mass-to-light ratio M*/Li with 1σ accuracy of 0.1 dex (see Taylor et al. 2011).
Derived parameters of LTGs in the Fornax A subgroup.
3.3. Estimation of the IGL
The IGL is estimated from the mosaic in the g and r bands as their surface brightness limit is fainter than that of the i-band (see Table 1). The brightest stars and galaxies surrounding NGC 1316 are modelled using the IRAF tasks ELLIPSE and BMODEL as explained in Sect. 3.1, and then subtracted from the image. The resultant residual image is used to derive the radial profiles and thus 2D model of NGC 1316, which is also subtracted from the image. The final residual image is used to estimate the IGL using the IRAF task PHOT, which computes the integrated flux inside a specified aperture. The uncertainties on the estimate of the IGL take into account (1) the error on the background estimate (≃10% in g, ≃50% in r); )2) the poissonian error on the flux (≃26% in g and r) and (3) the error on the photometric calibration (≃0.1% in g and r).
According to Iodice et al. (2016), the stellar envelope of NGC 1316 starts to dominate at R > Rtr = 5.5′, where Rtr is the transition radius4. Taking this into account, we masked this region of NGC 1316. The IGL is estimated in a region ∼33.5 arcmin2 surrounding NGC 1316, which covers nearly 60% of the group including the bright galaxies. In Appendix C, we show the final g-band image used in estimating the IGL of the Fornax A subgroup. In this image, we also mark the loops that are part of the stellar envelope (see also Iodice et al. 2017b). Through our deep photometry of this group, we also find a new patch of diffuse light in the SW part of NGC 1316, which also contributes to the IGL (see Appendix C).
The total magnitude5 of the IGL in the Fornax A group, within an area of ∼33.5 arcmin2 around NGC 1316, is mg = 10.1 ± 0.3 mag and mr = 9.2 ± 0.3 mag in the g and r bands, respectively. Therefore, the total luminosity is 6 ± 2 × 10¹⁰ L⊙ in the g band and 7 ± 2 × 10¹⁰ L⊙ in the r band. As pointed out earlier, the IGL estimate includes the stellar envelope of NGC 1316. The fraction of the IGL luminosity to the (i) luminosity of the brightest group galaxy (BGG) NGC 1316 is LIGL, g/LBGG, g ∼ 19%; (ii) total luminosity of all group members (including dwarf galaxies) inside the virial radius is LIGL, g/Lgroup, g ∼ 16 ± 4%. The total luminosity of NGC 1316 (LBGG, g = 3.11 × 10¹¹ L⊙) is given by Iodice et al. (2017b). The total luminosity for dwarf galaxies (9 × 10⁸ L⊙ in g-band) is provided by Venhola et al. (2019). The total luminosity for all bright LTGs in the sample studied in this work are derived from magnitudes listed in Table 3.
The contribution to the IGL (in g-band) of the luminous loops in the stellar envelope of NGC 1316 (loops L1, L2, L9, SW loop L5) is 22%. According to Iodice et al. (2017b), the total luminosity from these loops is 1.3 × 10¹⁰ L⊙ in the g-band. We stress that the IGL estimation is a lower limit as it is not possible to estimate the diffuse component which is in the line-of-sight of masked objects.
3.4. Products: Break radius, disc scale-length, and disc colour
We used the algorithm developed by Raj et al. (2019) to derive the break radius Br, inner and outer scale-lengths (hin and hout)6 from the deconvolved SB profiles in r-band. The (g − i) colours of the scale-lengths (hin and hout) are also derived from deconvolved SB profiles. The deconvolution method is briefly described in the following.
In the process of detecting disc-breaks, we made sure to account for the effect of the point spread function (PSF). This is to avoid false detection of disc-breaks as a result of the scattered light from a galaxy’s bright core in the regions around them. We first measured the PSF out to the galaxy’s disc and then the PSF is characterised from the VST images so that the broadening effect of the seeing on the galaxies is taken into account (Capaccioli et al. 2015). Raj et al. (2019) show how the effect of the PSF can affect the SB profiles of galaxies of various sizes (see also Capaccioli et al. 2015). We then deconvolved galaxies with the PSF, using the Lucy-Richardson algorithm (Lucy 1974; Richardson 1972). We briefly explain the main steps of the algorithm used to derive the break radius.
-
The disc regions are determined from the 1D multi-component (bulge and disc) fits explained in Appendix C (the multi-component best fits are shown in Fig. C.2 and their corresponding best fit parameters are listed in Table C.1). The starting point is the intersection between the bulge and disc components. The regions are provided to the algorithm to define inner disc limit rangein and outer disc limit rangeout, within Rlim (see Table C.2).
-
The algorithm produces (n + 1)2 best linear fits by varying rangein and rangeout, and (n + 1)3 estimates of the break radius, where n = 2 in both cases.
-
The median of the (n + 1)3 intersecting points is chosen as the final break radius Br, and the standard deviation of the (n + 1)3 estimates is given as sigma σnBr on the estimation of the break radius.
-
Through iterations7 of the previous steps, a minimal standard deviation of the (n + 1)3 break radii is obtained which in turn provides the best selection of the disc scale-lengths hin and hout.
-
The average (g − i) colours of the inner and outer discs are derived for the regions hin and hout.
The break radius (in arcsec and kpc) of six galaxies along with σnBr, surface brightness at the break μBr, and average (g − i) colour for the components hin and hout are listed in Table 4. Fitting results are shown in Fig. 2.
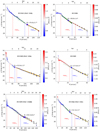 |
Fig. 2. Surface brightness profiles of galaxies with Type III disc break, with (g − i) colour as a third parameter. In each plot, the break radius (Br) is marked at the intersecting point of the linear fits performed between hin and hout, with σnBr as the median of (n + 1)3 combinations of best fits on the inner and outer scale-lengths. The vertical dashed lines (maxhin and maxhout) indicate the regions for maxrangein = rangein ± n and maxrangeout = rangeout ± n where the algorithm produces (n + 1)2 linear least square fits. The shaded regions on hin and hout indicate the median of the rms of the residuals for (n + 1)2 linear least square fits. |
Parameters of LTGs with a disc break.
4. Results
4.1. Morphology and colour analysis of galaxies in the Fornax A subgroup
In this section, we analyse the morphology, structure, colours, and stellar mass. as a function of group-centric distance, that is from BGG NGC 1316. This choice is motivated by making a direct comparison with the segregation of the galaxies’ properties found in the cluster core (Iodice et al. 2019a; Raj et al. 2019), as discussed in Sect. 7.
The Fornax A subgroup is populated with bright (< 16 mag) LTGs and only one giant peculiar ETG, that is, NGC 1316 as its central galaxy. Most of the bright galaxies (> 75%) in the sample are located in the north-east (NE) side of the Fornax A group. In Fig. 3 (left panel), we plot the morphological stage parameter T as a function of projected distances from the group centre. This shows that the sample of LTGs is heterogeneous, similar to that of the LTGs in the Fornax cluster core (see right panel of Fig. 3 and Raj et al. 2019). Overall, we do not find any morphological segregation of galaxies in the group.
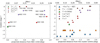 |
Fig. 3. Hubble type T as a function of group-centric (left panel) and cluster-centric distance (right panel) for bright galaxies in the Fornax A subgroup (left panel) and Fornax cluster core (right panel). Data for the cluster core galaxies are taken from Iodice et al. (2019a) for ETGs and Raj et al. (2019) for LTGs. |
All LTGs in the Fornax A group have stellar masses in the range 8 < log (M*)[ M⊙] < 10.5, uniformly distributed inside the group (see top-left panel of Fig. 4). As expected, from the colour-magnitude relation, the fainter galaxies (Mi ≤ −18 mag) in the group have bluer colours, g − i ≤ 0.5 mag (see lower left panel of Fig. 4).
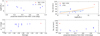 |
Fig. 4. Left panels: stellar mass as function of projected distance from NGC 1316 (top panel) and colour-magnitude relation (lower panel) for bright spiral galaxies inside the virial radius of the Fornax A sub group. Right panels: size-mass relation (top panel) and effective radius as a function of projected distance from NGC 1316 (lower panel) for all the bright spiral galaxies in the Fornax A subgroup. A least square fit to the data is shown in orange (including NGC 1316) and blue (excluding NGC 1316). |
ETGs and LTGs follow a different size-mass relation (see Shen et al. 2003) and this is likely the reason for the difference in the size-mass relation driven by the massive galaxy NGC 1316 and a less-pronounced relation observed for the bright spiral galaxies in the Fornax A subgroup (Fig. 4: top right panel). We do not find any correlation of effective radius as a function of the projected distance from NGC 1316 (Fig. 4: lower right panel). The effective radii of all bright spiral galaxies in the Fornax A subgroup are Re≤ 70 arcsec (∼7.07 kpc).
As found for the other properties derived for the LTGs in Fornax A group (i.e. morphology and stellar mass), the colour distribution also appears to be quite uniform inside the group, without any evident colour segregation with the group-centric distance (see Fig. 5). A slight, but not significant trend (Pearson’s correlation coefficient and the correlation significance are −0.41 and 0.26) might be observed in (g − r) colours as a function of projected distance, whereas, on average, most (∼90%) of the LTGs in the Fornax A subgroup have colours in the range 0.7 ≤ g − i ≤ 1 mag. The very blue outlier FCC035 (g − i = 0.17 ± 0.1 mag) has a nuclear star cluster in its central region and this contributes to its blue (g − i) colour.
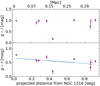 |
Fig. 5. g − i (top panel) and g − r (lower panel) colours as a function of projected distance from NGC 1316 in degrees and Mpc. A least square fit to the g − r data is shown. Slope of the fit is 0.23 ± 0.15. |
4.2. Analysis of the discs
Similar to our analysis in Raj et al. (2019) for the galaxies in the virial radius of the Fornax cluster, we study the discs of the galaxies in the group as well. Our results of the disc-breaks show that six galaxies have Type III (up-bending) profiles. Even considering that this is a small sample, we examine the main correlations of the disc-breaks with other galaxy properties (e.g. stellar mass, total magnitude) inside the Fornax A group. Results are also compared with those derived for the LTGs in the Fornax cluster core by Raj et al. (2019).
We do not find any disc-break trends with regard to the stellar mass (see top left panel of Fig. 6). The same can be said for (i) total magnitude as a function of break radius normalised to the effective radius in r (top right panel); (ii) absolute magnitude as a function of inner-scale length, hin (lower left panel in Fig. 6). A less-pronounced relation between the outer scale-lengths and absolute magnitude is observed for the LTGs in the Fornax A subgroup (lower right panel in Fig. 6). Galaxies in the Fornax A group have disc-breaks located at different scale lengths, irrespective of their effective radius and total magnitude, unlike the galaxies in the cluster core (Raj et al. 2019) where there were observed trends such as, increasing stellar mass with Br (see also cluster core LTGs in Fig. 6). For all six galaxies in the Fornax A group, the break radius is located beyond 1Re.
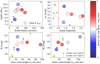 |
Fig. 6. Analysis of galaxies with a break in their surface brightness profiles. Circles represent Type III, with average (g − i) colour of hout − hin as colour map. Orange triangles and green circles represent Type II and Type III galaxies in the Fornax cluster core (data taken from Raj et al. 2019). Top panel left: stellar mass as a function of break radius. Top panel right: total magnitude as a function of break radius normalised to effective radius. The red dashed line indicates 80% of the Fornax cluster core galaxies with disc-breaks. Bottom panels: absolute magnitude in i-band as a function of inner scale-length hin (left) and outer scale-length hout (right). |
Except for NGC 1326 (g − ihout − hin = −0.24 mag) and FCC 035 (g − ihout − hin = −0.36 mag), the other four galaxies show redder outer discs. FCC 035 is a very late-type galaxy (T = 9) and is the faintest galaxy with minor disturbances in its outskirts (see Fig. B.6). NGC 1326 (T = 1) is the brightest in the LTG sample (see Fig. B.4) with a double bar (Erwin et al. 2005).
5. Assembly history of the bright LTGs in the Fornax A subgroup
In this section, we combine the main results for the brightest galaxies in the Fornax A group (morphology and disc structure) in the two-dimensional projected phase-space (PPS) to trace its assembly history. Recently, studies concerning the location of galaxies in phase-space have gained importance (e.g. Mahajan et al. 2011; Hernández-Fernández et al. 2014; Muzzin et al. 2014; Rhee et al. 2017). These studies show the connection between a galaxy’s phase-space location and its effect on star formation and stellar mass. This helps to further understand the effect of the environment on the evolution of galaxies, following on the morphology-density relation (Dressler 1980).
We used the published catalogue of spectroscopic redshifts by Maddox et al. (2019) to plot the phase-space diagram for 15 galaxies part of the Fornax A subgroup, including dwarfs. This is shown in Fig. 7. Maddox et al. (2019) use a sample of 40 galaxies within a radius of 0.7 Mpc and find the central velocity of the Fornax A subgroup to be 1778 km s−1 with a velocity dispersion of 204 km s−1, and estimate the dynamical mass of the Fornax A subgroup to be 1.6 ×10¹³ M⊙. According to Maddox et al. (2019), we adopted 1.05 deg (∼0.38 Mpc) as the virial radius of the Fornax A subgroup.
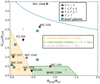 |
Fig. 7. Projected phase-space diagram of galaxies in the Fornax A subgroup within a group-centric distance of 1.05 deg ∼ 0.38 Mpc. The blue trajectory corresponds to the escape velocity of the group. Regions E (orange), D (green), B (pink) represent ancient, intermediate, and recent infallers as defined by Rhee et al. (2017). The bright spiral galaxies are indicated with coloured circles based on their morphological type T (red, purple, brown), NGC 1316 is indicated with a green triangle (T = −1) and dwarf galaxies are indicated with blue squares. |
In Fig. 7, we plot the velocities (normalised to the group velocity dispersion) as a function of the projected distance (normalised to the virial radius). Along with this, we also plot the trajectory curve for the escape velocity8 (vesc). According to Rhee et al. (2017), in the PPS we have also included the regions populated by the galaxies that merged into the cluster potential at different infalling times. They are the “ancient infallers” (t < 8 Gyr), “intermediate infallers” (t < 4 − 7 Gyr), and “recent infallers” (t < 1 Gyr). Rhee et al. (2017) explain the origin of these regions by comparing them to the trajectory such that galaxies falling for the first time are close to the escape velocity curve, and as they pass through the pericentre, they start gaining velocity. Over time, after passing through the apocentre and many more pericentres, they eventually end up in the region of ancient infallers.
The PPS for the Fornax A group shows that the majority of the group members are located in the region of the recent and intermediate infallers. This would suggest that most galaxies are still assembling into the Fornax A group. The ancient infallers are the central and massive galaxy NGC 1316 and the close (in projection) barred spiral galaxy NGC 1317 (see also Fig. B.2). Most of the bright spiral galaxies in the Fornax A group (NGC 1310, NGC 1326A, FCC 035, and NGC 1341) seem to be intermediate infallers. Except for FCC035, galaxies in this region have average colour 0.9 < g − i < 1 mag. Although the Fornax A group is not as dense as the Fornax cluster, the group potential should somehow impact the outskirts of the discs. This is what we mainly observe for NGC 1316C, FCC 028, NGC 1326 and NGC 1326B (see Figs. B.3, B.5, B.7 and B.8) that belong to the region of recent infallers. NGC 1326, the most massive LTG in the sample, also shows plenty of star-forming regions.
Six of the galaxies in the region of intermediate and recent infallers also show a Type III disc-break. We explain the possible mechanisms for the formation of this break in Sect. 7. Finally, according to the PPS, the interacting system NGC 1326A and NGC 1326B may not be interacting, and that NGC 1326B is experiencing a fair amount of tidal interaction through its first infall, which would explain the star-forming regions in its outer-disc.
6. The build-up of the IGL in the Fornax A subgroup
In this section, we summarise relevant results from this work and those from previous works on the Fornax A group, which help to understand the formation history of its IGL. We then discuss how predictions from models fit in well with our results from observations.
The IGL in the Fornax A group is estimated within a region ∼35 arcmin2 (∼0.5 deg), which covers most of the group extension (see Sect. 3.3). Inside this radius, Venhola et al. (2019) find a significant drop in the number of dwarf galaxies (∼50%). This might be an indication that the IGL in the Fornax A group was assembled by past merger of NGC 1316 (see Iodice et al. 2017b; Serra et al. 2019) and disruption of satellite galaxies on infall, which also contributed to the build-up of the extended stellar envelope around NGC 1316. This hypothesis is further supported by comparing the IGL fraction in the Fornax A subgroup with theoretical predictions from Contini et al. (2014) (see Fig. 8). According to Contini et al. (2014), galaxies which get destroyed while falling into the cluster or group make the accreted component of the ICL or IGL. Since the IGL in the Fornax A subgroup fits well in both regions from tidal disruption and merger channels, this suggests that at the present epoch, both mechanisms contributed to the build-up of this component.
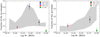 |
Fig. 8. Fraction of IGL by mergers (left panel) and fraction of IGL accreted (right panel), as a function of the BGG stellar mass for four groups: NGC 1316, NGC 5018 (Spavone et al. 2018), NGC 1533 (Cattapan et al. 2019), IC 1459 (Iodice et al. 2020). The shaded areas represent the 20th and 80th percentile of the “model disruption” described by Contini et al. (2014). |
In Fig. 8 we also compare the IGL derived for the Fornax A group with values obtained for other groups of galaxies, from observations of comparable depth and with the same image analysis. In particular, we plot the fraction of IGL to the total luminosity of the bright member galaxies as a function of the BGG stellar mass (in the range 1011–1012 M⊙) for four groups: Fornax A (NGC 1316), NGC 5018 (Spavone et al. 2018), NGC 1533 (Cattapan et al. 2019), and IC 1459 (Iodice et al. 2020). Compared with theoretical predictions, the IGL fraction in each group reflects their assembly history. The main contribution to the IGL in the NGC 5018 group comes from the extended tidal tail that is tracing an ongoing merger (Spavone et al. 2018). In the Fornax A group, as well as in the NGC 1533 triplet (Cattapan et al. 2019), that have a comparable IGL fraction, mergers would have partly contributed to the IGL, and signs of past mergers are confined in the BGG’s envelope (in the form of loops and shells). As pointed out by Iodice et al. (2020), given the low IGL fraction (∼2%) and the structure and properties of galaxy members, the IC 1459 group is still in an early mass assembly phase.
The connection between the IGL fraction and evolution is also consistent with the different ratios of ETG-to-LTG galaxies. In the Fornax A group, ETG/LTG = 0.11, since it has only one peculiar ETG (NGC 1316) and nine bright LTGs. NGC 5018 and NGC 1533 groups have ETG/LTG = 1.6, while IC 1549 ETGs/LTGs = 0.3. Although the Fornax A subgroup has the lowest ratio among the groups discussed above, a major fraction of the IGL with respect to the IC 1459 group, which has comparable ETG-to-LTG ratio, comes from the past merger of NGC 1316 and disrupted dwarf galaxies. In the IC 1459, no signs of interactions are found with a galaxy of comparable mass (Iodice et al. 2020).
7. The tale of the Fornax environment: The cluster core versus the infalling group
It is known that galaxies are redder and brighter in dense environments than in low-density environments (Faber 1973; Oemler 1974; Visvanathan & Sandage 1977; Butcher & Oemler 1984). The Fornax environment, comprising the cluster core and the Fornax A group, can depict “pre-processing” of galaxies, in particular, how LTGs evolve to the observed ETGs in the cluster core. From literature, the proposed physical processes that galaxies undergo in groups and subclusters are strangulation and merging. In this section, we compare the properties of the group to that of the cluster core thus showing the different evolutionary stages for these environments.
Galaxy populations: The Fornax cluster core has 18 bright (mB < 15 mag) ETGs (Iodice et al. 2019a) and 13 bright (mB < 16.6 mag) LTGs (Raj et al. 2019). The total number of dwarf galaxies in the cluster is 564 (Venhola et al. 2018, 2019). However, the Fornax A group has nine bright (mB < 16 mag) LTGs and one peculiar ETG, that is the central galaxy NGC 1316. The total number of dwarf galaxies is ∼60 within Rvir = 1.0 deg (Venhola et al. 2019). Overall, the number of galaxies in the Fornax cluster core is nearly ten times more than that of the Fornax A group.
Morphological segregation: Nearly 70% of the ETGs (T ≤ −2) are located within 0.8 deg of the cluster core (see Fig. 3). This region, where the bulk of the X-ray emission is also found, correspond to the high-density region of the cluster (Iodice et al. 2019a). Beyond this region, that is Dcore > 1 deg, 60% of the LTGs are located (see Raj et al. 2019). These results are consistent with the morphology-density relation (Dressler 1980). We do not observe the same for the galaxies in the Fornax A group (see Fig. 3). This suggests that the environment is not as dense as the Fornax cluster core, where the late-type star-forming galaxies are slowly transforming into passively evolved cluster members (e.g. Oemler 1974). The absence of ETGs in the Fornax A group and the morphological segregation confirm that the group is at a different stage of evolution.
Colour segregation: For galaxies in the cluster core, a strong colour segregation as a function of the cluster-centric radius is observed, where the redder and massive ETGs populate the high-density region of the cluster (Iodice et al. 2019a). Most of the blue LTGs are found in the low-density region of the cluster. The Fornax A group, dominated by LTGs, does not show any colour segregation (see Fig. 5). The LTGs are about the same in (g − i) colours as the LTGs in Fornax core (see left panel of Fig. 9). Figure 9 (right panel) also shows that there are LTGs with lower stellar mass in the Fornax core (7 < log(M*)[M⊙] < 8). Hence the overall stellar mass range of LTGs, both in the core and the group is 7 < log(M*)[M⊙] < 11.
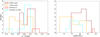 |
Fig. 9. Histogram of the colour (g − i) distribution (left panel) and of the stellar mass (right panel) for the bright galaxies in the Fornax core and Fornax A subgroup. |
Structure of LTGs: The LTGs in the cluster core exhibit very different substructures that are well-correlated with their locations in the cluster core (see Raj et al. 2019). As for the LTGs in Fornax A group, their substructures are almost similar showing regular star-forming regions in their spiral arms. Although we find that Hubble type T is heterogeneous in both samples, LTGs in the core show more irregularities in their structures (e.g. lopsidedness, tidal tails, boxy discs) in comparison to those in Fornax A group, where almost none show any such irregularities (except for NGC 1327B). This suggests that the environment of the cluster core has played a major role in the structure-transformation of LTGs, while galaxies in the Fornax A subgroup are undergoing minor changes or have not undergone any changes yet.
Disc-breaks of LTGs: We find that many of the galaxies in the Fornax core have undergone pre-processing, star formation quenching in their outskirts during their time in the cluster (Zabel et al. 2019; Raj et al. 2019; Iodice et al. 2019b). This is also clearly seen through their disc-breaks, that is, the break radius of most (80%) of these galaxies is located within 1Re. Beyond this radius, there are no substructures (e.g. spiral arms) or star-forming regions. However, most of the disc-breaks seen in the group are of Type III, in contrast to those in the cluster core. Moreover, the break radius of galaxies in the Fornax A subgroup is located beyond 1Re. This suggests that the environmental processes in the group have not severely altered the structures of the galaxies therein.
Mergers and strangulation are common phenomena in the group environment (Barnes 1985; Zabludoff & Mulchaey 1998; Hashimoto & Oemler 2000), but this assumption is not enough to understand the origin of Type III disc-breaks alone. While they have been many explanations for their occurrence (e.g. Bakos et al. 2008; Younger et al. 2007; Laine et al. 2016; Watkins et al. 2019), we state a few which depend on the H I content, such that if the gas is not replenished, star formation is eventually halted. It is also important to consider internal mechanisms such as the formation of bars, which can also form a Type III disc-break (e.g. Erwin et al. 2005; Pohlen & Trujillo 2006). Wang et al. (2018) showed that Type III disc-breaks were prevalent in H I-rich galaxies with low-spin. The in-situ star formation from gas accretion builds the outer-disc of these Type III galaxies. Alternatively, enhanced star formation in the inner-discs of galaxies can cause steeper inner-discs than outer discs (Hunter & Elmegreen 2006). Gas in outer-discs are vulnerable to the tidal forces in a dense environment. In this case, the gas that falls inwards can cause star-bursts in the inner central regions (e.g. Barnes & Hernquist 1991, 1996; Hopkins et al. 2013, and references therein). If LTGs in the Fornax A group are undergoing strangulation, their outer-discs would not have cold gas to fuel star formation. H I data are required to confirm if Type III disc-breaks in LTGs part of the Fornax A group, have formed as a consequence of H I-richness or the contrary.
X-ray emission: The main contributions to the X-ray emission in Fornax A group are provided by the centre of the BGG, NGC 1316, and by two of the most luminous stellar loops in the outskirts (L1 in the south and L2 on the east of the galaxy, Mackie & Fabbiano 1998). In addition, there is an elongated region of X-ray emission to the NW of NGC 1316, corresponding to the region of the plume (Iodice et al. 2017b). The total luminosity of the X-ray emission is 3.1 × 1040 erg s−1 (Kim & Fabbiano 2003) is an order of magnitude fainter than the total X-ray luminosity in the Fornax core which is 5 × 1041 erg s−1 (Jones et al. 1997). Moreover, the X-ray emission in the core of the cluster, which peaks on the BCG NGC 1399 is much more extended, reaching ∼0.4Rvir ∼ 0.3 Mpc. Most of the brightest and massive galaxies in the core are located inside the X-ray emission and all of them are ETGs (Iodice et al. 2019a). Therefore, most of the processes linked to the galaxy harassment that happened in this region of the cluster, and that shaped most of the observed galaxy properties, cannot be taken into account in the Fornax A group. This is further consistent with the homogeneous population of LTGs found in this group and with the overall picture that the Fornax A group is not as evolved as the cluster core.
8. Summary and conclusions
With FDS data, we have analysed the structure of the brightest (mB < 16 mag) LTGs in Fornax A SW group of the Fornax cluster. We have also taken advantage of the depth of the data and derived the IGL amount in the Fornax A group. In the study of disc-breaks of LTGs in different environments, we have compared the break radius of LTGs in the cluster core to those of the group. Since the Fornax cluster has been studied by several surveys, we have made the best use of available public data, in this case, the spectroscopic redshift compilation by Maddox et al. (2019) to look at the group members in phase-space. Thus, for the first time, we give a complete picture of the environment of the Fornax A group, and compare it to that of the Fornax cluster core. We summarise the results of this work as follows:
-
In contrast to what is observed in the core of the Fornax cluster, in the Fornax A group, there is no observed morphological, mass and colour segregation of galaxies. LTGs in the Fornax A group have stellar masses in the range 8 < log(M*)[M⊙] < 10.5, while there are less massive LTGs in the Fornax cluster core (7 < log(M*)[M⊙] < 11).
-
We detect only Type III disc-breaks in the SB profiles of galaxies in the Fornax A group. Of them, four galaxies have outer discs redder than their inner discs, and two galaxies have bluer outer discs. On the contrary, in the Fornax core, we detected all types of disc-breaks, suggesting a variety of mechanisms and interactions with the environment (Raj et al. 2019). The formation of the breaks in the Fornax A group needs more investigation of their H I content, in order to investigate whether H I-rich galaxies can cause enhanced star formation in the galaxy’s outer-disc, or whether these galaxies are experiencing strangulation which halts star formation in the outer-discs.
-
The break radii of six galaxies in the Fornax A subgroup are located beyond 1Re. This is contrary to the results of the galaxies in the Fornax cluster core where the break radii of galaxies (80% of the sample) are located within 1Re. This suggests that the environmental mechanisms in the Fornax A group are not as strong as those in the cluster core, where the latter has altered the structures of the galaxies’ disc.
-
Through phase-space analysis, we find that most (80%) of the group members are intermediate and recent infallers, consistent with a younger assembly epoch with respect to the Fornax core, where the PPS is equally populated by ancient infallers (that dominate the high-density region of the cluster) and by intermediate and recent infallers that are symmetrically distributed around the cluster core in the low-density region (Iodice et al. 2019b).
-
The luminosity of the IGL in the Fornax A group is estimated to be 6 ± 2 × 10¹⁰ L⊙ in g. Compared to the total luminosity of the group, the fraction of the IGL is ∼16%. Our estimates agree with model predictions from Contini et al. (2014). Thus, we address the formation history of the IGL in the Fornax A group which is mainly through the past merger of NGC 1316 and the disruption of dwarf galaxies in the same region. This is further supported by the significant drop in the number of dwarf galaxies (∼50%) towards the group centre found by Venhola et al. (2019).
According to the above results and the whole analysis performed in this work, the Fornax A group appears to be in an early-stage of assembly with respect to the cluster core. The environment of the Fornax A subgroup is not as dense as that of the cluster core, with all galaxies except the BGG showing similar morphology, comparable colours and stellar masses, and Type III disc-breaks, without any clear trend of these properties with group-centric distances. The low amount of IGL is also consistent with this picture, since there were no significant gravitational interactions between galaxies that modified the galaxy structure (forming tidal tails or stellar streams) and contributed to the build-up of the IGL. The main contribution to the IGL is from the minor merging in the outskirts of the BGG NGC 1316 and, probably, the disrupted dwarf galaxies close to the group centre.
As future perspectives involve the analysis of the star formation and, therefore, the comparison of it with the detected disc-breaks, we will study the Hα distribution of the brightest LTGs in the Fornax A group (Raj et al., in prep.). A comparison of the overall structural parameters of galaxies in the cluster core and the group is currently analysed by Su et al. (in prep.). All of the mentioned work is part of FDS, thus providing a detailed analysis of the Fornax environment and galaxies therein.
IRAF is distributed by the National Optical Astronomy Observatories, which are operated by the Association of Universities for Research in Astronomy, Inc., under cooperative agreement with the National Science Foundation
Overall, the manual masking, 3σ clipping and model-subtraction improve the isophotal fitting, ensuring the rejection of unmasked sources and defects.
In the dust-free galaxies, the centre corresponds to the intensity peak. If the galaxy light is strongly affected by the dust absorption, we adopted the geometric centre of the isophotes.
The transition radius Rtr is defined as the distance from the centre of the galaxy to the region where an inflection (evident in their SB profiles) in the stellar halo occurs (Cooper et al. 2010, 2013).
Values were corrected for Galactic extinction using the absorption coefficient by Schlegel et al. (1998).
The disc scale-length refers to the region of the disc before and after the break radius.
The number of iterations varies for each galaxy with a minimum of five until a minimal standard deviation of the (n + 1)3 break radii is obtained.
The escape velocity  , where
  ,
,  and
and ![Mathematical equation: $ g_c=[ln(1+c) - \frac{c}{1+c}]^{-1} $](/articles/aa/full_html/2020/08/aa38043-20/aa38043-20-eq9.gif) .
.
Acknowledgments
The authors are grateful to the anonymous referee for the useful comments and suggestions that improved this article. This publication has received funding from the European Union Horizon 2020 research and innovation programme under the Marie Skłodowska-Curie grant agreement n. 721463 to the SUNDIAL ITN network. This work is based on visitor mode observations collected at the European Organisation for Astronomical Research in the Southern Hemisphere under the following VST GTO programs: 094.B-0512(B), 094.B-0496(A), 096.B-0501(B), 096.B-0582(A). NRN acknowledges financial support from the “One hundred top talent program of Sun Yat-sen University” grant N. 71000-18841229. J.F-B acknowledges support through the RAVET project by the grant AYA2016-77237-C3-1-P from the Spanish Ministry of Science, Innovation and Universities (MCIU) and through the IAC project TRACES which is partially supported through the state budget and the regional budget of the Consejería de Economía, Industria, Comercio y Conocimiento of the Canary Islands Autonomous Community. GvdV acknowledges funding from the European Research Council (ERC) under the European Union’s Horizon 2020 research and innovation programme under grant agreement No 724857 (Consolidator Grant ArcheoDyn). This research has made use of the NASA/IPAC Extragalactic Database (NED), which is operated by the Jet Propulsion Laboratory, California Institute of Technology, under contract with the National Aeronautics and Space Administration. We also thank Dr. Johan Knapen for his suggestions and comments.
References
- Allen, R. J., Kacprzak, G. G., Glazebrook, K., et al. 2016, ApJ, 826, 60 [Google Scholar]
- Bahcall, N. A. 1988, ARA&A, 26, 631 [NASA ADS] [CrossRef] [Google Scholar]
- Bahcall, N. A. 1996, ArXiv e-prints [arXiv:astroph/9611148] [Google Scholar]
- Bakos, J., Trujillo, I., & Pohlen, M. 2008, ApJ, 683, L103 [NASA ADS] [CrossRef] [EDP Sciences] [Google Scholar]
- Barnes, J. 1985, MNRAS, 215, 517 [NASA ADS] [CrossRef] [Google Scholar]
- Barnes, J. E., & Hernquist, L. E. 1991, ApJ, 370, L65 [NASA ADS] [CrossRef] [Google Scholar]
- Barnes, J. E., & Hernquist, L. 1996, ApJ, 471, 115 [NASA ADS] [CrossRef] [Google Scholar]
- Barsanti, S., Owers, M. S., Brough, S., et al. 2018, ApJ, 857, 71 [NASA ADS] [CrossRef] [Google Scholar]
- Blumenthal, G. R., Faber, S. M., Primack, J. R., & Rees, M. J. 1984, Nature, 311, 517 [NASA ADS] [CrossRef] [Google Scholar]
- Boselli, A., Boissier, S., Cortese, L., et al. 2006, ApJ, 651, 811 [NASA ADS] [CrossRef] [Google Scholar]
- Bower, R. G., & Balogh, M. L. 2004, in Clusters of Galaxies: Probes of Cosmological Structure and Galaxy Evolution, eds. J. S. Mulchaey, A. Dressler, & A. Oemler, 325 [Google Scholar]
- Butcher, H., & Oemler, A. J. 1984, ApJ, 285, 426 [NASA ADS] [CrossRef] [Google Scholar]
- Cantiello, M., Grado, A., Blakeslee, J. P., et al. 2013, A&A, 552, A106 [NASA ADS] [CrossRef] [EDP Sciences] [Google Scholar]
- Cantiello, M., D’Abrusco, R., Spavone, M., et al. 2018, A&A, 611, A93 [NASA ADS] [CrossRef] [EDP Sciences] [Google Scholar]
- Caon, N., Capaccioli, M., & D’Onofrio, M. 1993, MNRAS, 265, 1013 [NASA ADS] [CrossRef] [Google Scholar]
- Capaccioli, M., Spavone, M., Grado, A., et al. 2015, A&A, 581, A10 [NASA ADS] [CrossRef] [EDP Sciences] [Google Scholar]
- Cattapan, A., Spavone, M., Iodice, E., et al. 2019, ApJ, 874, 130 [NASA ADS] [CrossRef] [Google Scholar]
- Contini, E., De Lucia, G., Villalobos, Á., & Borgani, S. 2014, MNRAS, 437, 3787 [NASA ADS] [CrossRef] [EDP Sciences] [Google Scholar]
- Cooper, M. C., Newman, J. A., Croton, D. J., et al. 2006, MNRAS, 370, 198 [NASA ADS] [CrossRef] [Google Scholar]
- Cooper, A. P., Cole, S., Frenk, C. S., et al. 2010, MNRAS, 406, 744 [NASA ADS] [CrossRef] [Google Scholar]
- Cooper, M. C., Yan, R., Dickinson, M., et al. 2012, MNRAS, 425, 2116 [NASA ADS] [CrossRef] [Google Scholar]
- Cooper, A. P., D’Souza, R., Kauffmann, G., et al. 2013, MNRAS, 434, 3348 [Google Scholar]
- Corwin, H. G., de Vaucouleurs, A., & de Vaucouleurs, G. 1985, Southern Galaxy Catalogue, 4, 1 [NASA ADS] [Google Scholar]
- Cucciati, O., Marinoni, C., Iovino, A., et al. 2010, A&A, 520, A42 [NASA ADS] [CrossRef] [EDP Sciences] [Google Scholar]
- Cucciati, O., Davidzon, I., Bolzonella, M., et al. 2017, A&A, 602, A15 [NASA ADS] [CrossRef] [EDP Sciences] [Google Scholar]
- D’Abrusco, R., Cantiello, M., Paolillo, M., et al. 2016, ApJ, 819, L31 [NASA ADS] [CrossRef] [Google Scholar]
- Davies, J. I., Bianchi, S., Baes, M., et al. 2013, MNRAS, 428, 834 [NASA ADS] [CrossRef] [Google Scholar]
- Deeley, S., Drinkwater, M. J., Cunnama, D., et al. 2017, MNRAS, 467, 3934 [NASA ADS] [CrossRef] [Google Scholar]
- Dekel, A., Stoehr, F., Mamon, G. A., et al. 2005, Nature, 437, 707 [NASA ADS] [CrossRef] [PubMed] [Google Scholar]
- de Mello, D. F., Wiklind, T., & Maia, M. A. G. 2002, A&A, 381, 771 [NASA ADS] [CrossRef] [EDP Sciences] [Google Scholar]
- Dressler, A. 1980, ApJ, 236, 351 [NASA ADS] [CrossRef] [Google Scholar]
- Drinkwater, M. J., Gregg, M. D., & Colless, M. 2001a, ApJ, 548, L139 [NASA ADS] [CrossRef] [Google Scholar]
- Drinkwater, M. J., Gregg, M. D., Holman, B. A., & Brown, M. J. I. 2001b, MNRAS, 326, 1076 [Google Scholar]
- Eigenthaler, P., Puzia, T. H., Taylor, M. A., et al. 2018, ApJ, 855, 142 [NASA ADS] [CrossRef] [Google Scholar]
- Erwin, P. 2004, A&A, 415, 941 [NASA ADS] [CrossRef] [EDP Sciences] [Google Scholar]
- Erwin, P., Beckman, J. E., & Pohlen, M. 2005, ApJ, 626, L81 [Google Scholar]
- Faber, S. M. 1973, ApJ, 179, 731 [NASA ADS] [CrossRef] [Google Scholar]
- Ferguson, H. C. 1989, AJ, 98, 367 [Google Scholar]
- Few, J. M. A., & Madore, B. F. 1986, MNRAS, 222, 673 [NASA ADS] [CrossRef] [Google Scholar]
- Finn, R. A., Desai, V., Rudnick, G., et al. 2018, ApJ, 862, 149 [NASA ADS] [CrossRef] [Google Scholar]
- Fujita, Y. 2004, PASJ, 56, 29 [NASA ADS] [Google Scholar]
- Gómez, P. L., Nichol, R. C., Miller, C. J., et al. 2003, ApJ, 584, 210 [NASA ADS] [CrossRef] [Google Scholar]
- Grootes, M. W., Tuffs, R. J., Popescu, C. C., et al. 2017, AJ, 153, 111 [NASA ADS] [CrossRef] [Google Scholar]
- Guglielmo, V., Poggianti, B. M., Vulcani, B., et al. 2019, A&A, 625, A112 [NASA ADS] [CrossRef] [EDP Sciences] [Google Scholar]
- Gunn, J. E., & Gott, J. R., III 1972, ApJ, 176, 1 [Google Scholar]
- Hashimoto, Y., & Oemler, A., Jr. 2000, ApJ, 530, 652 [Google Scholar]
- Hernández-Fernández, J. D., Haines, C. P., Diaferio, A., et al. 2014, MNRAS, 438, 2186 [NASA ADS] [CrossRef] [Google Scholar]
- Hopkins, P. F., Bundy, K., Croton, D., et al. 2010, ApJ, 715, 202 [NASA ADS] [CrossRef] [Google Scholar]
- Hopkins, P. F., Cox, T. J., Hernquist, L., et al. 2013, MNRAS, 430, 1901 [NASA ADS] [CrossRef] [Google Scholar]
- Horellou, C., Black, J. H., van Gorkom, J. H., et al. 2001, A&A, 376, 837 [NASA ADS] [CrossRef] [EDP Sciences] [Google Scholar]
- Huertas-Company, M., Shankar, F., Mei, S., et al. 2013, ApJ, 779, 29 [NASA ADS] [CrossRef] [Google Scholar]
- Hunter, D. A., & Elmegreen, B. G. 2006, ApJS, 162, 49 [NASA ADS] [CrossRef] [Google Scholar]
- Iodice, E., Capaccioli, M., Grado, A., et al. 2016, ApJ, 820, 42 [NASA ADS] [CrossRef] [Google Scholar]
- Iodice, E., Spavone, M., Cantiello, M., et al. 2017a, ApJ, 851, 75 [Google Scholar]
- Iodice, E., Spavone, M., Capaccioli, M., et al. 2017b, ApJ, 839, 21 [NASA ADS] [CrossRef] [Google Scholar]
- Iodice, E., Spavone, M., Capaccioli, M., et al. 2019a, A&A, 623, A1 [NASA ADS] [CrossRef] [EDP Sciences] [Google Scholar]
- Iodice, E., Sarzi, M., Bittner, A., et al. 2019b, A&A, 627, A136 [NASA ADS] [CrossRef] [EDP Sciences] [Google Scholar]
- Iodice, E., Spavone, M., Cattapan, A., et al. 2020, A&A, 635, A3 [CrossRef] [EDP Sciences] [Google Scholar]
- Jedrzejewski, R. I. 1987, MNRAS, 226, 747 [Google Scholar]
- Jones, C., Stern, C., Forman, W., et al. 1997, ApJ, 482, 143 [Google Scholar]
- Jordán, A., Blakeslee, J. P., Côté, P., et al. 2007, ApJS, 169, 213 [NASA ADS] [CrossRef] [Google Scholar]
- Karachentsev, I. D. 2005, ApJ, 129, 178 [NASA ADS] [CrossRef] [Google Scholar]
- Kauffmann, G., White, S. D. M., Heckman, T. M., et al. 2004, MNRAS, 353, 713 [NASA ADS] [CrossRef] [Google Scholar]
- Kelkar, K., Aragón-Salamanca, A., Gray, M. E., et al. 2015, MNRAS, 450, 1246 [NASA ADS] [CrossRef] [Google Scholar]
- Kim, D.-W., & Fabbiano, G. 2003, ApJ, 586, 826 [NASA ADS] [CrossRef] [Google Scholar]
- Krywult, J., Tasca, L. A. M., Pollo, A., et al. 2017, A&A, 598, A120 [NASA ADS] [CrossRef] [EDP Sciences] [Google Scholar]
- Kuijken, K. 2011, The Messenger, 146, 8 [NASA ADS] [Google Scholar]
- Laine, J., Laurikainen, E., & Salo, H. 2016, A&A, 596, A25 [NASA ADS] [CrossRef] [EDP Sciences] [Google Scholar]
- Larson, R. B., Tinsley, B. M., & Caldwell, C. N. 1980, ApJ, 237, 692 [NASA ADS] [CrossRef] [Google Scholar]
- Lauberts, A. 1982, ESO/Uppsala survey of the ESO(B) atlas [Google Scholar]
- Lewis, I., Balogh, M., De Propris, R., et al. 2002, MNRAS, 334, 673 [NASA ADS] [CrossRef] [Google Scholar]
- Lubin, L. M., Gal, R. R., Lemaux, B. C., Kocevski, D. D., & Squires, G. K. 2009, AJ, 137, 4867 [NASA ADS] [CrossRef] [Google Scholar]
- Lucy, L. B. 1974, AJ, 79, 745 [NASA ADS] [CrossRef] [Google Scholar]
- Mackie, G., & Fabbiano, G. 1998, AJ, 115, 514 [NASA ADS] [CrossRef] [Google Scholar]
- Maddox, N., Serra, P., Venhola, A., et al. 2019, MNRAS, 490, 1666 [CrossRef] [Google Scholar]
- Mahajan, S., Mamon, G. A., & Raychaudhury, S. 2011, MNRAS, 418, 2816 [NASA ADS] [CrossRef] [Google Scholar]
- Mamon, G. A. 2007, ESO Astrophys. Symp. (Springer-Verlag), 203 [Google Scholar]
- Martin, C., & GALEX 2005, in Maps of the Cosmos, eds. M. Colless, L. Staveley-Smith, & R. A. Stathakis, IAU Symp., 216, 221 [NASA ADS] [Google Scholar]
- Mihos, C. 2015, IAU Gen. Assembly, 29, 2247903 [NASA ADS] [Google Scholar]
- Mihos, J. C., Harding, P., Feldmeier, J. J., et al. 2017, ApJ, 834, 16 [NASA ADS] [CrossRef] [Google Scholar]
- Moore, B., Katz, N., Lake, G., Dressler, A., & Oemler, A. 1996, Nature, 379, 613 [NASA ADS] [CrossRef] [Google Scholar]
- Muñoz, R. P., Eigenthaler, P., Puzia, T. H., et al. 2015, ApJ, 813, L15 [NASA ADS] [CrossRef] [Google Scholar]
- Muzzin, A., Wilson, G., Yee, H. K. C., et al. 2012, ApJ, 746, 188 [NASA ADS] [CrossRef] [Google Scholar]
- Muzzin, A., van der Burg, R. F. J., McGee, S. L., et al. 2014, ApJ, 796, 65 [NASA ADS] [CrossRef] [Google Scholar]
- Nantais, J. B., Flores, H., Demarco, R., et al. 2013, A&A, 555, A5 [NASA ADS] [CrossRef] [EDP Sciences] [Google Scholar]
- Napolitano, N. R., Pannella, M., Arnaboldi, M., et al. 2003, ApJ, 594, 172 [NASA ADS] [CrossRef] [Google Scholar]
- Oemler, A., Jr. 1974, ApJ, 194, 1 [NASA ADS] [CrossRef] [Google Scholar]
- Pastoriza, M. G., Bica, E., Maia, M., Bonatto, C., & Dottori, H. 1994, ApJ, 432, 128 [NASA ADS] [CrossRef] [Google Scholar]
- Paulino-Afonso, A., Sobral, D., Darvish, B., et al. 2018, A&A, 620, A186 [NASA ADS] [CrossRef] [EDP Sciences] [Google Scholar]
- Paulino-Afonso, A., Sobral, D., Darvish, B., et al. 2019, A&A, 630, A57 [NASA ADS] [CrossRef] [EDP Sciences] [Google Scholar]
- Peng, Y.-J., Lilly, S. J., Kovač, K., et al. 2010, ApJ, 721, 193 [NASA ADS] [CrossRef] [Google Scholar]
- Poggianti, B. M., Desai, V., Finn, R., et al. 2008, ApJ, 684, 888 [NASA ADS] [CrossRef] [Google Scholar]
- Pohlen, M., & Trujillo, I. 2006, A&A, 454, 759 [NASA ADS] [CrossRef] [EDP Sciences] [Google Scholar]
- Pota, V., Napolitano, N. R., Hilker, M., et al. 2018, MNRAS, 481, 1744 [Google Scholar]
- Raj, M. A., Iodice, E., Napolitano, N. R., et al. 2019, A&A, 628, A4 [Google Scholar]
- Rhee, J., Smith, R., Choi, H., et al. 2017, ApJ, 843, 128 [NASA ADS] [CrossRef] [Google Scholar]
- Richardson, W. H. 1972, J. Opt. Soc. Am. (1917-1983), 62, 55 [Google Scholar]
- Rudick, C. S., Mihos, J. C., Frey, L. H., & McBride, C. K. 2009, ApJ, 699, 1518 [Google Scholar]
- Scharf, C. A., Zurek, D. R., & Bureau, M. 2005, ApJ, 633, 154 [NASA ADS] [CrossRef] [Google Scholar]
- Schipani, P., Noethe, L., Arcidiacono, C., et al. 2012, J. Opt. Soc. Am. A, 29, 1359 [Google Scholar]
- Schlegel, D. J., Finkbeiner, D. P., & Davis, M. 1998, ApJ, 500, 525 [NASA ADS] [CrossRef] [Google Scholar]
- Seigar, M. S., Graham, A. W., & Jerjen, H. 2007, MNRAS, 378, 1575 [NASA ADS] [CrossRef] [Google Scholar]
- Serra, P., Maccagni, F. M., Kleiner, D., et al. 2019, A&A, 628, A122 [NASA ADS] [CrossRef] [EDP Sciences] [Google Scholar]
- Sérsic, J. L. 1963, Bol. Asoc. Argent. Astron. Plata Argent., 6, 41 [Google Scholar]
- Shen, S., Mo, H. J., White, S. D. M., et al. 2003, MNRAS, 343, 978 [NASA ADS] [CrossRef] [Google Scholar]
- Sommer-Larsen, J. 2006, MNRAS, 369, 958 [NASA ADS] [CrossRef] [Google Scholar]
- Spavone, M., Capaccioli, M., Napolitano, N. R., et al. 2017, A&A, 603, A38 [NASA ADS] [CrossRef] [EDP Sciences] [Google Scholar]
- Spavone, M., Iodice, E., Capaccioli, M., et al. 2018, ApJ, 864, 149 [NASA ADS] [CrossRef] [Google Scholar]
- Spavone, M., Iodice, E., van de Ven, G., et al. 2020, A&A, 639, A14 [CrossRef] [EDP Sciences] [Google Scholar]
- Spiniello, C., Napolitano, N. R., Arnaboldi, M., et al. 2018, MNRAS, 477, 1880 [Google Scholar]
- Stewart, K. R., Bullock, J. S., Wechsler, R. H., & Maller, A. H. 2009, ApJ, 702, 307 [NASA ADS] [CrossRef] [Google Scholar]
- Su, Y., Nulsen, P. E. J., Kraft, R. P., et al. 2017, ApJ, 851, 69 [Google Scholar]
- Tasca, L. A. M., Kneib, J. P., Iovino, A., et al. 2009, A&A, 503, 379 [NASA ADS] [CrossRef] [EDP Sciences] [Google Scholar]
- Taylor, E. N., Hopkins, A. M., Baldry, I. K., et al. 2011, MNRAS, 418, 1587 [NASA ADS] [CrossRef] [Google Scholar]
- Tully, R. B., Rizzi, L., Shaya, E. J., et al. 2009, AJ, 138, 323 [NASA ADS] [CrossRef] [Google Scholar]
- Tully, R. B., Courtois, H., Hoffman, Y., & Pomarède, D. 2014, Nature, 513, 71 [NASA ADS] [CrossRef] [Google Scholar]
- van der Wel, A., Holden, B. P., Franx, M., et al. 2007, ApJ, 670, 206 [NASA ADS] [CrossRef] [Google Scholar]
- Venhola, A., Peletier, R., Laurikainen, E., et al. 2017, A&A, 608, A142 [NASA ADS] [CrossRef] [EDP Sciences] [Google Scholar]
- Venhola, A., Peletier, R., Laurikainen, E., et al. 2018, A&A, 620, A165 [NASA ADS] [CrossRef] [EDP Sciences] [Google Scholar]
- Venhola, A., Peletier, R., Laurikainen, E., et al. 2019, A&A, 625, A143 [EDP Sciences] [Google Scholar]
- Visvanathan, N., & Sandage, A. 1977, ApJ, 216, 214 [NASA ADS] [CrossRef] [Google Scholar]
- Wang, J., Zheng, Z., D’Souza, R., et al. 2018, MNRAS, 479, 4292 [NASA ADS] [CrossRef] [Google Scholar]
- Watkins, A. E., Laine, J., Comerón, S., Janz, J., & Salo, H. 2019, A&A, 625, A36 [NASA ADS] [CrossRef] [EDP Sciences] [Google Scholar]
- Younger, J. D., Cox, T. J., Seth, A. C., & Hernquist, L. 2007, ApJ, 670, 269 [Google Scholar]
- Zabel, N., Davis, T. A., Smith, M. W. L., et al. 2019, MNRAS, 483, 2251 [NASA ADS] [CrossRef] [Google Scholar]
- Zabludoff, A. I., & Mulchaey, J. S. 1998, ApJ, 496, 39 [NASA ADS] [CrossRef] [Google Scholar]
- Zibetti, S., White, S. D. M., Schneider, D. P., & Brinkmann, J. 2005, MNRAS, 358, 949 [Google Scholar]
Appendix A: Bright LTGs in the Fornax A subgroup
In this section, we briefly describe the galaxies analysed in this work.
A.1. FCC013
Also known as NGC 1310, is a barred-spiral galaxy (SBcII) with morphological type T = 5, located at a projected distance Dcore = 0.25 deg from NGC 1316. The H I disc of this galaxy is more extended than its stellar disc, with MH I = 48.0 ± 0.9 × 10⁷ M⊙ (Serra et al. 2019). The galaxy has an effective radius Re,r = 27.6″ and star-forming spiral arms. We detect a Type III disc-break in its SB profile and, hence, the break radius is 7.8 kpc. The outer disc appears redder than the inner disc with average (g − i)hout − hin = 0.44 mag. The origin of the Type III break in this galaxy is likely due to its high H I content.
A.2. FCC022
Also known as NGC 1317, is a spiral galaxy (SA pec) with morphological type T = 1, located at closest projected distance from NGC 1316, that is, Dcore = 0.025 deg from NGC 1316. The H I disc of the galaxy is confined to its stellar disc and has H I mass MH I = 26.4±0.6 ×10⁷ M⊙ (Horellou et al. 2001; Serra et al. 2019), while in the central part of this galaxy, that is, at R ∼ 0.5′, a star-forming ring is visible. It appears to be an early-type spiral, with almost no star-forming regions beyond R ∼ 0.5′, which can be seen in its SB image (Appendix B.2). This can be justified with the results from phase-space analysis that FCC022 has passed through the pericentre and lost its neutral gas through interactions with the intra-group medium (see also Serra et al. 2019).
A.3. FCC028
FCC028 is a spiral galaxy (SmIII) with morphological type T = 9, located at projected distance Dcore = 0.28 deg from NGC 1316. From literature, the galaxy has been associated to a ring galaxy (Few & Madore 1986; Corwin et al. 1985; Lauberts 1982). The ring can be seen as star forming regions in the SB image B.3, which has likely originated from a collision (Maddox et al. 2019). The H I disc of the galaxy is more extended than its stellar disc and has H I mass MH I = 13.7±0.6 ×10⁷ M⊙ (Serra et al. 2019). We detect a Type III disc-break in its SB profile and its break radius is at 3.9 kpc. The outer disc of this galaxy is redder than its inner disc with an average (g − i)hout − hin = 0.04 mag.
A.4. FCC029
Also known as NGC 1326, is a barred-spiral galaxy (SBa(r)) with morphological type T = 1 is located at a projected distance Dcore = 0.68 deg from NGC 1316. Erwin (2004) describe it as a double barred galaxy. It is the most luminous, massive galaxy in our sample of LTGs with Mi = −21.53 and M* = 2.94 × 10¹⁰ M⊙. We detect a Type III disc-break with a break radius = 5.4 kpc. The outer disc is bluer than its inner disc with (g − i)hout − hin = −0.24 mag. This can be associated to the star-forming regions in its outskirts.
A.5. FCC033
Also known as NGC 1316C, is a spiral galaxy (SdIII pec) with morphological type T = 7, located at a projected distance Dcore = 0.37 deg from NGC 1316. The spiral arms are within R = 10″. The effective radius of this galaxy is Re,g = 22.6 ± 0.5″ and has a faint corona (Corwin et al. 1985).
A.6. FCC035
FCC 035 is a spiral galaxy (SmIV) with morphological type T = 9, and is located at a projected distance Dcore = 0.44 deg from NGC 1316. It is the faintest galaxy in our sample Mi = −17.39 and M* = 0.017 × 10¹⁰ M⊙. We detect a Type III disc break in its SB profile with break radius = 2.8 kpc. The outer disc is bluer than its inner disc with (g − i)hout − hin = −0.36 mag. The Hα (Raj et al., in prep.) distribution in the galaxy is concentrated in a star-forming region located in its spiral arms, which explains the blue (g − i) colours. This can also be associated to its very-late morphological type and irregularities in its spiral structure.
A.7. FCC037
Also known as NGC 1326A, is a barred-spiral galaxy (SBcIII) with morphological type T = 5, located at a projected distance Dcore = 0.87 deg. This galaxy has been studied as an interacting system along with FCC 039 (NGC 1327B). However, from our analysis in PPS (data taken from Maddox et al. 2019), we find the velocity difference between these galaxies is large and thus, they might not be interacting.
A.8. FCC039
Also known as NGC 1327B, is a spiral galaxy (SdIII) with morphological type T = 7, located at a projected distance Dcore = 0.86 deg from NGC 1316. This galaxy has irregular spiral (dusty) arms, and disruptions in outer disc as a result of its recent interaction with the tidal field of the Fornax environment. We detect a Type III disc-break in its surface brightness profile and a break radius = 9.6 kpc. As mentioned in Appendix A.7, this galaxy might not be interacting with FCC 037 (NGC 1327A). However, it can be a fly-by thus showing faint tidal tails in its outskirts. The outer disc of this galaxy is redder than its inner disc with (g − i)hout − hin = 0.36 mag.
A.9. FCC062
Also known as NGC 1341, is a barred-spiral galaxy (SbcII) with morphological type T = 4, located at furthest distance from NGC 1316, that is, Dcore = 0.92 deg. We detect a Type III disc-break in its SB profile with disc break = 5.28 kpc. The outer disc of this galaxy is redder than its inner disc with spiral arms, Type III disc break with (g − i)hout − hin = 0.08 mag.
Appendix B: The sample: Images and profiles
In this section, we show the g-band VST images (in surface brightness level) of LTGs in the Fornax A subgroup, surface brightness profiles, g − i colour maps and (g − i) profiles. For six of the galaxies with disc-breaks, we mark the break radius on the g-band images in surface brightness level (black dotted lines), the g − i colour maps (white dotted lines), and (g − i) colour profiles (red dotted lines).
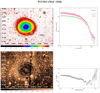 |
Fig. B.1. Surface photometry of FCC013. Top left panel: g-band image in SB level with black dotted lines representing the break-radius. Top right panel: SB profiles in g, r, i bands. Bottom left panel: g − i colour map with white dotted lines indicating the break-radius. Bottom right panel: g − i colour profile with red dotted line indicating the break radius. |
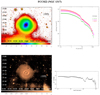 |
Fig. B.2. Surface photometry of FCC022. Top left panel: g-band image in SB level. Top right panel: SB profiles in g, r, i bands. Bottom panels: g − i colour map (left) and g − i colour profile (right). |
Appendix C: Methodologies
In this section, we show the final residual image used in estimating the IGL in Fig. C.1. We also briefly describe the 1D multi-component fitting method we adopt, published by Spavone et al. (2017, 2020). This is done to determine the starting point of the disc regions for the break-radius algorithm (described in Sect. 3.4).
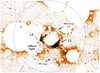 |
Fig. C.1. Residual image in g-band used for estimating the IGL. The image size is ∼87.7 × 63.4 arcmin2. The blue dotted circle is the circular aperture with radius = 33.5′; the IGL is estimated in this region. All bright galaxies are marked with black circles. The known luminous structures- loops L1, L2, L5 (SW loop), L9 (NW loop) are indicated (see also Iodice et al. 2017b). A patch of diffuse light is also indicated. |
We perform a multi-component fit to the deconvolved surface brightness profiles of five galaxies (NGC 1310, NGC 1326, FCC035, NGC 1326B, NGC 1341). The bulge component is fitted with a Sérsic law (Sérsic 1963; Caon et al. 1993),
![Mathematical equation: $$ \begin{aligned} \mu (R)= \mu _e + k(n)\left[\left(\frac{R}{r_e}\right)^{1/n}-1\right] \end{aligned} $$](/articles/aa/full_html/2020/08/aa38043-20/aa38043-20-eq10.gif) (C.1)
(C.1)
where k(n) = 2.17n + 0.35, R is the galactocentric radius, re, μe are the effective radius and surface brightness. The disc component is fitted with an exponential profile (n = 1),
 (C.2)
(C.2)
where μ0 and rh are the central surface brightness and exponential scale length. The parameters are not fixed for the Sérsic component. The fitting procedure adopted here performs least-square fits using a Levenberg-Marquadt algorithm in which the function to be minimised is the rms scatter (see Seigar et al. 2007), defined as  where m is the number of data points and δi is ith residual. The best fits are shown in Fig. C.2 and their corresponding fitting parameters are listed in Table C.1. The limiting radius of the intensity profiles in the r-band and its corresponding surface brightness are listed in Table C.2.
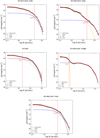 |
Fig. C.2. Multi-component fits of the surface brightness profiles (r-band) of galaxies with Type III disc break. In each plot, the multi-component fits, that is, bulge is indicated in orange, exponential disc is indicated in blue, and total (bulge+disc) is indicated in black. The intersecting point of the two components is indicated with a red dashed line. |
Best-fitting parameters for five galaxies with detected disc-breaks in the Fornax A subgroup.
Limiting radius of intensity profiles.
All Tables
Best-fitting parameters for five galaxies with detected disc-breaks in the Fornax A subgroup.
All Figures
|
Fig. 1. VST mosaic in g-band of the Fornax A subgroup covering 3 × 2 deg2. The red dashed circle is an approximate measure of the virial radius of the group, which is ∼1 deg2 (Drinkwater et al. 2001a). The black dashed circle (r = 0.58 deg) is the region where the IGL is estimated. All galaxies part of the Fornax cluster and Fornax A subgroup, taken from Venhola et al. (2019) are indicated. The red cross indicates NGC 1316. Bright galaxies (mB < 16 mag) are represented with blue circles. Red diamond represents dE (mB < 16 mag), pink squares represent dE (mB > 16 mag), and purple squares represent dl (mB > 16 mag). |
| In the text | |
|
Fig. 2. Surface brightness profiles of galaxies with Type III disc break, with (g − i) colour as a third parameter. In each plot, the break radius (Br) is marked at the intersecting point of the linear fits performed between hin and hout, with σnBr as the median of (n + 1)3 combinations of best fits on the inner and outer scale-lengths. The vertical dashed lines (maxhin and maxhout) indicate the regions for maxrangein = rangein ± n and maxrangeout = rangeout ± n where the algorithm produces (n + 1)2 linear least square fits. The shaded regions on hin and hout indicate the median of the rms of the residuals for (n + 1)2 linear least square fits. |
| In the text | |
|
Fig. 3. Hubble type T as a function of group-centric (left panel) and cluster-centric distance (right panel) for bright galaxies in the Fornax A subgroup (left panel) and Fornax cluster core (right panel). Data for the cluster core galaxies are taken from Iodice et al. (2019a) for ETGs and Raj et al. (2019) for LTGs. |
| In the text | |
|
Fig. 4. Left panels: stellar mass as function of projected distance from NGC 1316 (top panel) and colour-magnitude relation (lower panel) for bright spiral galaxies inside the virial radius of the Fornax A sub group. Right panels: size-mass relation (top panel) and effective radius as a function of projected distance from NGC 1316 (lower panel) for all the bright spiral galaxies in the Fornax A subgroup. A least square fit to the data is shown in orange (including NGC 1316) and blue (excluding NGC 1316). |
| In the text | |
|
Fig. 5. g − i (top panel) and g − r (lower panel) colours as a function of projected distance from NGC 1316 in degrees and Mpc. A least square fit to the g − r data is shown. Slope of the fit is 0.23 ± 0.15. |
| In the text | |
|
Fig. 6. Analysis of galaxies with a break in their surface brightness profiles. Circles represent Type III, with average (g − i) colour of hout − hin as colour map. Orange triangles and green circles represent Type II and Type III galaxies in the Fornax cluster core (data taken from Raj et al. 2019). Top panel left: stellar mass as a function of break radius. Top panel right: total magnitude as a function of break radius normalised to effective radius. The red dashed line indicates 80% of the Fornax cluster core galaxies with disc-breaks. Bottom panels: absolute magnitude in i-band as a function of inner scale-length hin (left) and outer scale-length hout (right). |
| In the text | |
|
Fig. 7. Projected phase-space diagram of galaxies in the Fornax A subgroup within a group-centric distance of 1.05 deg ∼ 0.38 Mpc. The blue trajectory corresponds to the escape velocity of the group. Regions E (orange), D (green), B (pink) represent ancient, intermediate, and recent infallers as defined by Rhee et al. (2017). The bright spiral galaxies are indicated with coloured circles based on their morphological type T (red, purple, brown), NGC 1316 is indicated with a green triangle (T = −1) and dwarf galaxies are indicated with blue squares. |
| In the text | |
|
Fig. 8. Fraction of IGL by mergers (left panel) and fraction of IGL accreted (right panel), as a function of the BGG stellar mass for four groups: NGC 1316, NGC 5018 (Spavone et al. 2018), NGC 1533 (Cattapan et al. 2019), IC 1459 (Iodice et al. 2020). The shaded areas represent the 20th and 80th percentile of the “model disruption” described by Contini et al. (2014). |
| In the text | |
|
Fig. 9. Histogram of the colour (g − i) distribution (left panel) and of the stellar mass (right panel) for the bright galaxies in the Fornax core and Fornax A subgroup. |
| In the text | |
|
Fig. B.1. Surface photometry of FCC013. Top left panel: g-band image in SB level with black dotted lines representing the break-radius. Top right panel: SB profiles in g, r, i bands. Bottom left panel: g − i colour map with white dotted lines indicating the break-radius. Bottom right panel: g − i colour profile with red dotted line indicating the break radius. |
| In the text | |
|
Fig. B.2. Surface photometry of FCC022. Top left panel: g-band image in SB level. Top right panel: SB profiles in g, r, i bands. Bottom panels: g − i colour map (left) and g − i colour profile (right). |
| In the text | |
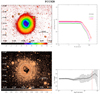 |
Fig. B.3. Surface photometry of FCC028. Description same as Fig. B.1. |
| In the text | |
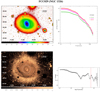 |
Fig. B.4. Surface photometry of FCC029. Description same as Fig. B.1. |
| In the text | |
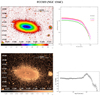 |
Fig. B.5. Surface photometry of FCC033. Description same as Fig. B.2. |
| In the text | |
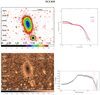 |
Fig. B.6. Surface photometry of FCC035. Description same as Fig. B.1. |
| In the text | |
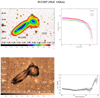 |
Fig. B.7. Surface photometry of FCC037. Description same as Fig. B.2. |
| In the text | |
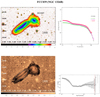 |
Fig. B.8. Surface photometry of FCC039. Description same as Fig. B.1. |
| In the text | |
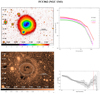 |
Fig. B.9. Surface photometry of FCC062. Description same as Fig. B.1. |
| In the text | |
|
Fig. C.1. Residual image in g-band used for estimating the IGL. The image size is ∼87.7 × 63.4 arcmin2. The blue dotted circle is the circular aperture with radius = 33.5′; the IGL is estimated in this region. All bright galaxies are marked with black circles. The known luminous structures- loops L1, L2, L5 (SW loop), L9 (NW loop) are indicated (see also Iodice et al. 2017b). A patch of diffuse light is also indicated. |
| In the text | |
|
Fig. C.2. Multi-component fits of the surface brightness profiles (r-band) of galaxies with Type III disc break. In each plot, the multi-component fits, that is, bulge is indicated in orange, exponential disc is indicated in blue, and total (bulge+disc) is indicated in black. The intersecting point of the two components is indicated with a red dashed line. |
| In the text | |
Current usage metrics show cumulative count of Article Views (full-text article views including HTML views, PDF and ePub downloads, according to the available data) and Abstracts Views on Vision4Press platform.
Data correspond to usage on the plateform after 2015. The current usage metrics is available 48-96 hours after online publication and is updated daily on week days.
Initial download of the metrics may take a while.