Fig. B.1.
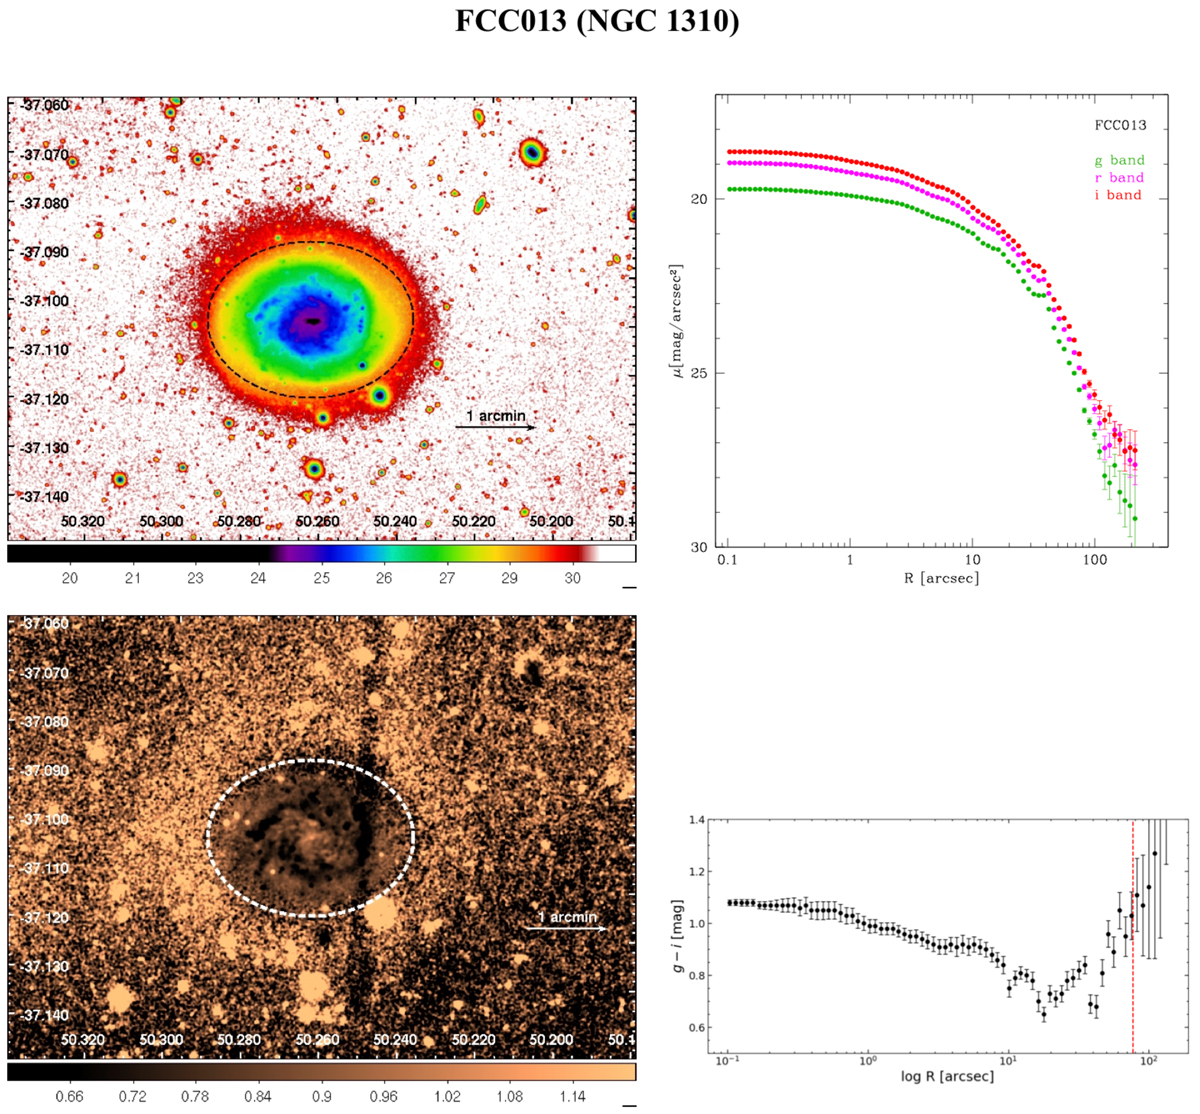
Surface photometry of FCC013. Top left panel: g-band image in SB level with black dotted lines representing the break-radius. Top right panel: SB profiles in g, r, i bands. Bottom left panel: g − i colour map with white dotted lines indicating the break-radius. Bottom right panel: g − i colour profile with red dotted line indicating the break radius.
Current usage metrics show cumulative count of Article Views (full-text article views including HTML views, PDF and ePub downloads, according to the available data) and Abstracts Views on Vision4Press platform.
Data correspond to usage on the plateform after 2015. The current usage metrics is available 48-96 hours after online publication and is updated daily on week days.
Initial download of the metrics may take a while.