Fig. 7.
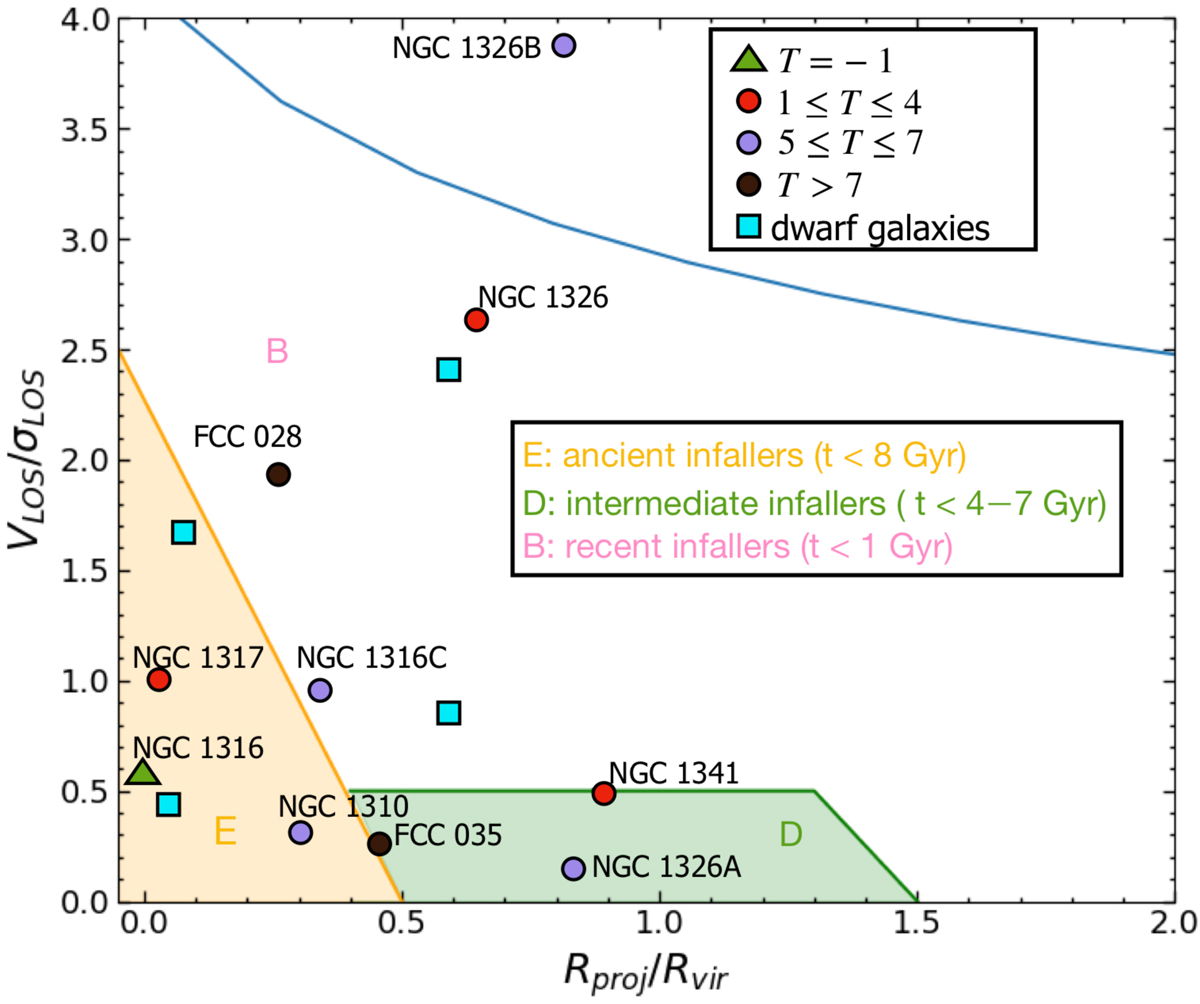
Projected phase-space diagram of galaxies in the Fornax A subgroup within a group-centric distance of 1.05 deg ∼ 0.38 Mpc. The blue trajectory corresponds to the escape velocity of the group. Regions E (orange), D (green), B (pink) represent ancient, intermediate, and recent infallers as defined by Rhee et al. (2017). The bright spiral galaxies are indicated with coloured circles based on their morphological type T (red, purple, brown), NGC 1316 is indicated with a green triangle (T = −1) and dwarf galaxies are indicated with blue squares.
Current usage metrics show cumulative count of Article Views (full-text article views including HTML views, PDF and ePub downloads, according to the available data) and Abstracts Views on Vision4Press platform.
Data correspond to usage on the plateform after 2015. The current usage metrics is available 48-96 hours after online publication and is updated daily on week days.
Initial download of the metrics may take a while.