Fig. 6.
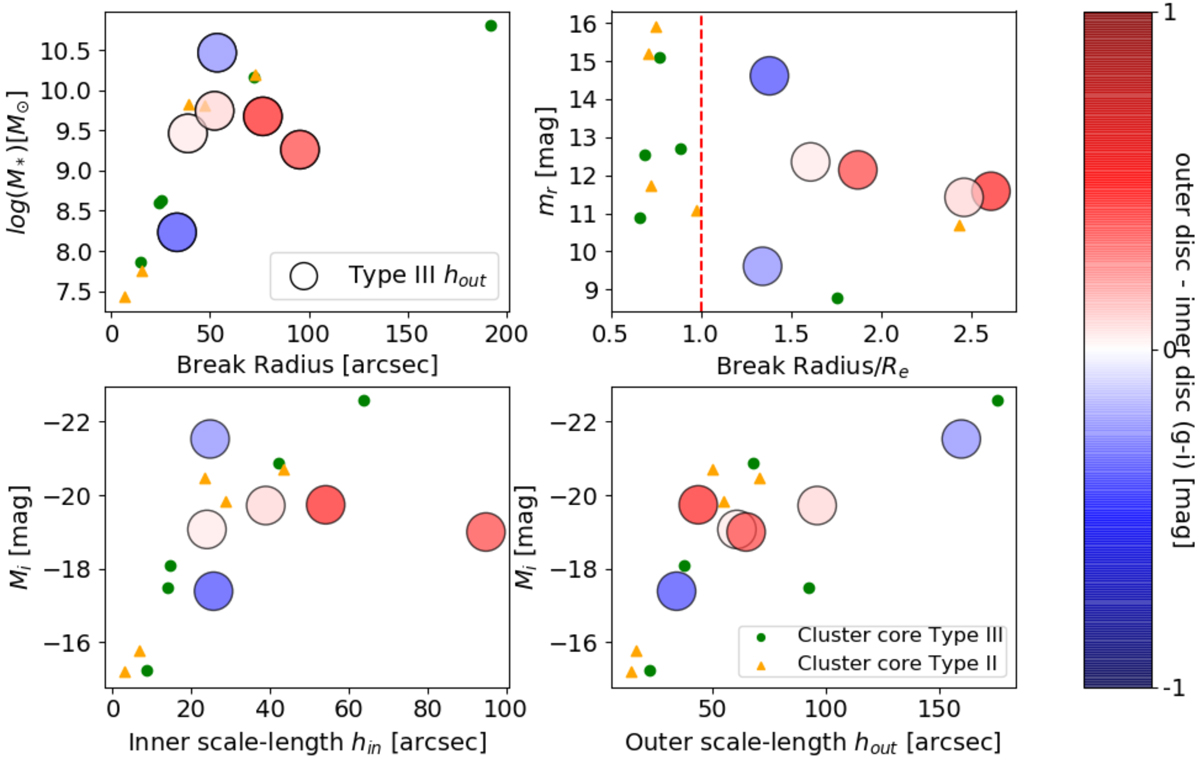
Analysis of galaxies with a break in their surface brightness profiles. Circles represent Type III, with average (g − i) colour of hout − hin as colour map. Orange triangles and green circles represent Type II and Type III galaxies in the Fornax cluster core (data taken from Raj et al. 2019). Top panel left: stellar mass as a function of break radius. Top panel right: total magnitude as a function of break radius normalised to effective radius. The red dashed line indicates 80% of the Fornax cluster core galaxies with disc-breaks. Bottom panels: absolute magnitude in i-band as a function of inner scale-length hin (left) and outer scale-length hout (right).
Current usage metrics show cumulative count of Article Views (full-text article views including HTML views, PDF and ePub downloads, according to the available data) and Abstracts Views on Vision4Press platform.
Data correspond to usage on the plateform after 2015. The current usage metrics is available 48-96 hours after online publication and is updated daily on week days.
Initial download of the metrics may take a while.