| Issue |
A&A
Volume 638, June 2020
|
|
|---|---|---|
| Article Number | A9 | |
| Number of page(s) | 10 | |
| Section | Galactic structure, stellar clusters and populations | |
| DOI | https://doi.org/10.1051/0004-6361/202037691 | |
| Published online | 29 May 2020 | |
A census of the nearby Pisces-Eridanus stellar stream
Commonalities with and disparities from the Pleiades⋆
Zentrum für Astronomie der Universität Heidelberg, Astronomisches Rechen-Institut, Mönchhofstraße 12-14, 69120 Heidelberg, Germany
e-mail: This email address is being protected from spambots. You need JavaScript enabled to view it.
, This email address is being protected from spambots. You need JavaScript enabled to view it.
Received:
9
February
2020
Accepted:
8
April
2020
Abstract
Aims. Within a sphere of 400 pc radius around the Sun, we aim to search for members of the Pisces-Eridanus (Psc-Eri) stellar stream in the Gaia Data Release 2 data set. We compare basic astrophysical characteristics of the stream with those of the Pleiades.
Methods. We used a modified convergent-point method to identify stars with 2D velocities consistent with the space velocity of the Psc-Eri stream and the Pleiades, respectively.
Results. In a G magnitude range from 5.1 mag to 19.3 mag, we found 1387 members of the Psc-Eri stream at distances between 80 and 380 pc from the Sun. The stream has a nearly cylindrical shape with a length of at least 700 pc and a thickness of 100 pc. The accumulated stellar mass of the 1387 members amounts to about 770 M⊙, and the stream is gravitationally unbound. For the stream, we found an age of about 135 Myr. In many astrophysical properties, Psc-Eri is comparable to the open cluster M45 (the Pleiades): in its age, its luminosity function, its present-day mass function, as well as in its total mass. Nonetheless, the two stellar ensembles are completely different in their physical appearance. We cautiously give two possible explanations for this disagreement: (i) the star formation efficiency in their parental molecular clouds was higher for the Pleiades than for Psc-Eri, and/or (ii) the Pleiades had a higher primordial mass segregation immediately after the expulsion of the molecular gas of the parental cloud.
Key words: globular clusters: individual: Pisces-Eridanus stream / stars: evolution / stars: luminosity function, mass function / Hertzsprung-Russell and C-M diagrams / open clusters and associations: individual: M45 (Pleiades)
Full Tables A.1 and A.2 are only available at the CDS via anonymous ftp to cdsarc.u-strasbg.fr (130.79.128.5) or via http://cdsarc.u-strasbg.fr/viz-bin/cat/J/A+A/638/A9
© ESO 2020
1. Introduction
Meingast et al. (2019) recently reported about the revelation of a highly elongated, coeval stream of stars in the Solar neighbourhood. Their search was based on a subset of the catalogue from Gaia Data Release 2 (DR2; Gaia Collaboration (2018b), which contains stars with radial velocities measured by Gaia. The Gaia Radial Velocity Spectrometer (Cropper et al. 2018) provides measurements only for stars with surface temperatures between 3550 and 6900 K (Katz et al. 2019). Meingast et al. (2019) found 256 co-moving stars with 3D velocities to be members of the stream. At a length of some 400 pc, the width of the stream amounts to only about 50 pc. The 3D velocity dispersion of the members is found to be only 1.3 km s−1. The members follow a well-defined main sequence in the colour-absolute magnitude diagram (CAMD), and the authors estimated an age of about 1 Gyr for the stream based on giant stars among their members. Indeed, this estimate was essentially based on the presence of the G8IV sub-giant 42 Cet A, which is part of a triple stellar system.
Meingast et al. (2019) did not give a name to the stream, but a few months later Curtis et al. (2019) made a new determination of the stream’s age and named it Pisces-Eridanus (PSC-Eri) stellar stream, and we use this name throughout this paper. They used rotation-period measurements from the Transiting Exoplanet Survey Satellite (TESS; Ricker et al. 2015), which were available for 101 stars of the Meingast et al. (2019) sample. From comparisons of the rotation periods of three benchmark open clusters: NGC 6811, Praesepe, and the Pleiades, Curtis et al. (2019) found remarkable agreement between the loci of Psc-Eri stars with those of Pleiades stars in the rotation period–effective temperature diagram, which was a clear hint that both stellar aggregations are coeval. Therefore, they assigned the Psc-Eri stream an age of ≈120 Myr, which is much younger than estimated by Meingast et al. (2019).
The first aim of this paper is to perform a membership census of the stream in 5D of phase space down to the limiting magnitude of Gaia DR2. We use this census to re-determine the age of the stream, as well as to derive its luminosity function (LF) and its present-day mass function (PDMF). As a second aim, we would like to compare its properties with those of the Pleiades.
The paper is structured as follows. In Sect. 2, we describe the steps we undertook to find the members of the Psc-Eri stream. In Sect. 3, the properties of the stream are discussed. We present the CAMD, LF, PDMF, describe the structure and kinematics of the stream, and compare these properties with those of the Pleiades. In Sect. 4, we propose an explanation as to why the two stellar ensembles, the Psc-Eri stream, and the Pleiades have such different physical appearances despite their parity in many astrophysical parameters. A summary concludes the paper1.
2. Finding candidate members in the Pisces-Eridanus stream
For kinematic studies in the neighbourhood of the Sun, we had previously constructed an astrometrically and photometrically clean sample of 8 131 092 stars with parallaxes greater than 2.4 mas from Gaia DR2, where we strictly followed the recommendations given in document GAIA-C3-TN-LU-LL-124-01 by L. Lindegren. The document is published on the ESA webpage2. The first criterion is the “re-normalised unit weight error” cut (RUWE). Values for the RUWE can be found, for example, at the service3 in table gaiaDR2light. The upper threshold allowed for RUWE is 1.4. The second astrometric cut is the parallax-cut, which means σϖ/ϖ must be smaller than 0.1. The photometric criteria we used are described in Lindegren et al. (2018). These are the “visibility periods used” cut (Eq. (11), ii) and the “flux excess ratio” cut (Eq. (C.2)). The resulting sample (hereafter 2.4 mas catalogue) is described in Röser et al. (2019). It is incomplete at the faint end of the magnitude distribution near G = 18 mag and also near the parallax limit of 2.4 mas. In the following, we used this catalogue in our search for new members of the Psc-Eri stream by applying the procedures to detect over-densities in coordinate and velocity space developed in Röser & Schilbach (2019). The method is briefly repeated below.
As a starting point, we determined the 6D-phase space coordinates of the approximate centre of the stream on the basis of positions, proper motions, parallaxes, and radial velocities from Gaia DR2. We used the membership information from Meingast et al. (2019). The coordinates are given in the Galactic Cartesian coordinate system with origin in the barycentre of the Solar system. The X-axis points to the Galactic centre, the Y-axis in the direction of Galactic rotation, and Z-axis to the Galactic north pole. The corresponding velocity coordinates are U, V, W. We used 232 stars from Meingast et al. (2019) that are present in our 2.4 mas catalogue and found the mean values
 (1)
(1)
The standard deviations of the velocity coordinates are 2.2, 1.3, and 1.7 km s−1.
2.1. Constraining the range in space and velocity
In general, a stellar stream reveals itself as an over-density in position and velocity space. Meingast et al. (2019) restricted themselves to stars with radial velocities measured in Gaia DR2. However, accurate radial velocities are lacking for the vast majority of stars in Gaia DR2, and they are only available for stars with effective temperatures between 3550 bis 6900 K. Therefore, we had to rely on criteria that are solely based on their tangential velocities. This implies that we may detect stars that are highly likely to be co-moving, although they will need final confirmation when the radial velocities are measured. We followed the formalism of the convergent point (CP) method as described in van Leeuwen (2009), for instance, and transformed the Cartesian velocity vector of the cluster motion Vc from Eq. (1) to give predicted velocities V∥pred and V⊥pred parallel and perpendicular to the direction to the CP for each star depending on its position on the sky. This approach is appropriate and very successful in finding nearby open star clusters with fixed Vc and low velocity dispersion. Yet, the Psc-Eri stream from Meingast et al. (2019) extends over more than 400 pc in space, and the assumption of a fixed Vc may not be justified. In fact, we find high correlations between the spatial coordinates X and Y, and the velocity components U and V of the 232 stars from Meingast et al. (2019). The correlation coefficients are 0.90 for U vs. Y and 0.66 for V vs. X.
 (2)
(2)
There is no considerable correlation of the velocity component W with spatial coordinates. The correlations in Eq. (2) are an intrinsic property of the Meingast et al. (2019) sample of stars in the Psc-Eri stream. So, we cannot simply follow the classical convergent point algorithm, which uses a constant space velocity such as Vc from Eq. (1) in order to find new candidate members of this stream. Instead, we calculated the predicted velocities V∥pred and V⊥pred for a star with Cartesian coordinates X, Y, Z by using U, V from Eq. (2), and W from Eq. (1).
Also with this modification to the convergent point, method V⊥pred ≡ 0 still holds. Next, we similarly transformed the measured (observed) tangential velocities for each star, meaning κ μα*/ϖ and κ μδ/ϖ into V∥obs and V⊥obs. In this case, ϖ is the measured trigonometric parallax in Gaia DR2 and κ = 4.74047 is the transformation factor from 1 mas yr−1 at 1 kpc to 1 km s−1. We set in the following ΔV∥ = V∥obs − V∥pred and ΔV⊥ = V⊥obs − V⊥pred. We also determined the covariance matrix for the velocities V∥obs and V⊥obs via error propagation from the covariance matrix of the μα*, μδ, and ϖ.
According to Meingast et al. (2019), the stream is at least 400 pc long and has a vertical extent of 50 pc. Our 2.4 mas catalogue makes it possible to search for co-moving stream members in a sphere of 350 pc around Rc from Eq. (1). On the other hand, the small vertical extent of the stream justifies a cut in the z-plane. We used |Z − Zc|≤100 pc, where Zc is given in Eq. (1). We also introduced a restriction in the tangential velocity plane by requiring |ΔV∥|≤ 4 km s−1 and |ΔV⊥|≤ 4 km s−1, a total area of 64 (km s−1)2. These cuts are ample enough to cover the original Meingast et al. (2019) stream. They enable us to extend the search within a larger volume and also allow us to estimate statistical noise (or background contamination) in 5D space due to the presence of field stars. The restrictions above reduced our selection to a sub-sample containing 42 733 stars that populate this search volume.
2.2. Method to find over-densities
The method is described in detail in Röser & Schilbach (2019). We only repeat the basic idea here. The aim of the method is to separate over-densities such as clusters or moving groups (signal) from the local Galactic background (noise). For each star i out of our sample of 42 733 stars in the previous section, we define a neighbourhood in physical and velocity space via the following definition: a star j with 5D coordinates (Xj, Yj, Zj, ΔV∥j, ΔV⊥j) is a neighbour to star i with coordinates (Xi, Yi, Zi, ΔV∥i, ΔV⊥i) if
 (3)
(3)
and
 (4)
(4)
The free parameters a and rlim can be specified according to the goal of the study. In this paper, we chose a = 1.0 km s−1 and rlim = 10 pc. When a star i is surrounded by k neighbours, we call this case a “k neighbourhood”. In our sample of 42 733 stars, we found 33 509 stars belonging to a zero neighbourhood, 3577 to a one neighbourhood, and 1685 to a two neighbourhood. This corresponds to 94.9% of our sample. Assuming that the distribution of field stars follows a Poisson distribution, Röser & Schilbach (2019) calculated the probability pcont of field star contamination for each k neighbourhood. In our sample of 42 733 stars, zero and one neighbourhoods consist overwhelmingly of field stars. Stars with two neighbours have pcont = 0.64, meaning 64% contamination, while stars with three neighbours only have pcont = 0.12. We therefore restricted our selection of member candidates of the Psc-Eri stream to stars with at least three neighbours (k ≥ 3), which holds for 2162 stars. For simplicity, we call this sample the 3NB (NeighBours) sample.
2.3. Selection of candidates of the Psc-Eri stream
Due to the huge extent in space of the Psc-Eri stream, even stars with fewer than three neighbours in 5D-phase space coordinates may have been members of the stream in the past, but are now indistinguishable from field stars, and their possible membership cannot be proven by kinematic arguments. Moreover, former members may now have velocities that are significantly different to the expected velocities of current stream members. This also makes it difficult to distinguish them from field stars.
The left panel of Fig. 1 shows the distribution of the 2162 stars (3NB sample) in the ΔV∥, ΔV⊥-plane, selected as probable stream candidates in the previous section. The loci of the velocities of the stars belonging to the Psc-Eri stream is expected to be close to the origin, and, in fact we find a significant concentration of stars towards the centre of the plot. Taking velocity scattering of probable members from Meingast et al. (2019) into consideration, we restricted our sample to stars whose observed and predicted tangential velocities differ by less than 2.5 km s−1. This cut reduces the sample to 1584 stars (2.5 km s−1 cut in Fig. 1, shown as yellow dots).
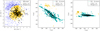 |
Fig. 1. Left panel: distribution of Psc-Eri stars from the 3NB sample (see Sect. 2.2) shown as blue dots in the tangential velocity plane ΔV∥, ΔV⊥ and see text for further explanation). The yellow dots represent a subset of the 3NB sample within a radius of 2.5 km s−1 around the origin. The Meingast et al. (2019) stars found in our 3NB sample are marked by black dots. Middle and right panels: distribution of stream candidates in the Y, X plane and the X, Z plane. The cyan dots show the final sample of the Psc-Eri stream. The yellow and black dots represent the same data as in the left panel. |
In the middle and right panels of Fig. 1, we show the spatial distribution of these stars in the Y, X plane and in the X, Z plane, respectively. Although somehow fragmented, the over-density representing the Psc-Eri stream dominates the picture and it is clearly separated in space from other groups in the Y, X plane. There are no canonical rules of how to extract “physical” members of a gravitationally unbound structure, and therefore we are aware that a certain ambiguity is prevailing when selecting members of such a stream. Anyway, it seems natural to assume a higher membership probability for those sub-structures that are coherent or in the vicinity of the main stream body. We used TOPCAT4 (Taylor et al. 2005) to isolate the stars belonging to the Psc-Eri stream out of the 1584 co-moving stars. A manual cut in the Y, X plane alone yielded a number of 1387 probable members (marked as cyan dots in the middle panel of Fig. 1) of the Psc-Eri stream. It turned out that these form a more or less coherent structure also in 3D space.
By summing up pcont of these 1387 stars we estimated the internal contamination of the sample by 37 field stars (or 2.7%) where 34 of them come from the 276 stars with three neighbours alone. From the point of view of Poisson statistics, the contribution to contamination by stars with four or more neighbours can practically be neglected in our case.
These values hold only for the contamination within the 5D approach. An additional contamination may come from the fact that we did not and could not consider radial velocities for estimating membership, since radial velocity data are missing for the majority of stars in our sample. Nevertheless, for 239 of 1387 stars, radial velocities (RVobs) are available in Gaia DR2 with an accuracy σRVobs better than 5 km s−1. Only 18 of them (7.5%) have radial velocities inconsistent with the radial velocity predicted (RVpred) for the Psc-Eri stream, which means that ∣RVobs − RVpred ∣ > 2.5 km s−1 + 2σRVobs. By combining these two kinds of contaminations, we expect a total contamination between about 100 and 150 stars (or 7–11 per cent) for our final sample.
At this stage, it is also appropriate to note that the sample includes those stars that fit all the requirements we described above. Taking into account the huge size of the stream and velocity variations of its members, the sample is certainly not complete, especially due to isolated members. Relaxing the criteria may increase the number of stream candidates, but the degree of field contamination will be increased, too. Therefore, we consider our sample as a compromise, which presents, however, a basis for studies on the Psc-Eri stream. To adopt a name for this final sample of 1387 stars, we simply call it Psc-Eri hereafter. The list of these stars is given in Table A.1.
2.4. Comparison with the Meingast et al. (2019) membership list
One would expect all the candidates from Meingast et al. (2019) to be included in our sample of 42 733 stars. In fact, from their 256 stars, we find only 232 (90.6%). As Meingast et al. (2019) mentioned in their Sect. 2, they relaxed their selection criteria for astrometric and photometric quality. In fact, all 24 of these stars are missing in our 2.4 mas catalogue (see Sect. 2). We note that this does not exclude these stars as Psc-Eri members, because improved astrometric and photometric accuracy in future Gaia releases may prove their membership. Another 66 Meingast stars did not make it into our basic sample of the Psc-Eri stream, mainly because they have fewer than three neighbours, and a few are off by more than 2.5 km s−1 in the tangential velocity plane. Again, this does not mean that these stars are not physical members, but we cannot rule out that they are field stars. We note that we did not find 42 Cet A -the object crucial for age determination in Meingast et al. (2019)- among our member list, because it failed to meet the strict criteria for astrometric and photometric quality.
2.5. Comparison with the Curtis et al. (2019) membership list
Curtis et al. (2019) added a total of 34 stars to the Meingast et al. (2019) sample. They searched for candidate members, more massive than those of Meingast, via two different approaches. Firstly, they selected candidates from Gaia DR2 within 5 km s−1 of the median value of the space velocity of the Meingast et al. (2019) members and within 20 pc of at least one member. For this, they used radial velocities found in SIMBAD (Wenger et al. 2000). Secondly, they included stars within a 10 pc volume around a Meingast star that were co-moving, in accordance with the proper motion criterion δ(μ) < 2 mas y−1. This search yielded 34 stars. Out of these 34 high-mass member candidates, 32 are in our sample of 42,733. The two exceptions are HD 218242 (G = 5.631) and HD 27467 (G = 8.999), which did not even survive the astrometric and photometric quality check. Out of the 32, only 15 made it into the basic sample of the Psc-Eri stream. The others failed our selection criteria similar to the 66 Meingast stars. On the other hand, we identified 33 new candidate members brighter than MG = 2.5 mag that are not in Curtis et al. (2019).
3. Properties of the Psc-Eri stream
Before starting the discussion on the astrophysical properties of Psc-Eri, we summarise what is known so far regarding the age of the stream. Using the CAMD of stream members, Meingast et al. (2019) obtained an age of about 1 Gyr for Psc-Eri. To identify the members, they used the Gaia DR2 data for stars with radial velocities measured by the Gaia radial velocity spectrometer (Cropper et al. 2018). These stars cover a relatively short part of the CAMD (2.2 < MG < 8.7) and do not show a clear turn-off point that would provide a reliable age estimation. The only star that supports an age of 1 Gyr is the sub-giant 42 Cet A. As part of a triple system, this star turns out to be problematic for Gaia, because it does not pass the astrometric and photometric quality checks.
Curtis et al. (2019) recently reported the age estimation of Psc-Eri based on rotation period measurements by TESS (Ricker et al. 2015). They found that the Psc-Eri stream is coeval with the Pleiades cluster, which is the benchmark for an ≈130-Myr old population of Galactic disk stars. Adding 34 new brighter candidates to the Meingast stars in the CAMD, Curtis et al. (2019) found that this sequence is best fitted by a 130 Myr solar-metallicity isochrone. So, both independent approaches consolidate their finding of ≈120 Myr for the age of the Psc-Eri stream.
Given the same young age, but apparently a very different visual appearance, the Pleiades and Psc-Eri provide an opportunity to compare their properties and to find out what makes them similar or distinct.
3.1. The Pleiades sample
To make a comparison as fair as possible, we selected Pleiades members using the same method we applied to identify the Psc-Eri stream in Sect. 2.2 above, with only one exception. With it being a compact open cluster, Pleiades’ members follow a nearly constant space motion. Therefore, we could assume a common velocity of
 (5)
(5)
and return to the classical CP-approach. These mean values are based on the velocity data in the membership list of Gaia Collaboration (2018a). We chose the same selection parameters as for the Psc-Eri stream and obtained 1245 stars within a spatial cut made at two tidal radii (i.e. 23 pc, derived in Sect. 3.3) from the centre. The list of these stars is given in Table A.2. Due to a high concentration in space and velocity, the Pleiades sample is practically not contaminated by field stars. A probable contamination due to missing information on radial velocities is of the order of 30 field stars among our 1245 Pleiades members. This corresponds to 2.4%.
In Fig. 2, we show the locations of the Pleiades and the Psc-Eri stream in the X, Y (left panel) and the Y, Z plane (right panel). It is amazing that, at the present epoch, these two different stellar ensembles are so close together in space.
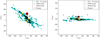 |
Fig. 2. Psc-Eri stream (cyan dots) and the Pleiades (red dots) in the Y, X plane (left) and the Y, Z plane (right). The black and yellow dots indicate dense areas of the stream represented by stars with at least 10 and 30 neighbours, respectively (see Sect. 3.4). |
3.2. Colour-absolute magnitude diagram and age
In Fig. 3, we show the CAMD MG versus G − GRP of the 1387 stars of Psc-Eri (cyan dots) and the 1245 stars of the Pleiades (red dots). The Pleiades sequence is shifted by −5 mag along the MG-axis for better visualisation. We also display a PARSEC (version 1.2S) isochrone (Chen et al. 2014) with Z = 0.02 and log t = 8.1. For the Pleiades, we took into account a reddening of E(B − V) = 0.045 mag (Gaia Collaboration 2018a). Since the Psc-Eri stream spreads out over a wide section of space, the assumption of a unique reddening is not fully appropriate for the Psc-Eri sample. Nevertheless, even without any correction for reddening the isochrone gives a reasonable fit to the observations over a wide range of G − GRP. An exception to this is a part concerning the low-mass stars redder than about G − GRP = 1.1 mag. However, this discrepancy is valid for both Psc-Eri and the Pleiades, and this is probably a calibration problem of the observations and/or isochrones. In the Pleiades, we found one white dwarf (WD) within two tidal radii from the centre, the well known EGGR 25. Within the Psc-Eri stream, we could identify three WDs as probable candidate members, KUV 03520+0500 and SDSS J221945.40+032433.7, known as WDs in SIMBAD, as well as Gaia DR2 2992020285939176704, which is mentioned as a WD candidate in Gentile Fusillo et al. (2019).
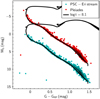 |
Fig. 3. CAMD MG vs. G − GRP of the 1387 stars of Psc-Eri (cyan dots) and of the 1245 stars of the Pleiades (red dots). The Pleiades sequence is shifted by −5 mag along the MG-axis for better visualisation. The black curves are PARSEC (version 1.2S) isochrones (Chen et al. 2014) with Z = 0.02 and log t = 8.1. |
While the Pleiades are a self-gravitationally bound open cluster, and the Psc-Eri stream is an unbound moving group, the similarity over the whole range of magnitudes of the CAMDs of the two stellar groups is striking. The CAMDs of the Pleiades and Psc-Eri are consistent with an age between log t = 8.0 (100 Myr) and log t = 8.2 (150 Myr). Unfortunately, Gaia DR2 does not provide reliable data for stars brighter than G ≈ 6 mag, which could help to narrow the age range from Gaia observations alone. In any case, our results support the finding of a young age for the Psc-Eri based on the rotation ages from TESS (Curtis et al. 2019).
3.3. Luminosity functions and mass functions
The LFs of the Pleiades and Psc-Eri are shown in Fig. 4 (left panel). As mentioned before, Gaia DR2 is lacking in good photometric data for the apparently brightest stars. Therefore, both LFs may be incomplete at the bright end. For the Pleiades, one can check the completeness by comparing it with well-established Pleiades membership lists based on HIPPARCOS, for instance with the one used by van Leeuwen (2009). We found that our Pleiades sample lacked 10 HIPPARCOS stars absolutely brighter than MV = 2.0 mag. Similarly, in Psc-Eri comparably bright stars may also be missing.
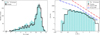 |
Fig. 4. Left panel: LF of Psc-Eri stream (cyan) and of the Pleiades (black steps). Right panel: PDMF of the same groups, Psc-Eri stream (semi-filled cyan bars), Pleiades (black step function). The black line shows a power-law MF with a slope of −2.15 fitted to the Psc-Eri PDMF for a mass range between 1 and 2.5 M⊙, and a slope of −0.73 in the mass range 0.3–1.0 M⊙. The dashed red line shows an IMF with the Salpeter slope of −2.35, whereas the dashed blue line is the IMF from Kroupa (2001). |
Given the slightly larger total number of the Psc-Eri members, we observe a slightly higher level in the LF for stars brighter than about MG = 11 mag. Beyond that magnitude, the Pleiades are apparently more highly populated. This is a simple consequence of the effective limiting magnitude G ≈ 18 mag of our 2.4 mas catalogue: the Psc-Eri stream extends up to 380 pc from the Sun, whereas the bulk of the Pleiades stars are located between 130 and 140 pc. The corresponding limiting absolute magnitudes are MG ≈ 12.4 mag for the Pleiades, MG ≈ 13.5 mag and 10.1 mag for the Psc-Eri stream at 80 pc and 380 pc, respectively. Nevertheless, the LFs of both stellar samples are essentially identical over a large range of absolute magnitudes.
While the LF of a stellar population is based on astrometric and photometric observations alone, a theoretical mass-luminosity relation is required to obtain masses. For Psc-Eri, as well as for the Pleiades, we used the PARSEC (version 1.2S) isochrone (Chen et al. 2014) with Z = 0.02 and log t = 8.1 shown in Fig. 3. We derived system masses of the stars via a mass-luminosity relation in all three Gaia photometric bands, neglecting binary issues. Again, the limiting magnitude of G ≈ 18 mag yields lower mass limits of about 0.16 M⊙ for the Pleiades, as well as 0.11 M⊙ at 80 pc and 0.4 M⊙ at 380 pc for Psc-Eri.
To derive the mass of the Pleiades we determined the Jacobi (or tidal) radius rJ of the cluster as described in Röser & Schilbach (2019). Adding up the individual masses of the members from the centre outwards, and considering about 30 M⊙ from the missing 10 absolutely bright stars, we found rJ = 11.5 pc. Within rJ, 1038 stars give a tidal mass MJ = 588 M⊙ for the Pleiades. Following the notation in Shukirgaliyev et al. (2018), the mass enclosed within rJ is the bound mass. Younger clusters are surrounded by an envelope of unbound stars (Elson et al. 1987); most of them located beyond one Jacobi radius but still within 2 rJ. According to numerical simulations of the evolution of open clusters (Shukirgaliyev et al. 2018), such envelopes persist for many mega years. We found such an envelope in the Pleiades containing more than 200 stars with a total mass of about 100 M⊙. We chose the following definition: the mass contained within two Jacobi radii is called the “total” mass of a cluster. Hence, the total mass of the Pleiades is 690 M⊙ in 1245 stars, where 85% of the mass is within one Jacobi radius, and 15% within 1 and 2 rJ.
Adding up all the individual masses of the stars in the Psc-Eri stream, we obtained 771 M⊙. Needless to say, the Psc-Eri stream is unbound, since the tidal radius for 771 M⊙ would only be 12.6 pc. About 80% of the total mass of the stream is concentrated within 175 pc from the centre (i.e. in the inner half), while the outer half contains only 20%. Even if there were co-moving stars outside 350 pc from the centre, they would probably not contribute much to the present-day mass of the Psc-Eri stream.
Based on the individual (system) masses, we show the mass functions ζ(m) of Psc-Eri and the Pleiades in Fig. 4 (right panel), where ζ(m) dm gives the total number of stars in the mass range between m and m + dm. In a comparison of both mass functions, we disregard the part for masses larger than about 2.5 M⊙ where we already noted incompleteness in both samples. At the low-mass end of the Psc-Eri mass function, we find a few stars in the first two bins, nicely coinciding with the expected limit of 0.11 M⊙ for the members closest to the Sun. Also, the observed PDMF of the Pleiades strictly adheres to its expected low-mass limit of 0.16 M⊙. The mass functions of both aggregations can be well described by two power laws; one between 0.3 and 1.0 M⊙, and another between 1.0 and 2.5 M⊙. In the latter mass range, the slope of the mass function of the Pleiades is −2.41, that of the Psc-Eri stream slightly shallower with an exponent of −2.15. Both slopes are close to the Salpeter slope (Salpeter 1955) of −2.35. In the mass range between 0.3 and 1.0 M⊙, both mass functions are remarkably flat, with exponents of −0.77 (Pleiades) and −0.73 (Psc-Eri). Since these slopes are larger than −1, lower mass stars contribute less than higher mass stars to the total mass of the stream, respectively of the cluster. Assuming the slopes of the PDMFs (−0.77, resp. −0.73) remain constant down to 0.1 M⊙, we estimated the missing masses in both aggregations due to incompleteness at the low-mass end. We found 125 M⊙ for the Pleiades and 140 M⊙ for the Psc-Eri stream. This corresponds to 18% in both cases.
In Fig. 4 (right panel), we also show the initial mass function (IMF) from Kroupa (2001) with slopes of −2.35 for m ≥ 0.5 M⊙ and −1.3 for m ≤ 0.5 M⊙. The PDMFs of Psc-Eri and of the Pleiades are much flatter than the Kroupa IMF in the mass range between 0.4 and 1.0 M⊙, where both our samples are complete. Consequently, if the IMF of Psc-Eri and of the Pleiades followed a Kroupa IMF (Kroupa 2001), then both aggregations must have lost the majority of their stars in this mass range.
While so far there is no other determination of the PDMF of Psc-Eri in this large mass interval to compare with, there has been work on the Pleiades membership determination based on Gaia DR2. This comparison is of interest to confirm the shallow shape of the PDMF in the range between 0.3 and 1.0 M⊙. We compared our Pleiades PDMF from Fig. 4 (right panel) with those derived from the Pleiades membership lists in Gaia Collaboration (2018a) with 1326 stars, and Lodieu et al. (2019) with 2281 stars. We determined system masses for the Pleiades members of these two samples via the same procedure described above. This comparison is presented in Fig. 5. The Pleiades PDMF from our paper is shown as the black step function, the one from Gaia Collaboration (2018a) as semi-filled green bars, and the PDMF of Lodieu et al. (2019) as dashed semi-filled grey bars. In the range of interest between 0.2 and 2.5 M⊙, all three PDMFs show the same shallow slope, and there is even complete coincidence between the Gaia Collaboration (2018a) PDMF and ours. Discrepancies are only observed outside this mass range and are the result of different quality requirements for the use of Gaia DR2 data. In the case of Gaia Collaboration (2018a), the recommendations given in document GAIA-C3-TN-LU-LL-124-01 (see Sect. 2) were not yet available when they made their analysis. The Lodieu et al. (2019) sample contains an excess of about 600 stars, mostly less massive than 0.2 M⊙, which are not present in the other two samples. It turned out that 481 stars of these are not contained in our 2.4 mas catalogue, which means that these stars have Gaia DR2 measurements of poorer quality.
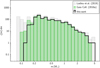 |
Fig. 5. PDMFs of Pleiades based on recent membership determinations on the basis of Gaia DR2. The PDMF of Gaia Collaboration (2018a) is shown as semi-filled green bars, that from Lodieu et al. (2019) as semi-filled grey bars, the PDMF from this paper is represented by the black step function. |
As a summary of this section, we point out that the Psc-Eri stream and the Pleiades agree in their total number of stars and their total masses, as well as in their LFs and PDMFs (Fig. 4). They are also of the same age (Fig. 3). However, in their physical appearance, they are completely different (see Fig. 2). This means that Psc-Eri and the Pleiades must have undergone a completely different formation and/or evolution scenario in the last 130 Myr. This was also presumed by Curtis et al. (2019) when they found that the age Psc-Eri stream is 130 Myr rather than 1 Gyr old as gauged by Meingast et al. (2019).
3.4. Structure and kinematics
The drastic difference in spatial structure is highly evident when comparing the Psc-Eri stream with the Pleiades. Whereas Pleiades members are strongly concentrated within a radius of about 10 pc around the cluster centre and are gravitationally bound, the Psc-Eri stars are spread over a huge area of a nearly cylindrical shape with length and thickness of at least 700 pc and 100 pc, respectively. Moreover, the latter show a patchy distribution with more or less dense regions (see also Meingast et al. 2019). In Fig. 2, we indicate these dense regions of the stream in black. They include stream members with at least 10 neighbours in 5D-phase space (10NB sample, cf. Sect. 2.2). We also revealed three rather dense clumps (30NB sample, yellow dots in Fig. 2), containing stars with more than 30 neighbours. But even in these clumps, the star density is lower than in the Pleiades by a factor of at least 25. Although the 2D-velocity dispersion of stars in the clumps is rather small (from 0.23 km s−1 to 0.36 km s−1), the mass density within the clumps is not sufficient for stars to be gravitationally bound. We list these clumps as A, B, and C in Table 1.
Meingast et al. (2019) also identified four over-densities in their sample. The clumps A, B, and C correspond to the over-densities 1, 3, and 4 in Meingast et al. (2019). The over-density 2 in Meingast et al. (2019) is not represented as a peaked clump in the 30 NB sample, but shows up as a wide (black) hump in our 10 NB sample, with maximum density at X = −52 pc, Y = 13 pc, Z = −108 pc in Fig. 2.
Curiously, at the present epoch, the Pleiades (red dots in Fig. 2) are located in the vicinity of the Psc-Eri stream. This, however, does not mean that both have been formed in neighbouring molecular clouds, since we measure rather different space velocities for them. Notably, the Vc-components of both samples differ by some 25 km s−1.
In Sect. 2.1, we already noted correlations between spatial coordinates and velocity components in the Psc-Eri stream. In Fig. 6, we show the velocities U, V versus the respective coordinates X, Y based on 205 stars with measurement errors in radial velocity σ(Vrad) < 2.5 km s−1. Among them, 12 stars show discordant radial velocities (outliers). A linear fit between coordinates and velocities delivers slopes of 0.037 in X (correlation +0.85), 0.0075 in Y (correlation +0.4). The formal errors of the slopes are 10−6. Both slopes are significantly positive in the X and Y directions, which indicates expansion. The expansion times are 27 Myr and 133 Myr in X and Y directions, respectively.
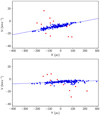 |
Fig. 6. Galactic Cartesian velocities U, V versus coordinates X, Y (from top to bottom) for 205 stars in the Psc-Eri stream with radial velocities Vrad that have σ(Vrad) better than 2.5 km s−1. Blue dots are stars included in the regression analysis, 12 outliers are marked in red. The regression lines are shown in blue. |
The expansion time in the Y direction (i.e. direction of Galactic rotation) is remarkably consistent with the age of the Psc-Eri stream found in Sect. 3.2. It is a shear motion similar to that of the tidal tails in the case of the Hyades (Röser et al. 2019) or Praesepe (Röser & Schilbach 2019), which are caused by the Galactic gravitational field.
The vertical velocity W of stars perpendicular to the Galactic mid-plane is detached from the motion in the plane and is known to be well described by a harmonic oscillator with restoring force. The respective equations are:
 (6)
(6)
where ZM is the vertical distance from the Galactic mid-plane, WM is the vertical velocity with respect to the local standard of rest, and ν is the oscillation frequency. For ν, we adopted ν = 74 km s−1 kpc−1 from Fuchs et al. (2006), which was based on the local mass density of 0.1 M⊙ pc−3 from Holmberg & Flynn (2000). The corresponding oscillation period is 84.9 Myr.
For t = 0, we chose the moment of the crossing of the Galactic mid-plane, which means ZM(0) = 0. By combining both equations from Eq. (6), we find
 (7)
(7)
The present day vertical distance from the Galactic mid-plane is ZM(t) = Zc + Z⊙, where Z⊙ = 22 pc is the distance of the Sun from the mid-plane (Kharchenko et al. 2009), hence ZM(t) = −78.1 pc. The vertical velocity is WM(t) = Wc + W⊙ with W⊙ = +7.23 km s−1 (Kharchenko et al. 2009), hence W(t) = −11.1 km s−1. Based on these values, we get WM(0) = −12.5 km s−1 and as the maximum height above or below the Galactic mid-plane |ZM, max|= ± 169 pc. The last passage through the Galactic mid-plane occurred 6.5 Myr ago, earlier passages took place 49, 91, 134, and 176 Myr (and so on) before the present day.
It is generally accepted that star formation takes place in regions close to the Galactic mid-plane. As we know from Sect. 3.2, the Psc-Eri stream has a formation age window between log t = 8.0 (100 Myr) and 8.2 (158 Myr) before the present day. If we assume that star formation took place at mid-plane passage, an age of 134 Myr fits best to the age window from the isochrones. Allowing star formation to occur within ±80 pc around the mid-plane, the age of the Psc-Eri stream is 134 ± 6.5 Myr.
For the Pleiades (which are presently also below the Galactic mid-plane), we found the latest mid-plane crossing time to be −4.5 Myr. Hence, the Pleiades passed the mid-plane only 2 Myr later than Psc-Eri. Given the oscillation period of 84.9 Myr, both aggregations swing almost in phase.
4. Origin and evolution
From the findings in the previous section, we conclude that the Psc-Eri stream is a coherent young stellar aggregation of about 1400 stars moving together and with a total mass of some 770 M⊙. From this, we expect a common origin of the stars in the same molecular cloud. With respect to total mass and age, Psc-Eri is similar to the open cluster Pleiades, yet they are completely different in their spatial structure. While the Pleiades are a self-gravitationally bound, compact open cluster, the Psc-Eri stream is a huge, gravitationally unbound, bar-like structure. The question arises: why did these two stellar ensembles have such a different fate?
In the past decade, many numerical N-body simulations have been performed with the aim of emulating the evolution of open clusters. Details can be found, for example in Shukirgaliyev et al. (2018), where an overview of recent developments in this field is given. Below, we only pick up a few aspects of these simulations which can help to answer the aforementioned question.
Star clusters are believed to form during the collapse of giant molecular clouds (see e.g. Krumholz et al. 2019). When the first very massive stars (m > 8 M⊙) formed and evolved, their stellar winds expelled the molecular gas from the surroundings of the other newly formed stars, and star formation stops.
Shukirgaliyev et al. (2017) showed that the star formation efficiency (SFE) in the parental molecular cloud plays a decisive role for the future evolution of the newly formed group of stars. They found that an SFE of at least 15 percent is needed for a newly born group to survive for more than 100 Myr as a gravitationally bound cluster. Such a value for the SFE has been observed in dense clumps of molecular clouds (Lada & Lada 2003; Higuchi et al. 2009). A differing SFE may be a first explanation for the different evolution of Psc-Eri and the Pleiades. In the primordial cloud of Psc-Eri, the SFE may have been smaller than 0.15, in that of the Pleiades larger than 0.15, which means the parental cloud of Psc-Eri had a higher mass than that of the Pleiades.
But different values of the SFE may not be the only reason for different development. In a number of numerical N-body simulations Shukirgaliyev et al. (2018) investigated how the stellar mass distribution at the end of molecular gas expulsion influences the later fate of a star cluster. They showed the results for two different stochastic realisations of the same initial conditions. In one case, high-mass stars were randomly more concentrated to the centre than in the other. In the first case, the lifetime as a cluster was longer than in the latter case. In other words, the degree of primordial mass segregation is an important factor for the future development. These simulations (Shukirgaliyev et al. 2018) were carried out for high-mass clusters (>3000 M⊙). The lesson from these numerical experiments is: even with starting conditions describing a high-mass cluster, the initial distribution of high-mass stars in the cluster plays an important role in its further evolution. This is even more significant for lower mass cases such as Psc-Eri and the Pleiades. So, it could well be that the different evolutionary history of the Pleiades and Psc-Eri was determined by the primordial distribution of high-mass stars, meaning Psc-Eri had a lower value of mass segregation than the Pleiades had. It would be worthwhile to carry out N-body experiments for lower mass cases to actually test our conclusions.
5. Summary
We used a modified 5D convergent-point approach to search for hitherto unrevealed members of the Psc-Eri stellar stream detected by Meingast et al. (2019). Based on Gaia DR2, we found 1387 co-moving members in a G magnitude range from 5.1 mag to G = 19.3 mag. The stars of the stream are spread over a huge area of nearly cylindrical shape with length and thickness of at least 700 pc and 100 pc, respectively. The distance of the stars in the stream varies between 80 pc and 380 pc from the Sun. Depending on the distance, the faint completeness limit is found to range from MG = 13.5 mag to 10.1 mag. The Psc-Eri stream has a patchy structure with clumps of higher space density of up to 40 stars within a sphere of 10 pc radius. Even in these regions, stars are gravitationally unbound, as is the stream as a whole. The stream is presently 78 pc below the Galactic mid-plane, and will reach a maximum distance from the mid-plane of about 170 pc.
The loci of the Psc-Eri members in the G vs. (G − GRP) CAMD are consistent with PARSEC (version 1.2S) solar metallicity isochrones (Chen et al. 2014) for ages between 100 (log t = 8.0) and 158 Myr (log t = 8.2). The absence of absolutely bright stars does not allow to narrow this time window. An independent age indicator is provided by the oscillation period of the stream perpendicular to the Galactic mid-plane. We found a value of 134 ± 6.5 Myr as the age most compatible with the isochronic age.
The stream is expanding both in the direction of Galactic rotation Y, as well as in the direction towards the Galactic centre X, the corresponding expansion timescales are 133 Myr and 27 Myr. Again, the expansion time in the Y direction is in agreement with the age of the cluster. Another independent age estimate was already obtained by Curtis et al. (2019), who derived an age of about 120 Myr from stellar rotation-period measurements with TESS, using a comparison of the locations of Psc-Eri stars and Pleiades stars in the rotation period–effective temperature diagram.
Indeed, we found that the Psc-Eri stream and the Pleiades cluster are very similar in terms of many astrophysical characteristics, not only with regard to their age. Both stellar aggregations follow the same LF in MG, hence the same PDMF. The PDMF ζ(m) between 0.3 and 2.5 M⊙ is well represented by a broken power law ζ(m)∝m−α with α = 2.15 for masses between 1.0 and 2.5 M⊙ and α = 0.73 for masses between 0.3 and 1.0 M⊙ for Psc-Eri. The corresponding exponents for the Pleiades are 2.41 and 0.77, respectively. While both mass functions for masses higher than 1 M⊙ almost follow a Salpeter law with α = 2.35, they are very shallow and even top heavy below 1 M⊙. If their IMFs had a shape as in Salpeter (1955) or Kroupa (2001), the shallow slopes of their PDMFs would indicate high mass loss in the regime of low-mass stars. The total mass of the 1387 members of the Psc-Eri stream adds up to 771 M⊙. That is very similar to the total mass of the Pleiades within two Jacobi radii of 690 M⊙ in 1245 stars. At its age of 134 Myr, the stream hosts three white dwarfs.
Although the Pleiades and the Psc-Eri stream resemble each other in terms of many astrophysical properties, their shapes are completely different. Curiously enough, at present, the minimum distance between the Pleiades and Psc-Eri is only 80 pc. As their space velocities differ by about 25 km s−1, they were much farther away from each other in the past and formed in two different molecular clouds. The results of numerical N-body simulations recently carried out by Shukirgaliyev et al. (2017, 2018) suggest two different possibilities to explain the different fates of Psc-Eri and the Pleiades: the SFE in the Psc-Eri parental cloud was lower than in that of the Pleiades, or -given the same SFE- mass segregation after gas expulsion in both groups was higher in the Pleiades than was in Psc-Eri.
We would like to point out a paper on membership determination of Psc-Eri by Ratzenböck et al. (2020). This paper appeared in arXiv after we had submitted ours to A&A.
Acknowledgments
It is a pleasure to thank Drs. P. Berczik, A. Just and G. Parmentier of ZAH, University of Heidelberg, for helpful discussions, especially on the evolution of Galactic star clusters. This research has made use of the SIMBAD database and the VizieR catalogue access tool, operated at CDS, Strasbourg, France. This work has made use of data from the European Space Agency (ESA) mission Gaia (https://www.cosmos.esa.int/gaia), processed by the Gaia Data Processing and Analysis Consortium (DPAC, https://www.cosmos.esa.int/web/gaia/dpac/consortium). Funding for the DPAC has been provided by national institutions, in particular the institutions participating in the Gaia Multilateral Agreement.
References
- Chen, Y., Girardi, L., Bressan, A., et al. 2014, MNRAS, 444, 2525 [NASA ADS] [CrossRef] [Google Scholar]
- Cropper, M., Katz, D., Sartoretti, P., et al. 2018, A&A, 616, A5 [NASA ADS] [CrossRef] [EDP Sciences] [Google Scholar]
- Curtis, J. L., Agüeros, M. A., Mamajek, E. E., Wright, J. T., & Cummings, J. D. 2019, AJ, 158, 77 [NASA ADS] [CrossRef] [Google Scholar]
- Elson, R. A. W., Fall, S. M., & Freeman, K. C. 1987, ApJ, 323, 54 [NASA ADS] [CrossRef] [Google Scholar]
- Fuchs, B., Breitschwerdt, D., de Avillez, M. A., Dettbarn, C., & Flynn, C. 2006, MNRAS, 373, 993 [NASA ADS] [CrossRef] [Google Scholar]
- Gaia Collaboration (Babusiaux, C., et al.) 2018a, A&A, 616, A10 [NASA ADS] [CrossRef] [EDP Sciences] [Google Scholar]
- Gaia Collaboration (Brown, A. G. A., et al.) 2018b, A&A, 616, A1 [NASA ADS] [CrossRef] [EDP Sciences] [Google Scholar]
- Gentile Fusillo, N. P., Tremblay, P.-E., Gänsicke, B. T., et al. 2019, MNRAS, 482, 4570 [NASA ADS] [CrossRef] [Google Scholar]
- Higuchi, A. E., Kurono, Y., Saito, M., & Kawabe, R. 2009, ApJ, 705, 468 [NASA ADS] [CrossRef] [Google Scholar]
- Holmberg, J., & Flynn, C. 2000, MNRAS, 313, 209 [NASA ADS] [CrossRef] [Google Scholar]
- Katz, D., Sartoretti, P., Cropper, M., et al. 2019, A&A, 622, A205 [NASA ADS] [CrossRef] [EDP Sciences] [Google Scholar]
- Kharchenko, N. V., Berczik, P., Petrov, M. I., et al. 2009, A&A, 495, 807 [NASA ADS] [CrossRef] [EDP Sciences] [Google Scholar]
- Kroupa, P. 2001, MNRAS, 322, 231 [NASA ADS] [CrossRef] [Google Scholar]
- Krumholz, M. R., McKee, C. F., & Bland -Hawthorn, J. 2019, ARA&A, 57, 227 [NASA ADS] [CrossRef] [Google Scholar]
- Lada, C. J., & Lada, E. A. 2003, ARA&A, 41, 57 [NASA ADS] [CrossRef] [Google Scholar]
- Lindegren, L., Hernández, J., Bombrun, A., et al. 2018, A&A, 616, A2 [NASA ADS] [CrossRef] [EDP Sciences] [Google Scholar]
- Lodieu, N., Pérez-Garrido, A., Smart, R. L., & Silvotti, R. 2019, A&A, 628, A66 [NASA ADS] [CrossRef] [EDP Sciences] [Google Scholar]
- Meingast, S., Alves, J., & Fürnkranz, V. 2019, A&A, 622, L13 [NASA ADS] [CrossRef] [EDP Sciences] [Google Scholar]
- Ratzenböck, S., Meingast, S., Alves, J., Möller, T., & Bomze, I. 2020, A&A, in press, https://doi.org/10.1051/0004-6361/202037591 [Google Scholar]
- Ricker, G. R., Winn, J. N., Vanderspek, R., et al. 2015, J. Astron. Telesc. Instrum. Syst., 1, 014003 [NASA ADS] [CrossRef] [Google Scholar]
- Röser, S., & Schilbach, E. 2019, A&A, 627, A4 [NASA ADS] [CrossRef] [EDP Sciences] [Google Scholar]
- Röser, S., Schilbach, E., & Goldman, B. 2019, A&A, 621, L2 [NASA ADS] [CrossRef] [EDP Sciences] [Google Scholar]
- Salpeter, E. E. 1955, ApJ, 121, 161 [Google Scholar]
- Shukirgaliyev, B., Parmentier, G., Berczik, P., & Just, A. 2017, A&A, 605, A119 [NASA ADS] [CrossRef] [EDP Sciences] [Google Scholar]
- Shukirgaliyev, B., Parmentier, G., Just, A., & Berczik, P. 2018, ApJ, 863, 171 [NASA ADS] [CrossRef] [Google Scholar]
- Taylor, M. B. 2005, in Astronomical Data Analysis Software and Systems XIV, eds. P. Shopbell, M. Britton, & R. Ebert, ASP Conf. Ser., 347, 29 [Google Scholar]
- van Leeuwen, F. 2009, A&A, 497, 209 [NASA ADS] [CrossRef] [EDP Sciences] [Google Scholar]
- Wenger, M., Ochsenbein, F., Egret, D., et al. 2000, A&AS, 143, 9 [NASA ADS] [CrossRef] [EDP Sciences] [Google Scholar]
Appendix A: Additional tables
First ten stars of our 1387 Psc-Eri stream members.
First ten stars of our 1245 Pleiades members.
All Tables
All Figures
|
Fig. 1. Left panel: distribution of Psc-Eri stars from the 3NB sample (see Sect. 2.2) shown as blue dots in the tangential velocity plane ΔV∥, ΔV⊥ and see text for further explanation). The yellow dots represent a subset of the 3NB sample within a radius of 2.5 km s−1 around the origin. The Meingast et al. (2019) stars found in our 3NB sample are marked by black dots. Middle and right panels: distribution of stream candidates in the Y, X plane and the X, Z plane. The cyan dots show the final sample of the Psc-Eri stream. The yellow and black dots represent the same data as in the left panel. |
| In the text | |
|
Fig. 2. Psc-Eri stream (cyan dots) and the Pleiades (red dots) in the Y, X plane (left) and the Y, Z plane (right). The black and yellow dots indicate dense areas of the stream represented by stars with at least 10 and 30 neighbours, respectively (see Sect. 3.4). |
| In the text | |
|
Fig. 3. CAMD MG vs. G − GRP of the 1387 stars of Psc-Eri (cyan dots) and of the 1245 stars of the Pleiades (red dots). The Pleiades sequence is shifted by −5 mag along the MG-axis for better visualisation. The black curves are PARSEC (version 1.2S) isochrones (Chen et al. 2014) with Z = 0.02 and log t = 8.1. |
| In the text | |
|
Fig. 4. Left panel: LF of Psc-Eri stream (cyan) and of the Pleiades (black steps). Right panel: PDMF of the same groups, Psc-Eri stream (semi-filled cyan bars), Pleiades (black step function). The black line shows a power-law MF with a slope of −2.15 fitted to the Psc-Eri PDMF for a mass range between 1 and 2.5 M⊙, and a slope of −0.73 in the mass range 0.3–1.0 M⊙. The dashed red line shows an IMF with the Salpeter slope of −2.35, whereas the dashed blue line is the IMF from Kroupa (2001). |
| In the text | |
|
Fig. 5. PDMFs of Pleiades based on recent membership determinations on the basis of Gaia DR2. The PDMF of Gaia Collaboration (2018a) is shown as semi-filled green bars, that from Lodieu et al. (2019) as semi-filled grey bars, the PDMF from this paper is represented by the black step function. |
| In the text | |
|
Fig. 6. Galactic Cartesian velocities U, V versus coordinates X, Y (from top to bottom) for 205 stars in the Psc-Eri stream with radial velocities Vrad that have σ(Vrad) better than 2.5 km s−1. Blue dots are stars included in the regression analysis, 12 outliers are marked in red. The regression lines are shown in blue. |
| In the text | |
Current usage metrics show cumulative count of Article Views (full-text article views including HTML views, PDF and ePub downloads, according to the available data) and Abstracts Views on Vision4Press platform.
Data correspond to usage on the plateform after 2015. The current usage metrics is available 48-96 hours after online publication and is updated daily on week days.
Initial download of the metrics may take a while.