Free Access
Fig. 6.
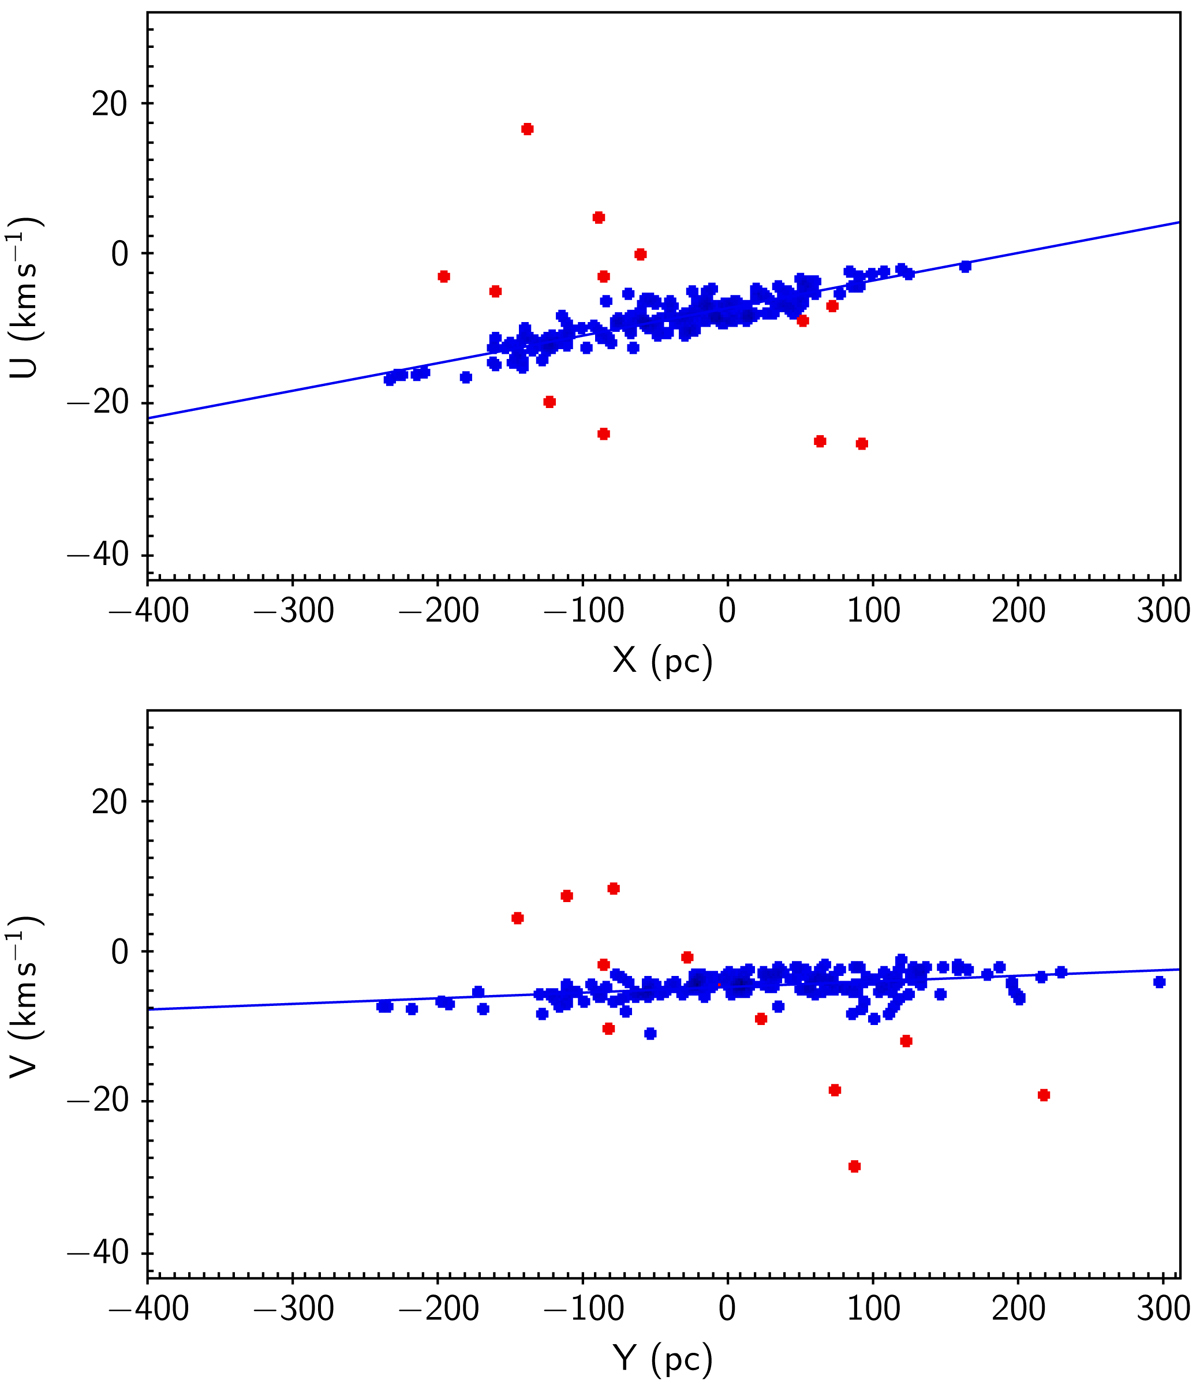
Galactic Cartesian velocities U, V versus coordinates X, Y (from top to bottom) for 205 stars in the Psc-Eri stream with radial velocities Vrad that have σ(Vrad) better than 2.5 km s−1. Blue dots are stars included in the regression analysis, 12 outliers are marked in red. The regression lines are shown in blue.
Current usage metrics show cumulative count of Article Views (full-text article views including HTML views, PDF and ePub downloads, according to the available data) and Abstracts Views on Vision4Press platform.
Data correspond to usage on the plateform after 2015. The current usage metrics is available 48-96 hours after online publication and is updated daily on week days.
Initial download of the metrics may take a while.