Fig. 1.
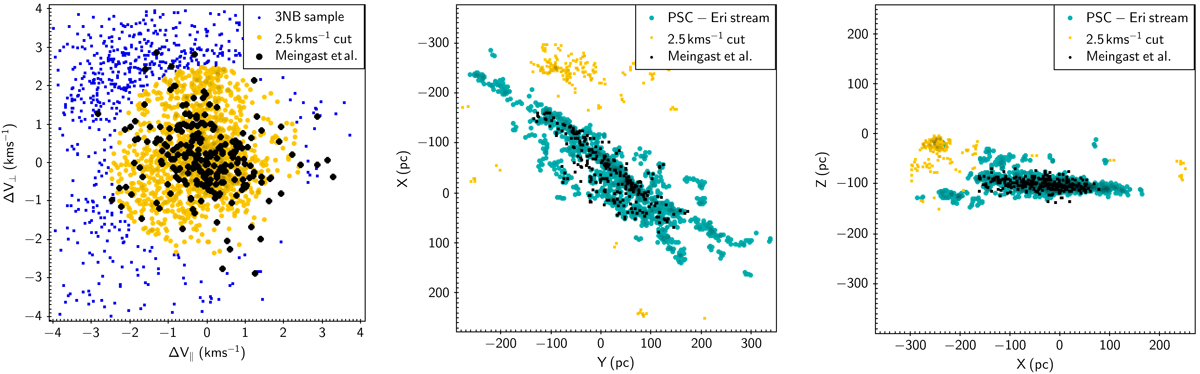
Left panel: distribution of Psc-Eri stars from the 3NB sample (see Sect. 2.2) shown as blue dots in the tangential velocity plane ΔV∥, ΔV⊥ and see text for further explanation). The yellow dots represent a subset of the 3NB sample within a radius of 2.5 km s−1 around the origin. The Meingast et al. (2019) stars found in our 3NB sample are marked by black dots. Middle and right panels: distribution of stream candidates in the Y, X plane and the X, Z plane. The cyan dots show the final sample of the Psc-Eri stream. The yellow and black dots represent the same data as in the left panel.
Current usage metrics show cumulative count of Article Views (full-text article views including HTML views, PDF and ePub downloads, according to the available data) and Abstracts Views on Vision4Press platform.
Data correspond to usage on the plateform after 2015. The current usage metrics is available 48-96 hours after online publication and is updated daily on week days.
Initial download of the metrics may take a while.