Fig. 4.
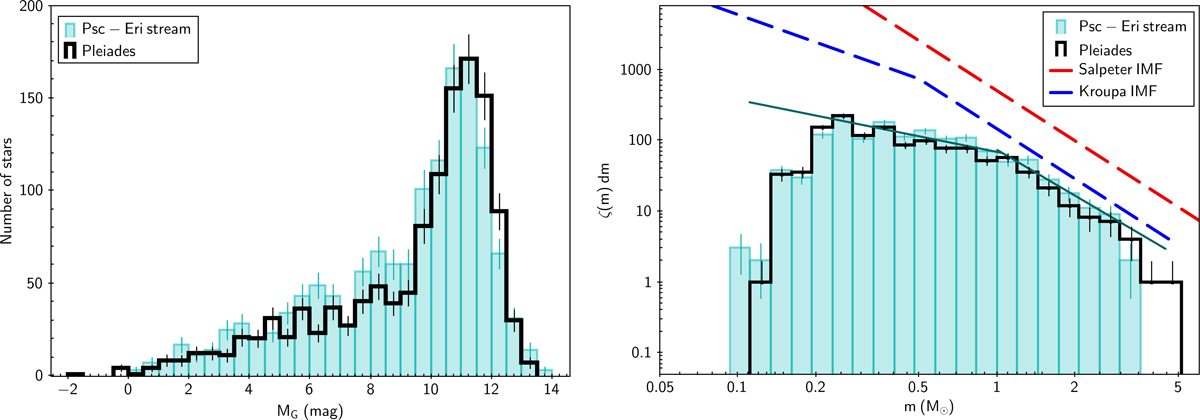
Left panel: LF of Psc-Eri stream (cyan) and of the Pleiades (black steps). Right panel: PDMF of the same groups, Psc-Eri stream (semi-filled cyan bars), Pleiades (black step function). The black line shows a power-law MF with a slope of −2.15 fitted to the Psc-Eri PDMF for a mass range between 1 and 2.5 M⊙, and a slope of −0.73 in the mass range 0.3–1.0 M⊙. The dashed red line shows an IMF with the Salpeter slope of −2.35, whereas the dashed blue line is the IMF from Kroupa (2001).
Current usage metrics show cumulative count of Article Views (full-text article views including HTML views, PDF and ePub downloads, according to the available data) and Abstracts Views on Vision4Press platform.
Data correspond to usage on the plateform after 2015. The current usage metrics is available 48-96 hours after online publication and is updated daily on week days.
Initial download of the metrics may take a while.