| Issue |
A&A
Volume 637, May 2020
|
|
|---|---|---|
| Article Number | A29 | |
| Number of page(s) | 11 | |
| Section | Interstellar and circumstellar matter | |
| DOI | https://doi.org/10.1051/0004-6361/201834077 | |
| Published online | 14 May 2020 | |
Model exploration of near-IR ro-vibrational CO emission as a tracer of inner cavities in protoplanetary disks
1
Kapteyn Astronomical Institute,
Postbus 800,
9700 AV
Groningen,
The Netherlands
2
Astrophysics Research Centre, School of Mathematics and Physics, Queens University Belfast,
Belfast
BT7 1NN,
UK
e-mail: This email address is being protected from spambots. You need JavaScript enabled to view it.
3
Department of Physics, Texas State University,
749 N Comanche Street,
San Marcos,
TX
78666,
USA
4
Lunar and Planetary Laboratory, The University of Arizona,
Tucson
AZ85721,
USA
5
Max-Planck-Institut für extraterrestrische Physisk,
Giessenbachstrasse 1,
85748
Garching,
Germany
6
SUPA, School of Physics & Astronomy, University of St. Andrews,
North Haugh,
St. Andrews
KY16 9SS,
UK
7
Department of Physics, Texas State University, 749 N Comanche Street, San Marcos, TX 78666, USA
Received:
13
August
2018
Accepted:
23
March
2020
Abstract
Context. Near-IR observations of protoplanetary disks provide information about the properties of the inner disk. High-resolution spectra of abundant molecules such as CO can be used to determine the disk structure in the warm inner parts. The v2∕v1 ro-vibrational ratio of v1−0 and v2−1 transitions has recently been observed to follow distinct trends with the CO emitting radius in a sample of TTauri and Herbig disks; these trends have empirically been interpreted as due to depletion of the inner disk from gas and dust.
Aims. We use thermochemical disk models to explore the to interpret the trends of these CO ro-vibrational CO emission.
Methods. We used the radiation thermochemical code ProDiMo to explore a set of previously published models with different disk properties and varying one parameter at a time: the inner radius, the dust-to-gas mass ratio, and the gas mass. In addition, we used models in which we changed the surface density power-law index, and employed a larger set of CO ro-vibrational levels that also include fluorescence from the first electronic state. We investigated these models for TTauri and Herbig star disks. Finally, we included a set of DIANA models for individual TTauri and Herbig disks that were constructed to reproduce a large set of multiwavelength observations.
Results. This modeling exploration highlights promising parameters that may explain the observed trends in ro-vibrational CO emission. Our models with an increasing inner radius match the observed trend for TTauri disks, in which we were also able to account for the vertical spread in the data by different values for the dust-to-gas mass ratio and for the disk gas mass in different disks. Our models instead match the CO vibrational ratio observed in Herbig disks only in the case of large inner holes and cannot produce the low ratios that are measured in many disks. The models do produce an inversion in the trend, where v2−1∕v1−0 increases and does not decrease for CO radii larger than a few au. The reason for this is that the P(4) v2−1 line becomes optically thin and superthermally excited. In our models, this does not require invoking UV fluorescence pumping.
Conclusions. Our modeling explorations suggest that the observed decrease in v2−1∕v1−0 with CO radius in TTauri disks might be a consequence of inside-out disk depletion. For the Herbig disks, a more complex inner disk structure may instead be needed to explain the observed trends in the excitation of CO emission as a function of emitting radius: disk gaps emptied of dust, partially depleted in gas, and/or possibly a disk structure with an inverted surface density profile. These structures need to be further investigated in future work.
Key words: protoplanetary disks / line: profiles / stars: pre-main sequence
© ESO 2020
1 Introduction
Disks around young stars evolve and disperse on timescales of a few million years (e.g., Evans et al. 2003; Hernández et al. 2007; Fedele et al. 2010; Dent et al. 2013). Several processes can drive this evolution, including disk winds, planet formation, dust growth, and migration, and not all disks necessarily undergo the same evolutionary path (e.g., Alexander et al. 2014; Testi et al. 2014). When an exponential decrease with time of the dust mass is assumed (e-folding), the expected disk lifetime is around 2–3 Myr for the inner disk and 4–6 Myr for the outer disk, as inferred from near- and mid-IR continuum observations (Ribas et al. 2014). This has long been discussed within clearing scenarios produced by winds or planet formation (e.g., Owen 2016; Ercolano & Pascucci 2017). Spectral energy distributions (SEDs), and recently, also interferometry and direct imaging, show inner gaps and/or holes in protoplanetary disks (see, e.g., Espaillat et al. 2014, for a recent observational review). Understanding the nature of these gaps or holes in terms of their dust and gas content is important in deciphering the underlying process that is responsible for the inner disk (<10–30 au) evolution. The inner disk is the main region of planet formation. Atomic and molecular line profiles can be effectively used as disk gas depletion indicators when Mstar and the disk inclination are known. Some transition disks (based on SED classification) have line detections for CO in the infrared (IR), H2 in the ultraviolet, or [OI] in the optical; these gas tracers can be used as important diagnostics for the structure and evolution of the inner disk (e.g., Salyk et al. 2009; Pontoppidan et al. 2011; Banzatti & Pontoppidan 2015; Simon et al. 2016; Hoadley et al. 2015; Banzatti et al. 2019).
The CO ro-vibrational lines emitting at ~4.6–5 μm are key diagnostics of this inner disk region because they typically need the warm and dense molecular gas within a few au fromthe star to be excited (e.g., Brittain et al. 2003; Najita et al. 2003; Blake & Boogert 2004). Line profiles with high spectral resolution provide information on CO excitation and emitting disk radii from the observed gas kinematics (e.g., Brittain et al. 2007; Salyk et al. 2011; van der Plas et al. 2015; Hein Bertelsen et al. 2014). Recently, a new analysis of high-velocity resolution CO ro-vibrational spectra from a large sample of T Tauri and Herbig disks defined a temperature–radius (T–R) diagram by determining distinct trends in CO excitation as a function of emitting radius (Banzatti & Pontoppidan 2015). When they are emitted from ≲ 1 au, the vibrational excitation of the CO lines decreases with increasing emitting radius. This was interpreted as due to IR pumping of CO following the temperature profile of the local warm dust. When the lines are instead emitted from ≳ 1 au, they show an inverted temperature profile (which we call upturn): the vibrational excitation increases with disk radius. Thisis interpreted as UV fluorescence in cold CO gas that is located beyond an inner disk cavity. This second trend in the T–R digram is in particular populated by CO spectra observed in Herbig disks, while TTauri disks follow the first trend. The vibrational CO sequence revealed in the CO T–R diagram was discussed by Banzatti & Pontoppidan (2015) and Banzatti et al. (2017, 2018) in the context of a gap-opening scenario, in which the CO emission is thought to recede to larger disk radii together with dust depletion in an inside-out fashion.
Some recent modeling from Woitke et al. (2016) with the code ProDiMo showed that the line flux from v1−0 R(10) is indeed affected when the inner radius of disks is moved. In particular, as the result of a combination of a line emitting region and weaker far-ultraviolet (FUV) stellar flux, the ro-vibrational line flux increases until Rin = 3 au of the surface area, and then it starts to decrease because of loss of excitation (Fig. 19 in Woitke et al. 2016). Woitke et al. (2016) also found that dust properties and disk flaring affect the line flux of the v1−0 rovibrational lines. In a recent work, Bosman et al. (2019) performed slab modeling and detailed DALI simulations to explain the ro-vibrational ratios observed toward Herbig star disks published in Banzatti et al. (2017, 2018) using a CO model molecule with five vibrational levels, each with 40 rotational states. Based on their slab model studies of the CO ro-vibrational lines, the authors concluded that the vibrational ratios of ~ 0.2 that are observed for disks with large cavities can be reached with high column densities and low temperatures. Their thermochemical disk geometries cannot naturally reproduce the upturn that is observed in the data (Banzatti & Pontoppidan 2015). However, their exploitation of the parameter space led the authors to conclude that high ro-vibrational ratios (v2 ∕v1 > 0.2) at CO-emitting radii larger than 5 au can be produced with gas-to-dust mass ratios higher than 104. High values like this might be associated with the formation of dust traps. The CO T-R diagram has so far been analyzed in terms of the empirical correlations found in the data. In this work, we (mostly) compare previous models to the CO sequence measured in the T–R diagram by Banzatti & Pontoppidan (2015). The main goal is to test and improve the interpretation of the observed trends in CO ro-vibrational emission.
The approach we follow in this paper is to use previous models that explored fully devoid disk holes of increasing size (Antonellini et al. 2015, 2016) and extract parameters from our models that can be compared to the observational analysis from Banzatti & Pontoppidan (2015). In addition, we include several disk models for individual sources taken from the DIANA project (Kamp et al. 2017; Woitke et al. 2016). In Sect. 2 we present our modeling and our method of comparison with the observations. In Sect. 3 we compare our model prediction with the observations. Finally, we present in Sect. 5 our interpretation of the CO rovibrational sequence and of the observed upturn in the trend of the ro-vibrational ratio versus RCO.
2 Modeling
2.1 Disk model series
The models we used to compare the data were made with the radiation thermochemical code ProDiMo (Woitke et al. 2009). In particular, we studied the CO ro-vibrational lines predicted based on a series of previously published models for TTauri and Herbig disks (Table 1) with different inner radii (Rin), disk gas masses (Mgas, keeping Mdust fixed), and dust-to-gas mass ratios (d/g, keeping Mgas fixed), as described in Antonellini et al. (2015, 2016).
We included two additonal unpublished model series with different surface density power-law indices (ɛ), and four others with more rotational, vibrational, and electronic energy levels of CO (Table A.1). This is required to test the excitation mechanism that is responsible for the observed trends. In addition, we included six Herbig disk models by combining parameters Mgas and Rin, dust-to-gas mass ratio, and the elemental abundance of carbon (δC) in order to further test our conclusions. The carbon abundance is defined as
 (1)
(1)
where nX and nH are the densities of the species X and hydrogen. In these combined models we changed two parameters at the same time with respect to the standard model in order to investigate their combined effects on CO emission lines (Table 1, series 5 and 6).
2.2 Line fluxes
The nonlocal thermal equilibrium (non-LTE) level populations for the CO molecule were derived from a two-dimensional escape probability. Subsequently, the vertical escape line flux was calculated for each transition to explore a large set of disk models. The standard CO ro-vibrational model molecule we used (hereafter called “small CO molecule”) includes the first three vibrational levels and 50 rotational levels for each vibrational state (Table A.1). A complete description of the CO ro-vibrational model molecule in ProDiMo can be found in Thi et al. (2013). Because our nominal disk model is inclined by 30° and that CO ro-vibrational lines are emitted from the innermost disk regions with a relevant contribution from the inner wall, we used a moredetailed radiative transfer for series 1 of Table 1 to verify our results, as explained in the next paragraph.
The excitation processes for CO are complex, therefore we also ran two additional Rin model seriesincluding 40 rotational levels for each vibrational level and 7 vibrational levels for the ground electronic state (X1 Σ+), hereafter the “large CO molecule”. In addition, because CO becomes electronically excited by FUV radiation, we ran the same models, including the first electronic state (A1Π+) also with 7 vibrational levels, each consisting of 40 rotational levels (“large CO molecule with fluorescence”). The last series thus includes fluorescence as an additional pumping mechanism for the excited ro-vibrational levels of CO (Thi et al. 2013). All models, including those with the small CO molecule, automatically considered IR pumping from dust thermal emission and collisional quenching. We only calculated a detailed line radiative transfer for a subselection of CO transitions with these larger CO molecules (Table A.1). These synthetic line profiles were also used to test our method of extracting the emitting radius for comparison to the observations, as explained in Sect. 2.3.
Disk model series.
2.3 Model parameters extracted for comparison to the data
From the models, we extracted emission properties that can be compared to those extracted from the observations. For the observations, Banzatti & Pontoppidan (2015) measured the CO vibrational ratio and emitting radius from stacked lines that were free from blending with other lines, specifically, lines around P(10) for the v1−0 lines, and lines around P(4) for the v2−1 lines. From the models, we therefore took the vibrational ratio between the P(4) v2−1 and P(10) v1−0 model lines. The emitting radius (RCO) is defined as the distance from the central star at which the radially integrated model line flux reaches 50% of the total CO v2−1 P(4) v2−1 or P(10) v1−0 line flux, whichever line is the less radially extended. In order to be consistent in the comparison with the observational analysis by Banzatti & Pontoppidan (2015), in which the narrow line component, where present, has been separated from the broad component that traces the innermost disk region, we also reduced the radial integration of the line flux for the line emitted from the most radially extended region. This was done by integrating the cumulative radial line flux according to the line with the less extended region (either P(4) v2−1 or P(10) v1−0). We used this simplified approach because it is computationally very expensive to produce detailed line profiles for these lines for the entire grid of models. We tested that the CO radii derived from the radially integrated flux are similar to those derived from the line velocity at the half-width at half- maximum as in the observations. Figure 1 shows model series (4) using the line profiles from detailed line RT as explained in Sect. 2.2, and illustrates that the maximum deviation between the two definitions of RCO is at most 15% and is typically lower than 5%.
2.4 Vertical escape line flux versus detailed radiative transfer and disk inclination
The results presented from our modeling are based on vertical escape line fluxes. This approach is conceptually equivalent to computing the line flux from a face-on disk, and it does not take the effect of the inclination into account. For our subset of models with more CO levels and fluorescence, we computed detailed radiative transfer for the two ro-vibrational lines of our study (Fig. 2). The fluxes produced by this computation agree with the vertical escape fluxes to within about 0.5 dex. Major deviations occur only in the models with intermediate-size gaps. The trend followed by the different lines is very similar, and thus the line ratios suffer only marginally from the detailed effects of the inclination. This makes our approach robust and independent of the disk inclination. Furthermore, considering the line ratios instead of the individual flux provides a proxy for the vibrational temperatureof the gas, and given the close wavelengths of the two transitions, it makes this value independent of the continuum flux in the near-IR. In the line emitting regions of the two lines we considered here, the gas density is much lower than the critical density of the line, and these two ro-vibrational transitions are therefore in non-LTE (Fig. 3). The need for a non-LTE treatment has previously been found by Brittain et al. (2009), Thi et al. (2013), Hein Bertelsen et al. (2014), and Bosman et al. (2019), for example. In agreement with these studies, we find that the density in the emitting region departs increasingly farther from the critical density with increasing Rin and so RCO. Bosman et al. (2019) claimed that this is an essential condition to obtain a high ro-vibrational ratio in models with larger cavities.
The line fluxes produced from our models are not meant to match the observed ones because the IR continuum is not fit to actual data of the observed sample Our models are therefore not to be considered for line flux predictions. The line fluxes of the Herbig disk models agree with those typically observed in Herbig disks (Table 6 of Banzatti et al. 2017). Instead, our TTauri models produce line fluxes that are about 1 dex weaker thanthe observed fluxes. Below, we explain some of the factors that might reduce this discrepancy.
The plots with detailed line fluxes are taken from models that include the fluorescence pumping mechanism, but we verified thatthe effect from adding fluorescence or considering a larger set of energy levels on the line ratios is insiginficantcompared to the small standard effect that is used in most of our models (Table A.1).
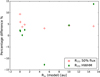 |
Fig. 1 Difference plots of radius definitions and inner radius ((RX − Rin)/Rin) × 100. The red crosses are the radii that enclose 50% of the radially integrated line flux in the models. Green diamonds are taken from the line HWHM as in Banzatti & Pontoppidan (2015). |
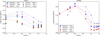 |
Fig. 2 Line fluxes for the v2−1 P(4) transition and the v1−0 P(10) transition, comparing vertical escape flux (star symbols) and detailed line radiative transfer (circles) for the Rin model series. Left plot: TTauri disk case with fluorescence. Right plot: Herbig disk case with fluorescence. Left panel: effect of the inclination from the detailed line radiative transfer for a face-on disk as well (i = 0°). |
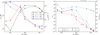 |
Fig. 3 Left: physical conditions Tgas and ngas in the average emitting regions for the lines P(4) v2−1 (red dots and green diamonds, respectively) and P(10) v1−0 (blue dots and black diamonds, respectively). Right: critical density over gas density for P(10) v1−0 (cyan triangles) and P(4) v2−1 (magenta triangles). Average line optical depth in the emitting region of the P(10) v1−0 (blue hexagons) and P(4) v2−1 (orange hexagons) lines. The horizontal dashed gray line marks the optical depth τline = 1. |
3 Comparison with observations
In Fig. 4 we show our model series from Table 1 to illustrate the effect of the individual model parameters on the observed CO emission properties. The inner disk radius and the surface density power-law index (series 1 and 2) are the only two parameters that we explore here that might change the line ratio and RCO. A variation in gas mass (series 3) produces a change in CO ro-vibrational ratio (the ratio is higher for models with larger Mgas), while the emitting radius RCO is almost completely unaffected. Similarly, a variation in dust-to-gas mass ratio (series 4) almost exclusively affects the line ratio (larger d/g, lower line ratio). The same effect of varying the dust-to-gas mass ratio and Mgas can be mimicked by changing the elemental abundance of carbon (Fig. 4, bottom right panel). The sensitivity of the ro-vibrational ratio to parameters related to disk structure and composition suggests that disks around TTauri stars might have different properties than expected (e.g., lower d/g, lower δC, higher Mgas. The models with increasing Rin also show that the ro-vibrational ratio decreases with the CO emitting radius until approximately 1 au. Beyond this radius, the ratio increases and thus reverses the trend. This upturn is also seen in the observations when TTauris and Herbigs are considered together (top left panel of Fig. 1). In the models, the line fluxes of P(4) v2−1 and P(10) v1−0 first increase and then drop when the size of the cavity increases, but the rate at which this occurs is different (see Fig. 2).
Our model explorations theoretically support the interpretation in Banzatti & Pontoppidan (2015) that disks with larger RCO can be explained by ongoing processes of disk evolution that deplete inner disks from gas, such as inside-out carving in gas and dust, or more complex partial depletion of the two components (i.e., a lower Mgas and/or lower dust mass, coupled to a small inner disk cavity). Our model series for the disks around TTauri stars agrees well with the observations at RCO < 1 au (Fig. 4), showing that the ro-vibrational line ratio is expected to decrease by about 1.5 dex with increasing cavity size. The model series predict that the line ratio should increase again at larger radii. The vertical spread of the data points can be explained by the combined effect of other parameters such as the dust-to-gas mass ratio and the disk gas mass (Fig. 4 middle right and left).
When we consider Herbig star disks, the situation becomes more complicated, and our model series with an inner gap (series 1) cannot reproduce the observations of targets with low ro-vibrational ratios. The significant mismatch in the line ratio predictions of our model series 4 can be as large as ≃ 1 dex (top right panel of Fig. 4). This could be improved when the combined effect of parameters were considered, as discussed previously, by including the effects of a significant dust enhancement or strong gas depletion (up to 1–2 dex; magenta stars in the bottom right panel of Fig. 4). This is a clue that the observed inner disks around Herbig stars may be different from those in TTauri stars. The inner zones are potentially not just empty, but are more likely partially depleted in gas or show a higher dust content (at the same gas mass). This might then contribute to producing a lower CO ro-vibrational ratio. A very similar vertical displacement is obtained by lowering the carbon abundance (δC) by one dex; we also considered a change in gas mass combined with this carbon depletion (yellow squares and red stars in the bottom right panel of Fig. 4). Additional Herbig disk models that varied a combination of parameters show that such combinations would produce an even stronger variation in the ro-vibrational ratio than is expected from a linear combination of the individual parameters we considered. A model with Rin = 5 au therefore has a ro-vibrational ratio that is almost one dex lower than the corresponding model with standard Mgas, while for a model that is truncated at 1 au, the vertical shift increases by less than a factor three (Fig. 4, bottom right panel).
Our models have a monolithic disk structure in which the properties (e.g., g/d) are varied for the whole disk. This is clearly just an approximation because Herbig disks often show gaps and ring structures, that is, a radial dependence of dust and gas distributions. However, the CO lines we focused on are emitted in the inner disk, so that the outer disk structure does not matter for this study. In the inner region, conditions can become quite extreme as a result of disk evolution, justifying very high values for the dust-to-gas mass ratio, for instance, that is, a very low gas mass with a primordial value for the disk dust mass, or vice versa, disk regions that are entirely depleted in dust. Some evidence for such extreme disk conditions with dust-devoid regions and/or regions with a dust content equal to the gas content have been found in the interpretation of near-IR and submillimeter observations using disk models (e.g., Carmona et al. 2014, 2017; van der Marel et al. 2018).
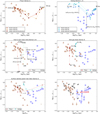 |
Fig. 4 Vibrational ratios v2−1/v1−0 vs. RCO from a comparison of observations and models. Observations are separated into TTauri (brown open triangles) and Herbig (blue open hexagons) disks and arev taken from Banzatti & Pontoppidan (2015) and Banzatti et al. (2017). Top first two panels: TTauri and Herbig disks separated (series 1), and all other panels combine them. Top right panel: effectof combining the parameters; the vertical arrows indicate the line ratio produced by models with the same Rin, but different gas mass (series 5 and 6 in Table 1). Two panels in the middle: effect of the dust-to-gas mass ratio (series 4) and the mass of the gas (series 3) on the line ratios. Middle left panel: the vertical arrows indicate the line ratio produced by models with a given dust-to-gas mass ratio (labeled), but different elemental fractions of carbon (series 5 and 6, Table 1). Bottom left panel: effect of a different surface density power-law index (series 2). Bottom right panel: DIANA models of individual disks compared to the observational data (including error bars for the Herbig disks). Individual disk models (black stars) are numbered according to Table 2. The red hexagon shows the model of Carmona et al. (2014). |
DIANA standard fit targets.
4 Discussion
4.1 Exploring more complex inner disk structures in Herbig disks
The bottom right panel in Fig. 4 shows the line ratio we extracted from disk models for the objects reported in Table 2, which were fit following the DIANA1 standard (Woitke et al. 2016). These objects are a heterogeneous collections of 14 disks (both TTauri and Herbig disks, Woitke et al. 2019)that match the multiwavelength continuum and the available line fluxes, plus additional data when available (Dionatos et al. 2019).
In DIANA, disks are modeled with more complex inner structures than just a monolithic disk (with the exception of MWC 480 and RECX 15). Several of these disks are consistent with a two-zone radial structure that we labeled (pre-)transitional, and some others have inner cavities (disk holes). In four objects with line ratios below 0.3 (GM Aur, LkCa 15, TW Hya, and HD 97048), the values are too low for our Herbig disk models (Sect. 3). Only one of these objects is a Herbig star disk (HD 97048), and three of them have a large hole (HD 97048, GM Aur, and LkCa 15). However, these models still do not overlap with the data in terms of RCO; only TWHya (number 9) is close to the region that we need to populate with Herbig models, but TWHya is a TTauri. The only Herbig model that falls in the region that is left empty by our monolithic models is HD135344B, from Carmona et al. (2014).
Two interesting targets, both TTauri disks, have an inverted surface density profile, which is very peculiar. One of them has the lowest CO vibrational ratio in the DIANA sample (TW Hya). Disks are commonly expected to have a surface density that decreases radially according to a power law with exponent ɛ. However, in certain objects, modeling has been consistent with regions in which the surface density increases radially (DIANA models numbers 8 and 9, Figs. 20 and 12 of Woitke et al. 2019, and HD135344B, red hexagon, from Carmona et al. 2014 in the bottom right panel of Fig. 4). Following this result, we considered an additional model series in which we changed the surface density radial distribution for both TTauri and Herbig star disk cases (series 2; Fig. 4 bottom left). The line ratio and the emitting region are not significantly affected by any change in surface density radial distribution profile until ɛ becomes negative (an inverted surface density profile). For negative values, the line ratio initially drops to just below −0.5 for the TTauri and Herbig model series, and the emitting region of CO quickly drifts beyond the inner radius. The ro-vibrational ratio is affected by less than 0.5 dex in TTauri and Herbig star disks within the dynamic range we explored. This effect partially mimics series 1. This means that a combination of gas depletion, inverted surface density index, and/or an inner hole might explain the observations with large RCO.
The potential explanations for such an altered disk structure include the perturbation induced by a Jovian planet in the inner disk (Tatulli et al. 2011; Lubow & D’Angelo 2006; Varnière et al. 2006). In two Herbig star disks consistent with models that show inverted surface density profile (HD 135344B and HD 139614), the gas column density is partially depleted and the dust column density is strongly depleted in the region where the surface density power-law index is positive. This might be a consequence of a planet that has opened a small inner gap (Carmona et al. 2014, 2017). In our modeling, this is equivalent to a combination of an inverted surface density profile and low gas content (and even stronger dust depletion). This combination of parameters would produce a low ro-vibrational ratio as shown in the bottom right panel of Fig. 4. ALMA observations support simultaneous dust and gas depletion in a few disks based on emission from 13CO and C18O (van der Marel et al. 2016).
4.2 Alternative explanation for the upturn in the CO sequence
When more energy levels are considered, including electronically excited levels for the CO molecule, a more complete and realistic description of the excitation processes in the CO molecule emerges. Our CO lines were computed from detailed non-LTE level populations. This is important because the average density of the disk region from which these lines are emitted is clearly below the critical density for these transitions (Fig. 3; the emitting region is consistently truncated here, as explained in Sect. 2.3). Tgas also decreases with Rin to almost level off beyond 1 au, in agreement with the results of Bosman et al. (2019). This shows that the CO levels in our models are populated by IR pumping caused by the thermal emission from the dust. Because the CO molecule absorbs UV radiation in non-dissociative electronic levels, this also affects the population of ro-vibrational states. Thi et al. (2013) showed thatthis can cause UV fluorescence pumping of the energy levels. Previous studies for the Herbig star disk of HD 100546 found that fluorescence increases the line fluxes associated with the ro-vibrational transition v2−1 by about a factor two, while the v1−0 fluxes are unaffected (Hein Bertelsen et al. 2014). Hot bands from higher vibrational levels are affected up to one dex. For TTauri disks, the UV pumping seems to play a role only for the population of very excited vibrational states because v = 14 of the ground electronic state (Schindhelm et al. 2012). In this study we analyze only ro-vibrational lines from the first three vibrational states, v1−0 and v2−1, of the ground electronic state, and the populations appear mostly unaffected by fluorescence in the case of TTauri disks, and only moderately affected in the case of Herbig disks (top left and right panels in Fig. 4). In our models, the v2−1∕v1−0 ratio is therefore less sensitive to UV fluorescence, while higher vibrational levels clearly show fluorescence pumping in some Herbig disks(Brittain et al. 2007; van der Plas et al. 2015).
According to our modeling results, the increase in vibrational ratio found in Banzatti & Pontoppidan (2015) for large RCO values in Herbig disks (see Sect. 1) is not attributed to fluorescence pumping for TTauri and Herbig star disks. Our models show a strong difference in line optical depth for the v2−1 and v1−0 transitions. While the P(10) v1−0 line is optically thick for all the inner radii, the P(4) v2−1 line changes from an optically thick regime in the less truncated models to an optically thin regime for disk inner radii of ≳ 1 au, exactly where the upturn occurs in Fig 4. This coincides with a significant drop in line flux of the v1−0 line. In comparison, the v2−1 line shows a smaller drop in line flux and even levels off for Rin ≫ 1 au. As a consequence the ro-vibrational ratio increases for large inner radii. The reason for this is that the v2−1 in the optically thin regime becomes superthermally excited, in contrast to v1−0, which is subthermally excited. A superthermal population for higher vibrational levels of CO like this has previously been reported by Thi et al. (2013). The lower volume density of the emitting regions in more truncated disks (Rin ≫ 1 au), combined with a higher critical density of the v2−1, leads to stronger non-LTE effects. These effects also compensate for the lower gas temperature and lower emitting gas column density for larger inner radii, leading to an almost constant line flux for large Rin. A similar process occurs with the variation of the surface density power-law index and produces the slight upturn observed in Fig. 4.
In our modeling framework, we therefore do not need to invoke effects of dust depletion or dust traps, as suggested by Bosman et al. (2019), to reproduce the ro-vibrational upturn. Our cavity-series models describe the downward trend in ro-vibrational ratios with increasing RCO observed towards TTauri star disks very well, and they reproduce the upturn in the ro-vibrational ratio for Herbig disks with large inner radii. However, these cavity-series models fail to match the very low observed ratios for Herbig star disks with inner radii of about 1 au. In this case, we have to invoke a more complex disk structure with a dust-to-gas mass ratio that is different from the canonical value, for instance, or with inverted surface density profiles. In Table C.1 we compare our model parameters with those of DALI. In addition to small differences in stellar properties, we find that the dust settling prescription is one of the main differences that might affect the CO ro-vibrational ratio result obtained by both models. In our models we used the turbulent settling as described in Dubrulle et al. (1995), and this mainly affects the outer disk (because of the density dependence). The parameterized approach enforces settling across the entire disk structure and therefore strongly affects the continuum opacity in the upper layers of the inner disk (Antonellini et al. 2017). The surface density inside 50 au is another significant difference that might affect the ro-vibrational ratios of the two models.
5 Conclusions
We mostly used existing radiation thermal-chemical models to verify the interpretation of trends observed in near-IR observationsof CO ro-vibrational lines in TTauri and Herbig star disks (Banzatti & Pontoppidan 2015). We considered a series of models in which we changed only the inner disk radius, surface density power-law index, dust-to-gas mass ratio, and gas mass (Table 1, series 1, 2, and 3, respectively). These parameters were selected as promising for investigating the proposed explanations for the observed trends between v2 ∕v1 and RCO. Additional models with detailed line radiative transfer and many CO energy levels were included. We summarize the investigated scenarios and our findings below.
Scenario 1: inner dust- and gas-devoid cavities of increasing size are able to match the decrease in CO vibrational excitation with increasing radius, as observed in disks around TTauri stars. The same models instead fail to match CO emission in Herbig disks overall, but can match a few disks that have large inner cavities (> 10 au).
Scenario 2: an inverted surface density profile is also able to produce the trend for TTauri and Herbig disks, but our models suggest thatadditional factors (e.g., dust or gas depletion) also need to be combined to try and reproduce the observed low CO rovibrational ratios.
Scenario 3: additional factors to be considered to match CO emission in Herbig disks include inner cavities that are only partially depleted of gas or dust. Detailed modeling of individual Herbig disks seems to favor a dust-depleted cavity (Carmona et al. 2014, 2017). This is also supported by observations of CO isotopologs and dust continuum with ALMA (van der Marel et al. 2016).
The models produce an upturn and the increase in vibrational ratio with radius for radii larger than 1 au without invoking the effect of UV fluorescence. As shown in Fig. 2, both line fluxes decrease until about 1 au, and in the case of the v2−1, the decrease stops and the flux levels off. Our models show that the v2−1 transition becomes optically thin for models that are truncated beyond 1 au, simultaneously, the involved energy levels in the transition become superthermally excited, which balances the effect of the line optical depth. This causes a turning point in the ro-vibrational ratio.
The fact that we can match CO emission in TTauri disks with the approximation of completely gas- and dust-devoid inner cavities suggests that their evolution is consistent with an inside-out disk clearing. As an alternative possibility, when we consider DIANA models of TW Hya and DM Tau, this trend is degenerate, with the existence of a population of transition disks that show an inverted surface density radial profile combined with low gas mass.
For the Herbig star disks, the possibility of more complicated inner structures is supported by the fact that we cannot reproduce most of the observations by varying a single disk parameter. The models approach the observations when we combined multiple parameters such as disk inner radius, dust-to-gas mass ratio, and disk gas mass. Alternatively, a combination of an inverted surface density profile with a different content of gas and dust in disk might be considered as well. We also showed that reducing the carbon abundance can decrease the ro-vibrational ratio by a similar factor as is found for a higher dust-to-gas mass ratio or for a lower Mgas. In order to model individual disks in detail, it is necessary to include additional observations that can help constrain the inner disk structure (e.g., interferometry or gas line profiles), as was done in Carmona et al. (2014).
We have explored the effects on the CO ro-vibrational lines from the inner disk produced by individual and combined model parameters. More work is needed in the future to connect the results of this study with physical scenarios of inner disk evolution (i.e., photoevaporation and planet formation) by folding in additional observational data such as near- and mid-IR interferometry, and optical or near-IR emission line profiles.
Acknowledgement
The author is grateful to the STFC for support through grant number ST/P000321/1.
Appendix A CO model molecule
Table A.1 provides an overview of the energy levels of the different disk model setups for the CO molecule.
Overview of CO ro-vibrational levels included in the model.
Appendix B Line emitting regions
Figure B.1 shows detailed information for the P(10) v1−0 and P(4) v2−1 line from the escape probability for three representative TTauri disk models with Rin = 0.1, 1 and 10 au. The three panels for each case show the optical depth in the respective line and continuum as a function of radius, the cumulative flux in the line, and the line emitting region (15 and 85% of the radial and vertical line flux, respectively) in addition to the CO density in the disk model.
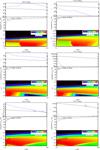 |
Fig. B.1 Zoomed-in line emitting regions from the TTauri models with Rin = 0.1 au for the P(10)v1−0 (top left) and the P(4) v2−1 line (top right). Middle and bottom rows: same for the models with Rin = 1.0 and 10 au.In each figure, the top panel shows the continuum optical depth (black line) and the line optical depth (blue line). Middle panel: cumulative line flux from vertical escape probability as a function of the radial distance from the star. Bottom panel: CO density in color scale with the region from which the vertical × radial integrated flux, amounting then to 49% of the total line flux, is emitted, and it is reported as numbers in the middle slice of each plot (black contours, 15-85% of the vertical and radial integrated line flux, dashed lines). |
Appendix C Stellar and disk model parameters
Table C.1 shows the central star properties for our TTauri and Herbig star models, compared with Bosman et al. (2019) DALI model parameters. In the same table, we show the properties of our disk models that we kept fixed in all the model series.
Overview of the fixed model parameters for the T Tauri and Herbig models.
References
- Alexander, R., Pascucci, I., Andrews, S., Armitage, P., & Cieza, L. 2014, Protostars and Planets VI (Tucson, AZ: University of Arizona Press), 475 [Google Scholar]
- Antonellini, S., Kamp, I., Riviere-Marichalar, P., et al. 2015, A&A, 582, A105 [NASA ADS] [CrossRef] [EDP Sciences] [Google Scholar]
- Antonellini, S., Kamp, I., Lahuis, F., et al. 2016, A&A, 585, A61 [NASA ADS] [CrossRef] [EDP Sciences] [Google Scholar]
- Antonellini, S., Bremer, J., Kamp, I., et al. 2017, A&A, 597, A72 [NASA ADS] [CrossRef] [EDP Sciences] [Google Scholar]
- Banzatti, A., & Pontoppidan, K. M. 2015, ApJ, 809, 167 [NASA ADS] [CrossRef] [Google Scholar]
- Banzatti, A., Pontoppidan, K. M., Salyk, C., et al. 2017, ApJ, 834, 152 [NASA ADS] [CrossRef] [Google Scholar]
- Banzatti, A., Garufi, A., Kama, M., et al. 2018, A&A, 609, L2 [NASA ADS] [CrossRef] [EDP Sciences] [Google Scholar]
- Banzatti, A., Pascucci, I., Edwards, S., et al. 2019, ApJ, 870, 76 [NASA ADS] [CrossRef] [Google Scholar]
- Blake, G. A., & Boogert, A. C. A. 2004, ApJ, 606, L73 [NASA ADS] [CrossRef] [Google Scholar]
- Bosman, A. D., Banzatti, A., Bruderer, S., et al. 2019, A&A, 631, A133 [NASA ADS] [CrossRef] [EDP Sciences] [Google Scholar]
- Brittain, S. D., Rettig, T. W., Simon, T., et al. 2003, ApJ, 588, 535 [NASA ADS] [CrossRef] [Google Scholar]
- Brittain, S. D., Simon, T., Najita, J. R., & Rettig, T. W. 2007, ApJ, 659, 685 [NASA ADS] [CrossRef] [Google Scholar]
- Brittain, S. D., Najita, J. R., & Carr, J. S. 2009, ApJ, 702, 85 [NASA ADS] [CrossRef] [Google Scholar]
- Carmona, A., Pinte, C., Thi, W. F., et al. 2014, A&A, 567, A51 [NASA ADS] [CrossRef] [EDP Sciences] [Google Scholar]
- Carmona, A., Thi, W. F., Kamp, I., et al. 2017, A&A, 598, A118 [NASA ADS] [CrossRef] [EDP Sciences] [Google Scholar]
- Dent, W. R. F., Thi, W. F., Kamp, I., et al. 2013, PASP, 125, 477 [NASA ADS] [CrossRef] [Google Scholar]
- Dionatos, O., Woitke, P., Güdel, M., et al. 2019, A&A, 625, A66 [NASA ADS] [CrossRef] [EDP Sciences] [Google Scholar]
- Draine, B. T. 2003, ARA&A, 41, 241 [NASA ADS] [CrossRef] [Google Scholar]
- Dubrulle, B., Morfill, G., & Sterzik, M. 1995, Icarus, 114, 237 [NASA ADS] [CrossRef] [Google Scholar]
- Ercolano, B., & Pascucci, I. 2017, R Soc Open Sci, 4, 170114 [NASA ADS] [CrossRef] [Google Scholar]
- Espaillat, C., Muzerolle, J., Najita, J., et al. 2014, Protostars and Planets VI (Tucson, AZ: University of Arizona Press), 497 [Google Scholar]
- Evans, II, N. J., Allen, L. E., Blake, G. A., et al. 2003, PASP, 115, 965 [NASA ADS] [CrossRef] [Google Scholar]
- Fedele, D., van den Ancker, M. E., Henning, T., Jayawardhana, R., & Oliveira, J. M. 2010, A&A, 510, A72 [NASA ADS] [CrossRef] [EDP Sciences] [Google Scholar]
- Hein Bertelsen, R. P., Kamp, I., Goto, M., et al. 2014, A&A, 561, A102 [NASA ADS] [CrossRef] [EDP Sciences] [Google Scholar]
- Hernández, J., Calvet, N., Briceño, C., et al. 2007, ApJ, 671, 1784 [NASA ADS] [CrossRef] [Google Scholar]
- Hoadley, K., France, K., Alexander, R. D., McJunkin, M., & Schneider, P. C. 2015, ApJ, 812, 41 [NASA ADS] [CrossRef] [Google Scholar]
- Kamp, I., Thi, W.-F., Woitke, P., et al. 2017, A&A, 607, A41 [NASA ADS] [CrossRef] [EDP Sciences] [Google Scholar]
- Lubow, S. H., & D’Angelo, G. 2006, ApJ, 641, 526 [NASA ADS] [CrossRef] [Google Scholar]
- Najita, J., Carr, J. S., & Mathieu, R. D. 2003, ApJ, 589, 931 [NASA ADS] [CrossRef] [Google Scholar]
- Owen, J. E. 2016, PASA, 33, e005 [NASA ADS] [CrossRef] [Google Scholar]
- Pontoppidan, K. M., Blake, G. A., & Smette, A. 2011, ApJ, 733, 84 [NASA ADS] [CrossRef] [Google Scholar]
- Ribas, Á., Merín, B., Bouy, H., & Maud, L. T. 2014, A&A, 561, A54 [NASA ADS] [CrossRef] [EDP Sciences] [Google Scholar]
- Salyk, C., Blake, G. A., Boogert, A. C. A., & Brown, J. M. 2009, ApJ, 699, 330 [NASA ADS] [CrossRef] [Google Scholar]
- Salyk, C., Blake, G. A., Boogert, A. C. A., & Brown, J. M. 2011, ApJ, 743, 112 [NASA ADS] [CrossRef] [Google Scholar]
- Schindhelm, E., France, K., Burgh, E. B., et al. 2012, ApJ, 746, 97 [NASA ADS] [CrossRef] [Google Scholar]
- Simon, M. N., Pascucci, I., Edwards, S., et al. 2016, ApJ, 831, 169 [NASA ADS] [CrossRef] [Google Scholar]
- Tatulli, E., Benisty, M., Ménard, F., et al. 2011, A&A, 531, A1 [NASA ADS] [CrossRef] [EDP Sciences] [Google Scholar]
- Testi, L., Birnstiel, T., Ricci, L., et al. 2014, Protostars and Planets VI (Tucson, AZ: University of Arizona Press), 339 [Google Scholar]
- Thi, W. F., Kamp, I., Woitke, P., et al. 2013, A&A, 551, A49 [NASA ADS] [CrossRef] [EDP Sciences] [Google Scholar]
- van der Marel,N., van Dishoeck, E. F., Bruderer, S., et al. 2016, A&A, 585, A58 [NASA ADS] [CrossRef] [EDP Sciences] [Google Scholar]
- van der Marel,N., Williams, J. P., Ansdell, M., et al. 2018, ApJ, 854, 177 [NASA ADS] [CrossRef] [Google Scholar]
- van der Plas, G., van den Ancker, M. E., Waters, L. B. F. M., & Dominik, C. 2015, A&A, 574, A75 [NASA ADS] [CrossRef] [EDP Sciences] [Google Scholar]
- Varnière, P., Blackman, E. G., Frank, A., & Quillen, A. C. 2006, ApJ, 640, 1110 [NASA ADS] [CrossRef] [Google Scholar]
- Woitke, P., Kamp, I., & Thi, W.-F. 2009, A&A, 501, 383 [NASA ADS] [CrossRef] [EDP Sciences] [Google Scholar]
- Woitke, P., Min, M., Pinte, C., et al. 2016, A&A, 586, A103 [NASA ADS] [CrossRef] [EDP Sciences] [Google Scholar]
- Woitke, P., Kamp, I., Antonellini, S., et al. 2019, PASP, 131, 064301 [NASA ADS] [CrossRef] [Google Scholar]
All Tables
All Figures
|
Fig. 1 Difference plots of radius definitions and inner radius ((RX − Rin)/Rin) × 100. The red crosses are the radii that enclose 50% of the radially integrated line flux in the models. Green diamonds are taken from the line HWHM as in Banzatti & Pontoppidan (2015). |
| In the text | |
|
Fig. 2 Line fluxes for the v2−1 P(4) transition and the v1−0 P(10) transition, comparing vertical escape flux (star symbols) and detailed line radiative transfer (circles) for the Rin model series. Left plot: TTauri disk case with fluorescence. Right plot: Herbig disk case with fluorescence. Left panel: effect of the inclination from the detailed line radiative transfer for a face-on disk as well (i = 0°). |
| In the text | |
|
Fig. 3 Left: physical conditions Tgas and ngas in the average emitting regions for the lines P(4) v2−1 (red dots and green diamonds, respectively) and P(10) v1−0 (blue dots and black diamonds, respectively). Right: critical density over gas density for P(10) v1−0 (cyan triangles) and P(4) v2−1 (magenta triangles). Average line optical depth in the emitting region of the P(10) v1−0 (blue hexagons) and P(4) v2−1 (orange hexagons) lines. The horizontal dashed gray line marks the optical depth τline = 1. |
| In the text | |
|
Fig. 4 Vibrational ratios v2−1/v1−0 vs. RCO from a comparison of observations and models. Observations are separated into TTauri (brown open triangles) and Herbig (blue open hexagons) disks and arev taken from Banzatti & Pontoppidan (2015) and Banzatti et al. (2017). Top first two panels: TTauri and Herbig disks separated (series 1), and all other panels combine them. Top right panel: effectof combining the parameters; the vertical arrows indicate the line ratio produced by models with the same Rin, but different gas mass (series 5 and 6 in Table 1). Two panels in the middle: effect of the dust-to-gas mass ratio (series 4) and the mass of the gas (series 3) on the line ratios. Middle left panel: the vertical arrows indicate the line ratio produced by models with a given dust-to-gas mass ratio (labeled), but different elemental fractions of carbon (series 5 and 6, Table 1). Bottom left panel: effect of a different surface density power-law index (series 2). Bottom right panel: DIANA models of individual disks compared to the observational data (including error bars for the Herbig disks). Individual disk models (black stars) are numbered according to Table 2. The red hexagon shows the model of Carmona et al. (2014). |
| In the text | |
|
Fig. B.1 Zoomed-in line emitting regions from the TTauri models with Rin = 0.1 au for the P(10)v1−0 (top left) and the P(4) v2−1 line (top right). Middle and bottom rows: same for the models with Rin = 1.0 and 10 au.In each figure, the top panel shows the continuum optical depth (black line) and the line optical depth (blue line). Middle panel: cumulative line flux from vertical escape probability as a function of the radial distance from the star. Bottom panel: CO density in color scale with the region from which the vertical × radial integrated flux, amounting then to 49% of the total line flux, is emitted, and it is reported as numbers in the middle slice of each plot (black contours, 15-85% of the vertical and radial integrated line flux, dashed lines). |
| In the text | |
Current usage metrics show cumulative count of Article Views (full-text article views including HTML views, PDF and ePub downloads, according to the available data) and Abstracts Views on Vision4Press platform.
Data correspond to usage on the plateform after 2015. The current usage metrics is available 48-96 hours after online publication and is updated daily on week days.
Initial download of the metrics may take a while.