Fig. 4
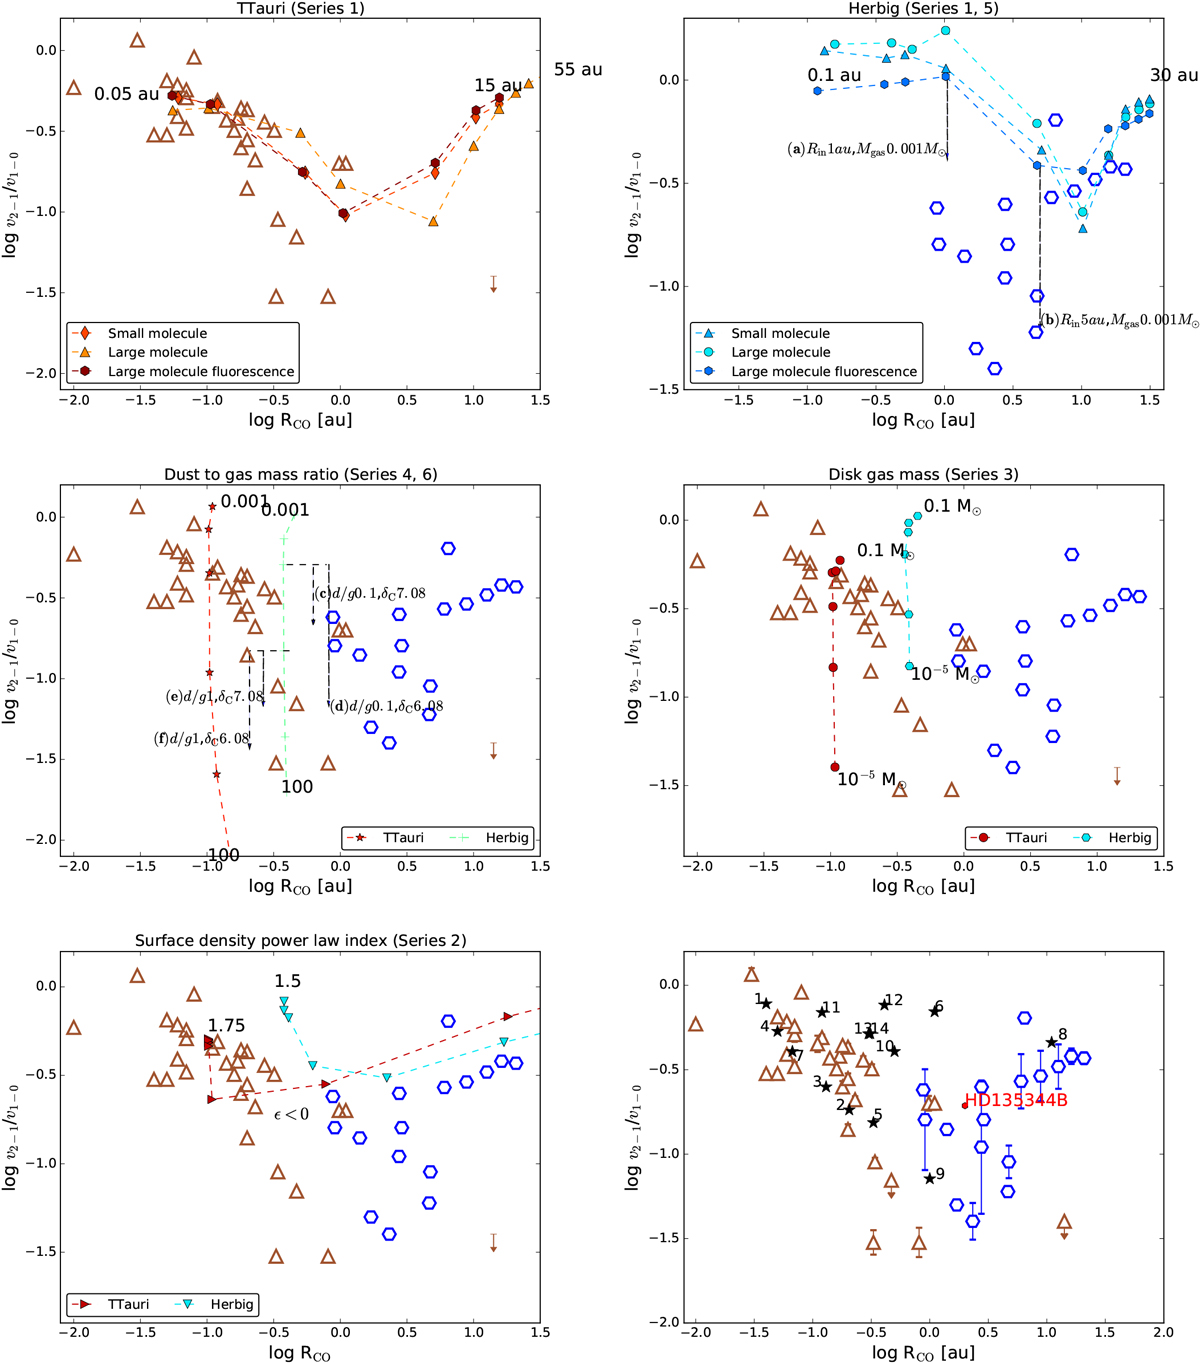
Vibrational ratios v2−1/v1−0 vs. RCO from a comparison of observations and models. Observations are separated into TTauri (brown open triangles) and Herbig (blue open hexagons) disks and arev taken from Banzatti & Pontoppidan (2015) and Banzatti et al. (2017). Top first two panels: TTauri and Herbig disks separated (series 1), and all other panels combine them. Top right panel: effectof combining the parameters; the vertical arrows indicate the line ratio produced by models with the same Rin, but different gas mass (series 5 and 6 in Table 1). Two panels in the middle: effect of the dust-to-gas mass ratio (series 4) and the mass of the gas (series 3) on the line ratios. Middle left panel: the vertical arrows indicate the line ratio produced by models with a given dust-to-gas mass ratio (labeled), but different elemental fractions of carbon (series 5 and 6, Table 1). Bottom left panel: effect of a different surface density power-law index (series 2). Bottom right panel: DIANA models of individual disks compared to the observational data (including error bars for the Herbig disks). Individual disk models (black stars) are numbered according to Table 2. The red hexagon shows the model of Carmona et al. (2014).
Current usage metrics show cumulative count of Article Views (full-text article views including HTML views, PDF and ePub downloads, according to the available data) and Abstracts Views on Vision4Press platform.
Data correspond to usage on the plateform after 2015. The current usage metrics is available 48-96 hours after online publication and is updated daily on week days.
Initial download of the metrics may take a while.