Fig. B.1
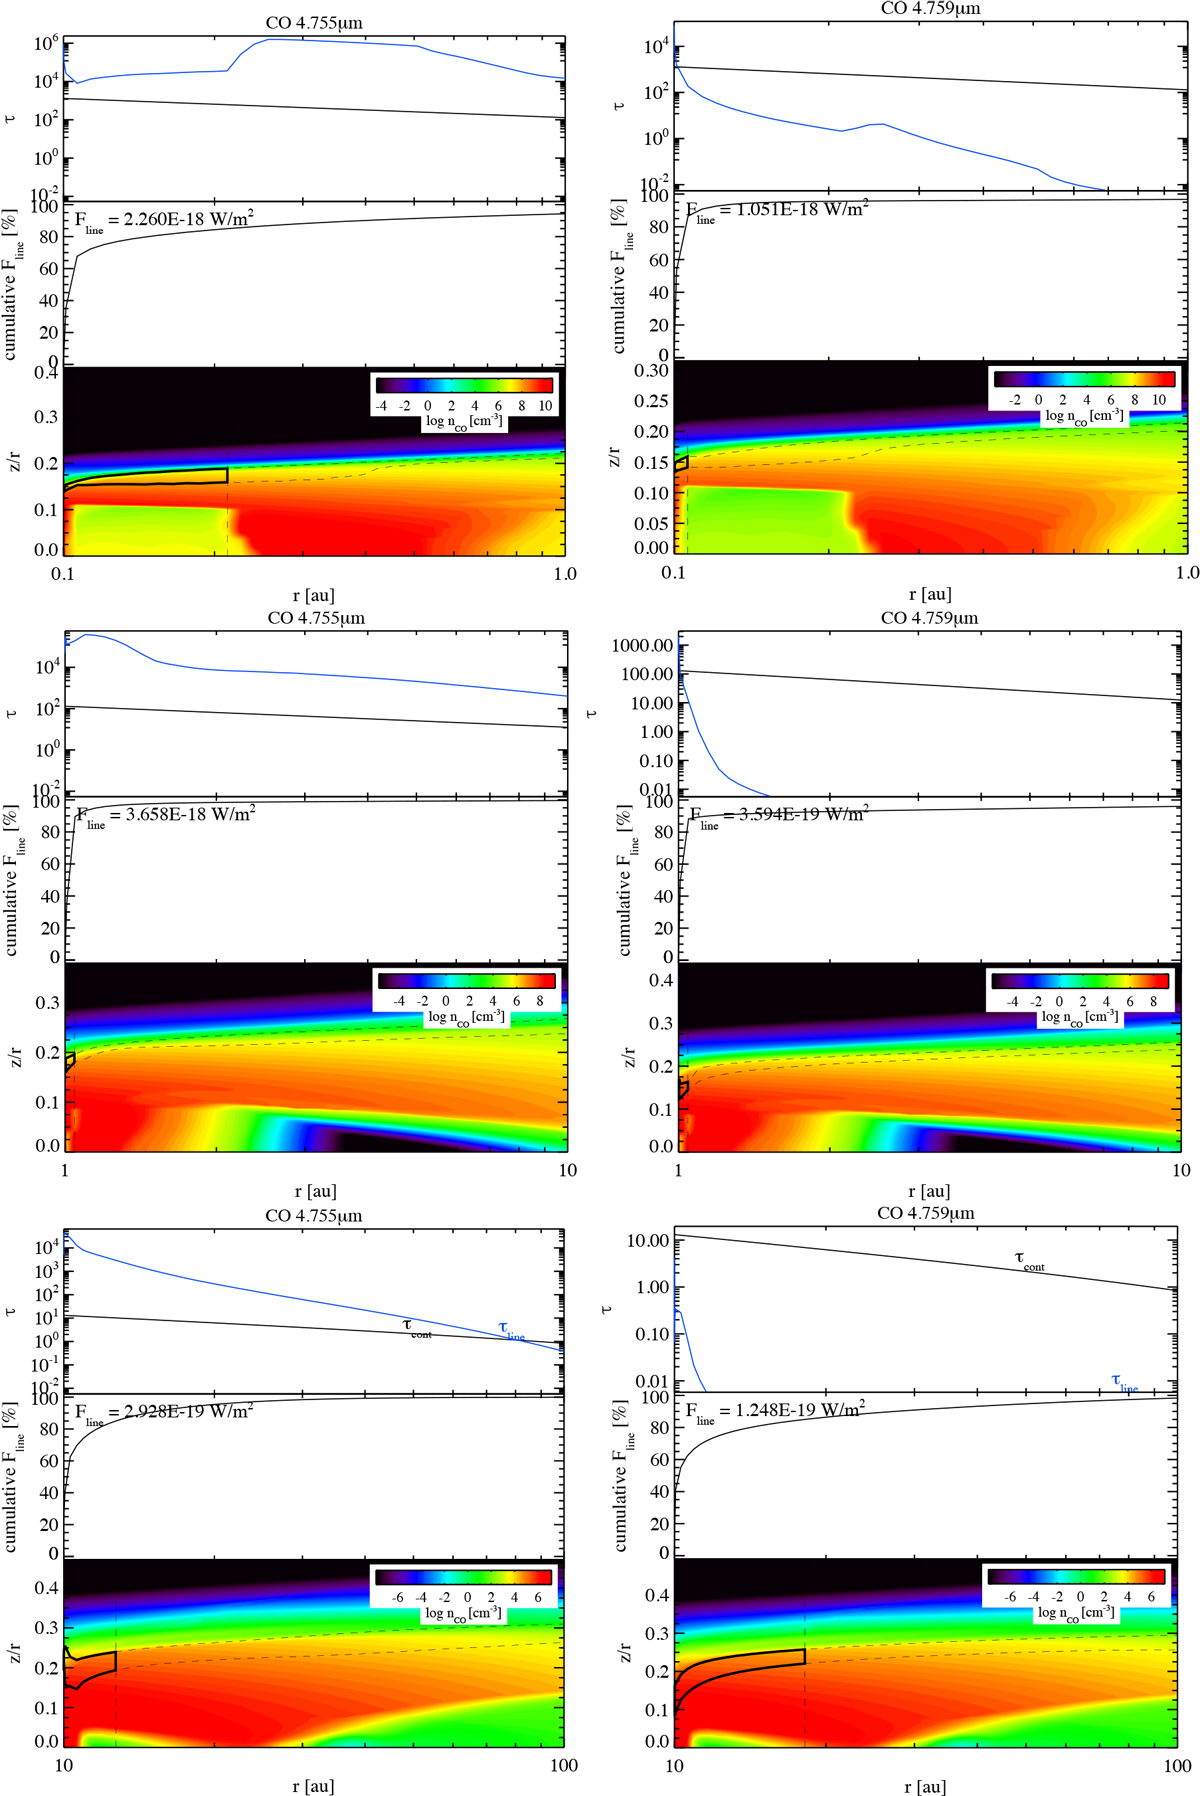
Zoomed-in line emitting regions from the TTauri models with Rin = 0.1 au for the P(10)v1−0 (top left) and the P(4) v2−1 line (top right). Middle and bottom rows: same for the models with Rin = 1.0 and 10 au.In each figure, the top panel shows the continuum optical depth (black line) and the line optical depth (blue line). Middle panel: cumulative line flux from vertical escape probability as a function of the radial distance from the star. Bottom panel: CO density in color scale with the region from which the vertical × radial integrated flux, amounting then to 49% of the total line flux, is emitted, and it is reported as numbers in the middle slice of each plot (black contours, 15-85% of the vertical and radial integrated line flux, dashed lines).
Current usage metrics show cumulative count of Article Views (full-text article views including HTML views, PDF and ePub downloads, according to the available data) and Abstracts Views on Vision4Press platform.
Data correspond to usage on the plateform after 2015. The current usage metrics is available 48-96 hours after online publication and is updated daily on week days.
Initial download of the metrics may take a while.