| Issue |
A&A
Volume 635, March 2020
|
|
|---|---|---|
| Article Number | L6 | |
| Number of page(s) | 6 | |
| Section | Letters to the Editor | |
| DOI | https://doi.org/10.1051/0004-6361/202037481 | |
| Published online | 04 March 2020 | |
Letter to the Editor
Discovery of technetium- and niobium-rich S stars: The case for bitrinsic stars⋆
1
Institute of Astronomy and Astrophysics (IAA), Université Libre de Bruxelles (ULB), CP 226, Boulevard du Triomphe, 1050 Bruxelles, Belgium
e-mail: This email address is being protected from spambots. You need JavaScript enabled to view it.
2
Institute of Astronomy, KU Leuven, Celestijnenlaan 200D, 3001 Leuven, Belgium
Received:
10
January
2020
Accepted:
18
February
2020
Abstract
Context. S stars are late-type giants with overabundances of s-process elements. They come in two flavors depending on the presence or lack of presence of technetium (Tc), an element without stable isotopes. Intrinsic S stars are Tc-rich and genuine asymptotic giant branch (AGB) stars, while extrinsic S stars owe their s-process over abundances to the pollution from a former AGB companion, which is now a white dwarf (WD). In addition to Tc, another distinctive feature between intrinsic and extrinsic S stars is the overabundance of niobium (Nb) in the latter class. Indeed, since the mass transfer occurred long ago, 93Zr had time to decay into the only stable isotope of Nb, 93Nb, causing its overabundance.
Aims. We discuss the case of the S stars BD+79°156 and o1 Ori, whose specificity lies in sharing the distinctive features of both intrinsic and extrinsic S stars, namely the presence of Tc along with a Nb overabundance.
Methods. We used high-resolution HERMES optical spectra, MARCS model atmospheres of S stars, Gaia DR2 parallaxes, and STAREVOL evolutionary tracks to determine the stellar parameters and chemical abundances of the two S stars, and to locate them in the Hertzsprung-Russell (HR) diagram.
Results. BD+79°156 is the first clear case of a bitrinsic star, that is, a doubly s-process-enriched object, first through mass transfer in a binary system and then through internal nucleosynthesis that is responsible for the Tc-enrichment in BD+79°156, which must, therefore, have reached the AGB phase of its evolution. This hybrid nature of the s-process pattern in BD+79°156 is supported by its binary nature and its location in the HR diagram that is just beyond the onset of the third dredge-up on the AGB. The Tc-rich, binary S-star o1 Ori with a WD companion was another long-standing candidate for a similar hybrid s-process enrichment. However, the marginal overabundance of Nb derived in o1 Ori does not allow one to trace evidence of large amounts of pollution coming from the AGB progenitor of its current WD companion unambiguously. As a side product, the current study offers a new way of detecting binary AGB stars with WD companions by identifying their Tc-rich nature along with a Nb overabundance.
Key words: stars: AGB and post-AGB / stars: abundances / nuclear reactions / nucleosynthesis / abundances / stars: interiors / Hertzsprung-Russell and C-M diagrams
Based on observations made with the Mercator Telescope, operated on the Island of La Palma by the Flemish Community, at the Spanish Observatorio del Roque de los Muchachos of the Instituto de Astrofísica de Canarias.
© ESO 2020
1. Introduction
S stars are late-type giants with molecular bands of ZrO and TiO, which are the most characteristic spectroscopic feature (Merrill 1922). They are transition objects between M-type stars and carbon stars on the asymptotic giant branch (AGB) as their carbon/oxygen (C/O) ratio is in the range 0.5 ≤ C/O < 1 (Iben & Renzini 1983; Scalo & Ross 1976; Van Eck et al. 2017). The strong ZrO bands actually reflect overabundances of slow neutron-capture (s-process) elements in their spectra (Keenan 1954; Smith & Lambert 1990).
S stars come in two flavors. Intrinsic S stars are defined as Tc-enriched S stars. Since Tc is an element with no stable isotopes and its 99Tc isotope produced by the s-process has a half-life T1/2 of 2.1 × 10⁵ yr, its detection indicates that this element is currently synthesized by the star located on the AGB, which is undergoing third-dredge-up (TDU) episodes. On the other hand, in extrinsic S stars, Tc was brought long ago by a former AGB companion through mass transfer. Because the time that elapsed since this mass-transfer episode is most likely much longer than the 99Tc half-life, Tc had time to decay in 99Ru so that Tc lines are thus absent from the spectrum. Extrinsic S stars that are not yet on the thermally-pulsing- (TP-) AGB can thus not produce s-process elements themselves (Van Eck et al. 1998; Shetye et al. 2018). They have all been shown to be binaries (Jorissen et al. 1998, 2019).
The isotope 93Zr has a half-life T1/2 = 1.53 × 10⁶ yr, and it is another radio-isotope for which the abundance corroborates the above scenario. In extrinsic S stars, this isotope had time to decay into 93Nb, which is the only stable Nb isotope. On the contrary, in intrinsic S stars, 93Zr is still alive, meaning that the Nb abundance is still low (i.e., with a pre-s-process, solar-scaled abundance; Neyskens et al. 2015).
In the current work, through abundance analyses of BD + 79°156 and o1 Ori, we present a new type of S star, showing signatures of both intrinsic and extrinsic S stars. We label them “bitrinsic” S stars. A bitrinsic star can be defined as a star having passed through a double pollution in s-process elements, occurring first when its companion is on the TP-AGB, which pollutes it through mass transfer, and second when its evolves on the TP-AGB and enriches its envelope by dredge-ups. These two events can only be traced by measuring Nb (enhanced in mass-transfer systems) and Tc (enhanced in TP-AGB objects) abundances. This new class of S stars has been unraveled thanks to the availability of high-resolution spectra and of Gaia data-release 2 (GDR2) parallaxes (Gaia Collaboration 2018). In Sect. 2, we describe the observations, the detection of Tc, and discuss the binary nature of the studied systems. In Sects. 3–5, we present the atmospheric parameters, surface abundances, and location in the Hertzsprung-Russell (HR) diagram, which confirms the genuine AGB evolutionary status of these bitrinsic candidates. Abundances are then compared to STAREVOL nucleosynthesis predictions in Sect. 6. Section 7 summarizes our analysis.
2. Searching for bitrinsic S stars
Among the S stars from the General Catalogue of Galactic S Stars (Stephenson 1984, CGSS), we selected a sample of S stars that fulfill the following conditions due to quality concerns: First, stars with σϖ/ϖ ≤ 0.3, where ϖ is the Gaia parallax and σϖ is its error. Second, stars with declinations north of −30° and V magnitudes brighter than 11 mag are to be observed with the HERMES high-resolution spectrograph1 (Raskin et al. 2011). Third, stars with HERMES spectra having a signal-to-noise ratio (S/N) of 50 in the V band since a high S/N is required to ensure the Tc-line detectability (Van Eck et al. 2017; Shetye et al. 2018).
Out of this sample, we found two candidates, namely BD+79°156 and o1 Ori, that show the presence of Tc lines and Nb overabundances. The following sections present the detailed analysis of these stars. The analysis of the rest of this sample is presented elsewhere (Shetye et al. 2018, 2019) and in a forthcoming paper (Shetye et al., in prep.).
2.1. Technetium detection
The detection of Tc is made by using the three Tc I resonance lines located at 4238.19 Å, 4262.27 Å, and 4297.06 Å. Based on medium-resolution spectra, Jorissen et al. (1993) classified BD+79°156 as a Tc-deficient object. A subsequent study of infrared colors (which constitute an indirect classification criterion since intrinsic stars generally exhibit infrared excesses indicative of mass loss; Jorissen et al. 1993; Van Eck & Jorissen 2000) by Yang et al. (2006) and Otto et al. (2011) classified BD+79°156 as well as an extrinsic S star. Regarding o1 Ori, Wallerstein & Dominy (1988) and Smith & Lambert (1988) derived its Tc abundance from medium-resolution spectra and thus classified it as intrinsic (Tc-rich). This claim was confirmed by Wang & Chen (2002) from near-infrared observations.
However, as shown in Fig. 1 based on high-resolution HERMES spectra, absorption features are clearly present at the wavelengths of the three ultraviolet (UV) Tc lines for the two stars o1 Ori and BD+79°156. The spectra of BD+79°156, o1 Ori, and a reference Tc-rich S star (V915 Aql) are in sharp contrast with those of the reference Tc-poor S star HD 233158, which are shown for comparison purposes. From our analysis of high-resolution spectra, we thus reclassify BD+79°156 as a Tc-rich S star (Fig. 1).
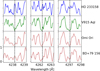 |
Fig. 1. Spectral region around the three (4238.19, 4262.27, and 4297.06 Å) ultraviolet Tc I lines for Tc-poor (HD 233158, blue spectrum in the top panels) and Tc-rich (V915 Aql, green spectrum in the second panels from the top) S stars from Shetye et al. (2018) and for the bitrinsic candidates o1 Ori and BD+79°156 (bottom panels). The spectra have been arbitrarily normalized and binned by a factor of 1.5 to increase the S/N. |
2.2. Binarity
The binary nature of o1 Ori was first assessed by the discovery of a white dwarf (WD) companion in International Ultraviolet Explorer (IUE) data, with spectral type DA3 and Teff = 22 000 K (Ake & Johnson 1988). Prior to that discovery, Peery (1986) had reported the detection of emission lines from ionized elements in IUE spectra of o1 Ori, but he could not decide whether these lines originate from the giant star due to flares, for instance, or if they were attributable to the presence of a hot subluminous companion. o1 Ori has since been an enigma because Tc-rich S stars ought not to have a WD companion, in contrast to Tc-poor stars. But it has remained unclear until now whether this WD had polluted its companion with heavy elements while on the TP-AGB, or in other words, whether this star was extrinsic before turning intrinsic. This question is addressed in Sect. 6.
The derivation of the orbital elements of the o1 Ori system has turned out to be very difficult (Jorissen et al. 2019) because the radial-velocity data show a very limited excursion of 2 to 3 km s−1 with some superimposed radial-velocity jitter. A tentative period of 575 d and a mass function of (2.7 ± 0.2) × 10−5M⊙ was obtained by Jorissen et al. (2019), which is suggestive of an orbit seen almost pole-on (i = 4.7° ±1°).
BD+79°156 is a confirmed binary with an orbital period of 10 931 days, an eccentricity of 0.461, and a mass function of 0.025 M⊙, which is compatible with a WD companion (Van der Swaelmen et al. 2017; Jorissen et al. 2019). An additional confirmation of the presence of a WD companion around BD+79°156 (and o1 Ori) comes from the UV excess seen in their spectral energy distribution (SED), which is well visible when comparing photometric observations with model SED (Fig. A.1). The binarity criteria proposed by Ortiz & Guerrero (2016) based on the GALEX near-UV observed to predicted flux ratios confirm that both o1 Ori and BD+79°156 are in a binary system.
3. Derivation of the atmospheric parameters
The stellar parameters impacting the atmospheric thermal structure of S stars are Teff, log g, [Fe/H], C/O, and [s/Fe]. To disentangle this multidimensional parameter space, we followed the same methodology as described in Shetye et al. (2018). Briefly, this method performs a χ2 minimization search over several spectral windows, comparing the observed spectrum with synthetic MARCS model atmospheres of S stars (Van Eck et al. 2017). The best-fitting model is the one with the lowest χ2 value and the corresponding parameters constitute our first estimates.
The luminosity derived from the Gaia parallax and the first estimate of Teff from the χ2 fitting tool allowed us to locate the star in the HR diagram. From this, we derived the stellar mass and hence the surface gravity by comparing this position in the HR diagram with STAREVOL evolutionary tracks. We then performed an iteration on log g and on the stellar parameters, as described in Shetye et al. (2018), in order to obtain a log g value that is consistent with the mass inferred from the location in the HR diagram. The mass that we derived is ≈2 M⊙ for BD+79°156 and 1.5 M⊙ for o1 Ori. The final list of stellar parameters is presented in Table 1 2.
Main properties of the bitrinsic S stars.
4. Abundance determination
We used the radiative transfer code TURBOSPECTRUM (Alvarez & Plez 1998; Plez 2012) to generate synthetic spectra from the MARCS model atmospheres of the S stars with the atmospheric parameters, which were determined as described in Sect. 3. We used the C/O estimates from the χ2 spectral fitting tool and checked whether these values reproduce the observed spectra satisfactorily in the CH bands around 4200 Å−4300 Å. Because atomic oxygen lines are poorly reproduced in S-type stars, we adopted the solar oxygen abundance from Asplund et al. (2009), which is scaled to the star metallicity. The nitrogen abundance was derived using the CN bands at 7900 Å−8100 Å.
The metallicity was determined using at least ten isolated Fe lines in the region from 7350 Å to 8730 Å. The derived [Fe/H] and its standard deviation are provided in Table 1. The s-process abundances are listed in Table A.1. The Zr abundance was derived using two Zr I lines at 7819.37 Å and 7849.37 Å with transition probabilities from laboratory measurements (Biémont et al. 1981). We used three Nb I lines located at 5189.186 Å, 5271.524 Å, and 5350.722 Å to derive the Nb abundances in the sample stars. Details about the Fe, Zr, and Nb lines can be found in Table A.2. The Tc abundance was derived by only using the Tc line at 4262.27 Å. The other s-process abundances were also determined with the goal of obtaining a full s-process abundance profile (presented in Table A.1). A systematic analysis of these abundances along with those of the other Tc-rich S stars is deferred to a forthcoming paper.
For abundance uncertainties that are induced by the uncertainties on the atmospheric parameters, we used those of V915 Aql from Shetye et al. (2018) since the atmospheric parameters of V915 Aql (Teff = 3400 K, log g = 0.0, [Fe/H] = −0.5, C/O = 0.75, [s/Fe] = 0.0) are appropriate matches for those of our sample stars. We computed the total abundance uncertainty (σ[X/Fe] in Table A.1) by quadratically adding the elemental standard deviation due to line-to-line scatter, the atmospheric parameter-induced uncertainties as estimated for V915 Aql, and a 0.1 dex uncertainty related to the continuum placement. When only one spectral line was used to derive the abundance of a given element, a standard line-to-line scatter of 0.1 dex was adopted. The abundances and their uncertainties are listed in Table A.1.
5. Location of the bitrinsic S stars in the HR diagram
In order to infer the evolutionary status of S stars, we located them in the HR diagram by using both the effective temperature derived as described in Sect. 3 and luminosities derived using the Gaia DR2 parallaxes. We compare these positions in the HR diagram with the STAREVOL evolutionary tracks of the corresponding metallicities (Fig. 2). o1 Ori and BD+79°156 are both located above the black dashed line that marks the predicted onset of TDU in the HR diagram. This confirms that they are TP-AGB stars. The fact that they are not very evolved on the TP-AGB is consistent with their moderate s-process abundances, relatively low C/O ratios, and absence of infrared excesses.
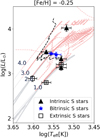 |
Fig. 2. HR diagram of intrinsic (filled triangles) S stars from Shetye et al. (2018, 2019), bitrinsic S stars (blue stars), and extrinsic (open squares) S stars from Shetye et al. (2018) along with the STAREVOL evolutionary tracks corresponding to the closest grid metallicity. The red giant branch is represented by the gray dots, whereas the red dashed line corresponds to the AGB tracks. The black dashed line marks the onset of TDU. |
6. Comparison with STAREVOL nucleosynthesis predictions
The Tc and Nb abundances are inversely correlated and a clear segregation between intrinsic and extrinsic S stars is expected in the Zr-Nb plane, as seen in Fig. 3. We now compare the measured abundances with the nucleosynthesis predictions from the STAREVOL code (Siess & Arnould 2008; Goriely & Siess 2018). The partial mixing of protons in the C-rich layers, which is responsible for the s-process nucleosynthesis, is described by a diffusive equation with the mixing parameters fover = 0.1, Dmin = 109 cm2 s−1, and p = 5, where fover controls the extent of the mixing, Dmin is the value of the diffusion coefficient at the innermost boundary of the diffusive region, and p is an additional free parameter describing the shape of the diffusion profile. Other sets of mixing parameters could be considered (Shetye et al. 2019). All details can be found in Goriely & Siess (2018) and references therein.
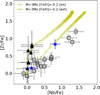 |
Fig. 3. [Zr/Fe] vs [Nb/Fe] ratios for the sample stars (blue star symbols), as compared with intrinsic (triangles) and extrinsic (open squares) S stars from Shetye et al. (2018, 2019). The yellow-green curves are the nucleosynthesis predictions from STAREVOL for 3 M⊙, [Fe/H] = −0.2 models. Each symbol along these curves represents a thermal pulse. The 2 M⊙ models completely overlap the 3 M⊙ ones, but they only reach up to [Zr/Fe] ∼ 1.3. |
In Fig. 3, we present the predictions for intrinsic and extrinsic stars with masses 2 and 3 M⊙, and [Fe/H] = 0.0 and −0.2. Our sample stars BD+79°156 and o1 Ori are both clearly Tc-rich. According to the Nb/Tc anticorrelation, they should thus not be enriched in Nb, contrary to what is observed in the ([Zr/Fe], [Nb/Fe]) plane (Fig. 3). BD+79°156 is found within the extrinsic stars ([Zr/Fe] = 0.84, [Nb/Fe] = 0.81) along the predicted theoretical trend for extrinsic S stars. Its [Zr/Nb] ratio is close to unity, which indicates that 93Zr has decayed and that a mass-transfer episode from a former AGB star has taken place. However, because BD+79°156 is enriched in Tc as well, it must currently also be an AGB star. The bitrinsic star BD+79°156 thus constitutes an example of dual-enrichment events (one extrinsic, one intrinsic).
In o1 Ori, Nb is overabundant but to a much lesser extent ([Nb/Fe] = 0.12, [Zr/Fe] = 0.15). Its position in Fig. 3 is less conclusive. However, its [Zr/Nb] ratio is close to unity as in the case of BD+79°156. Besides, a WD companion has been detected for o1 Ori (Sect. 2.2 and Ake & Johnson 1988), strengthening the case for it being a bitrinsic object.
To account for the surface composition of BD+79°156, we computed the evolution of a 2 M⊙ star with metallicity [Fe/H] = −0.3, which is representative of the observed star. This model accounts for the production of Tc. To account for the Nb overabundance, we then assume it to be due to the 93Zr pollution from a former 3 M⊙ AGB companion, which is now a dim WD. The composition of the current star is then the result of the enrichment coming from its companion through mass transfer as well as from its own TDU episodes. By adjusting the amount of material diluted in the envelope of the 2 M⊙ star from its companion and the intrinsic surface enrichment through TDU episodes (i.e., the number of thermal pulses encountered so far), we can reproduce the observed abundances fairly well, as shown in Fig. 4. Within this nonunique parameter set (describing mixing and stellar masses), a non-negligible 10% dilution factor from BD+79°156’s companion wind is needed to explain the high Nb abundance found at its surface. We conclude that for BD+79°156, a double pollution event is necessary to explain the abundance pattern. It is found not only to reproduce the measured Tc and Nb abundances but also those of light and heavy s-process elements. This conclusion holds independent of the uncertainties affecting the mixing parameters in the description of the diffusion processes. No other elements besides Nb and Tc can unambiguously point out toward such a double pollution mechanism.
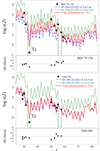 |
Fig. 4. Comparison of the observed and predicted surface abundances for BD+79°156 (top panel) and o1 Ori (bottom panel) in unit of log ϵ. The best fit (solid red curves) results from the dilution of the yields from a 3 M⊙, [Fe/H] = −0.3 model within the envelope of a 2 M⊙ [Fe/H] = −0.3 intrinsic AGB star after it has experienced five thermal pulses. In both panels, “p.5 int” means that five pulses were involved in the intrinsic contribution whereas “p61 ext” means that 61 pulses occurred in the companion star (considering mass transfer at the end of the TP-AGB phase of the companion). |
Concerning o1 Ori, this system has been considered to be a prototype bitrinsic star for a very long time (Ake & Johnson 1988; Jorissen et al. 1993, 2019). As shown in the bottom panel of Fig. 4 where we compare the abundance profile of o1 Ori with the predictions of intrinsic and extrinsic stars, a pollution of s-process elements by a binary companion may not be needed because of the slight overabundance in Nb. Hence o1 Ori is actually a star with only a marginal bitrinsic character. We support the claims of Ake & Johnson (1988) that, though the existence of a WD companion is very clear for o1 Ori, there are no signatures in the chemical abundances that would need an explanation other than the occurrence of intrinsic s-process nucleosynthesis followed by TDUs on the AGB. We thus regard o1 Ori as a Tc-rich S star with a WD companion, but there is no clear evidence of a large pollution coming from the AGB progenitor of this companion.
7. Conclusions
S stars of a new type have been uncovered, bearing characteristics of both intrinsic and extrinsic S stars, and they are referred to as bitrinsic stars. The intriguing hybrid classification as both intrinsic (because of Tc detection) and extrinsic (because of Nb overabundance and WD companion detection) can be understood if we identify these stars with objects formerly polluted by an AGB companion, which now evolve on the TP-AGB. Though such objects were expected to exist, none of them had been identified until now because of the lack of appropriate diagnostics. Thanks to a careful analysis of S-type stars involving atmospheric parameters and abundance determination using HERMES high-resolution spectra, we could identify one clear case (BD+79°156) of such doubly-polluted objects and one tentative case (o1 Ori).
These objects are interesting in several respects. First, if appropriate statistics of bitrinsic stars were available, this would put interesting constraints on binary-synthesis evolution models because the number of bitrinsic star depends, among other things, on the radius evolution during the RGB and AGB phases, which determines whether and when a Roche-lobe overflow occurs, causing the disappearance of systems that would have become bitrinsic objects (Escorza et al. 2020). A second constraint concerns the component masses: in order to exhibit s-process overabundances at their surface, AGB stars must have an initial mass that is larger than 1 M⊙ (as recently shown by Shetye et al. 2019) and smaller than 4−5 M⊙, above which the radiative s-process production is significantly reduced (Goriely & Siess 2004). Therefore, in the case of bitrinsic systems, both the primary and secondary components should satisfy this condition (along with M1 > M2). Third, spectroscopic binaries involving AGB stars are difficult to find because their radial-velocity variations are blurred by strong imprints from envelope pulsations. Tc and Nb diagnostics thus offer a direct spectroscopic way to prove the binarity of an AGB star, without resorting to a time-consuming radial-velocity monitoring. Fourth, bitrinsic stars should exist among other stellar classes as well, and in the future they should be sought out for among carbon stars and possibly among lower-metallicity carbon-enriched objects.
HERMES is a high-resolution (R = 86 000) spectrograph mounted on the Mercator Telescope at the Roque de los Muchachos Observatory, La Palma (Canary Islands).
We note that the atmospheric parameters of o1 Ori quoted in Jorissen et al. (2019) are different than the ones used in this study. This is because log g iterations were not performed in Jorissen et al. (2019)
Acknowledgments
This research has been funded by the Belgian Science Policy Office under contract BR/143/A2/STARLAB. S.V.E. thanks Fondation ULB for its support. Based on observations obtained with the HERMES spectrograph, which is supported by the Research Foundation – Flanders (FWO), Belgium, the Research Council of KU Leuven, Belgium, the Fonds National de la Recherche Scientifique (F.R.S.-FNRS), Belgium, the Royal Observatory of Belgium, the Observatoire de Genève, Switzerland and the Thüringer Landessternwarte Tautenburg, Germany. LS and SG are senior FNRS research associates. AE acknowledges the support of FWO under contract ZKD1501-00-W01.
References
- Ake, T. B., & Johnson, H. R. 1988, ApJ, 327, 214 [NASA ADS] [CrossRef] [Google Scholar]
- Alvarez, R., & Plez, B. 1998, A&A, 330, 1109 [NASA ADS] [Google Scholar]
- Asplund, M., Grevesse, N., Sauval, A. J., & Scott, P. 2009, ARA&A, 47, 481 [NASA ADS] [CrossRef] [Google Scholar]
- Biémont, E., Grevesse, N., Hannaford, P., & Lowe, R. M. 1981, ApJ, 248, 867 [NASA ADS] [CrossRef] [Google Scholar]
- Duquette, D. W., & Lawler, J. E. 1982, Phys. Rev. A, 26, 330 [NASA ADS] [CrossRef] [Google Scholar]
- Escorza, A., Siess, L., Jorissen, A., & Van Winckel, H. 2020, A&A, submitted [Google Scholar]
- Gaia Collaboration (Brown, A. G. A., et al.) 2018, A&A, 616, A1 [NASA ADS] [CrossRef] [EDP Sciences] [Google Scholar]
- Gontcharov, G. A. 2012, Astron. Lett., 38, 87 [NASA ADS] [CrossRef] [Google Scholar]
- Goriely, S., & Siess, L. 2004, A&A, 421, L25 [NASA ADS] [CrossRef] [EDP Sciences] [Google Scholar]
- Goriely, S., & Siess, L. 2018, A&A, 609, A29 [NASA ADS] [CrossRef] [EDP Sciences] [Google Scholar]
- Iben, Jr., I., & Renzini, A. 1983, ARA&A, 21, 271 [NASA ADS] [CrossRef] [Google Scholar]
- Jorissen, A., Frayer, D. T., Johnson, H. R., Mayor, M., & Smith, V. V. 1993, A&A, 271, 463 [NASA ADS] [Google Scholar]
- Jorissen, A., Van Eck, S., Mayor, M., & Udry, S. 1998, A&A, 332, 877 [NASA ADS] [Google Scholar]
- Jorissen, A., Boffin, H. M. J., Karinkuzhi, D., et al. 2019, A&A, 626, A127 [NASA ADS] [CrossRef] [EDP Sciences] [Google Scholar]
- Keenan, P. C. 1954, ApJ, 120, 484 [NASA ADS] [CrossRef] [Google Scholar]
- Kurucz, R. L. 2007, Robert L. Kurucz On-line Database of Observed and Predicted Atomic Transitions [Google Scholar]
- Martin, G., Fuhr, J., & Wiese, W. 1988, J. Phys. Chem. Ref. Data Suppl., 17 [Google Scholar]
- Merrill, P. W. 1922, ApJ, 56, 457 [NASA ADS] [CrossRef] [Google Scholar]
- Nave, G., Johansson, S., Learner, R. C. M., Thorne, A. P., & Brault, J. W. 1994, ApJS, 94, 221 [NASA ADS] [CrossRef] [Google Scholar]
- Neyskens, P., Van Eck, S., Jorissen, A., et al. 2015, Nature, 517, 174 [NASA ADS] [CrossRef] [PubMed] [Google Scholar]
- O’Brian, T. R., Wickliffe, M. E., Lawler, J. E., Whaling, W., & Brault, J. W. 1991, J. Opt. Soc. Am. B Opt. Phys., 8, 1185 [NASA ADS] [CrossRef] [Google Scholar]
- Ortiz, R., & Guerrero, M. A. 2016, MNRAS, 461, 3036 [Google Scholar]
- Otto, E., Green, P. J., & Gray, R. O. 2011, ApJS, 196, 5 [NASA ADS] [CrossRef] [Google Scholar]
- Peery, Jr., B. F. 1986, ESA Spec. Publ., 263, 117 [NASA ADS] [Google Scholar]
- Plez, B. 2012, Astrophysics Source Code Library [record ascl:1205.004] [Google Scholar]
- Raskin, G., van Winckel, H., Hensberge, H., et al. 2011, A&A, 526, A69 [NASA ADS] [CrossRef] [EDP Sciences] [Google Scholar]
- Scalo, J. M., & Ross, J. E. 1976, A&A, 48, 219 [NASA ADS] [Google Scholar]
- Shetye, S., Van Eck, S., Jorissen, A., et al. 2018, A&A, 620, A148 [NASA ADS] [CrossRef] [EDP Sciences] [Google Scholar]
- Shetye, S., Goriely, S., Siess, L., et al. 2019, A&A, 625, L1 [NASA ADS] [CrossRef] [EDP Sciences] [Google Scholar]
- Siess, L., & Arnould, M. 2008, A&A, 489, 395 [NASA ADS] [CrossRef] [EDP Sciences] [Google Scholar]
- Smith, V. V., & Lambert, D. L. 1988, ApJ, 333, 219 [NASA ADS] [CrossRef] [Google Scholar]
- Smith, V. V., & Lambert, D. L. 1990, ApJS, 72, 387 [NASA ADS] [CrossRef] [Google Scholar]
- Stephenson, C. B. 1984, Publications of the Warner and Swasey Observatory, 3, 1 [NASA ADS] [Google Scholar]
- Van der Swaelmen, M., Boffin, H. M. J., Jorissen, A., & Van Eck, S. 2017, A&A, 597, A68 [NASA ADS] [CrossRef] [EDP Sciences] [Google Scholar]
- Van Eck, S., & Jorissen, A. 2000, A&A, 360, 196 [NASA ADS] [Google Scholar]
- Van Eck, S., Jorissen, A., Udry, S., Mayor, M., & Pernier, B. 1998, A&A, 329, 971 [NASA ADS] [Google Scholar]
- Van Eck, S., Neyskens, P., Jorissen, A., et al. 2017, A&A, 601, A10 [NASA ADS] [CrossRef] [EDP Sciences] [Google Scholar]
- Wallerstein, G., & Dominy, J. F. 1988, ApJ, 330, 937 [NASA ADS] [CrossRef] [Google Scholar]
- Wang, X. H., & Chen, P. S. 2002, A&A, 387, 129 [NASA ADS] [CrossRef] [EDP Sciences] [Google Scholar]
- Wenger, M., Ochsenbein, F., Egret, D., et al. 2000, A&AS, 143, 9 [NASA ADS] [CrossRef] [EDP Sciences] [Google Scholar]
- Yang, X., Chen, P., Wang, J., & He, J. 2006, AJ, 132, 1468 [NASA ADS] [CrossRef] [Google Scholar]
Appendix A: Spectral energy distributions of the sample stars
Elemental abundances of the two bitrinsic candidates, along with the standard deviation due to line-to-line scatter.
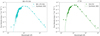 |
Fig. A.1. Photometric observations of BD+79°156 (left panel) and o1 Ori (right panel) compared with the synthetic spectral energy distribution generated using the MARCS model atmospheres with the parameters listed in Table 1. All photometric observations were retrieved from SIMBAD (Wenger et al. 2000). We note that in the two stars, the evident UV excess is in the bluest flux point. |
Atomic lines used in this study.
All Tables
Elemental abundances of the two bitrinsic candidates, along with the standard deviation due to line-to-line scatter.
All Figures
|
Fig. 1. Spectral region around the three (4238.19, 4262.27, and 4297.06 Å) ultraviolet Tc I lines for Tc-poor (HD 233158, blue spectrum in the top panels) and Tc-rich (V915 Aql, green spectrum in the second panels from the top) S stars from Shetye et al. (2018) and for the bitrinsic candidates o1 Ori and BD+79°156 (bottom panels). The spectra have been arbitrarily normalized and binned by a factor of 1.5 to increase the S/N. |
| In the text | |
|
Fig. 2. HR diagram of intrinsic (filled triangles) S stars from Shetye et al. (2018, 2019), bitrinsic S stars (blue stars), and extrinsic (open squares) S stars from Shetye et al. (2018) along with the STAREVOL evolutionary tracks corresponding to the closest grid metallicity. The red giant branch is represented by the gray dots, whereas the red dashed line corresponds to the AGB tracks. The black dashed line marks the onset of TDU. |
| In the text | |
|
Fig. 3. [Zr/Fe] vs [Nb/Fe] ratios for the sample stars (blue star symbols), as compared with intrinsic (triangles) and extrinsic (open squares) S stars from Shetye et al. (2018, 2019). The yellow-green curves are the nucleosynthesis predictions from STAREVOL for 3 M⊙, [Fe/H] = −0.2 models. Each symbol along these curves represents a thermal pulse. The 2 M⊙ models completely overlap the 3 M⊙ ones, but they only reach up to [Zr/Fe] ∼ 1.3. |
| In the text | |
|
Fig. 4. Comparison of the observed and predicted surface abundances for BD+79°156 (top panel) and o1 Ori (bottom panel) in unit of log ϵ. The best fit (solid red curves) results from the dilution of the yields from a 3 M⊙, [Fe/H] = −0.3 model within the envelope of a 2 M⊙ [Fe/H] = −0.3 intrinsic AGB star after it has experienced five thermal pulses. In both panels, “p.5 int” means that five pulses were involved in the intrinsic contribution whereas “p61 ext” means that 61 pulses occurred in the companion star (considering mass transfer at the end of the TP-AGB phase of the companion). |
| In the text | |
|
Fig. A.1. Photometric observations of BD+79°156 (left panel) and o1 Ori (right panel) compared with the synthetic spectral energy distribution generated using the MARCS model atmospheres with the parameters listed in Table 1. All photometric observations were retrieved from SIMBAD (Wenger et al. 2000). We note that in the two stars, the evident UV excess is in the bluest flux point. |
| In the text | |
Current usage metrics show cumulative count of Article Views (full-text article views including HTML views, PDF and ePub downloads, according to the available data) and Abstracts Views on Vision4Press platform.
Data correspond to usage on the plateform after 2015. The current usage metrics is available 48-96 hours after online publication and is updated daily on week days.
Initial download of the metrics may take a while.