Fig. 3.
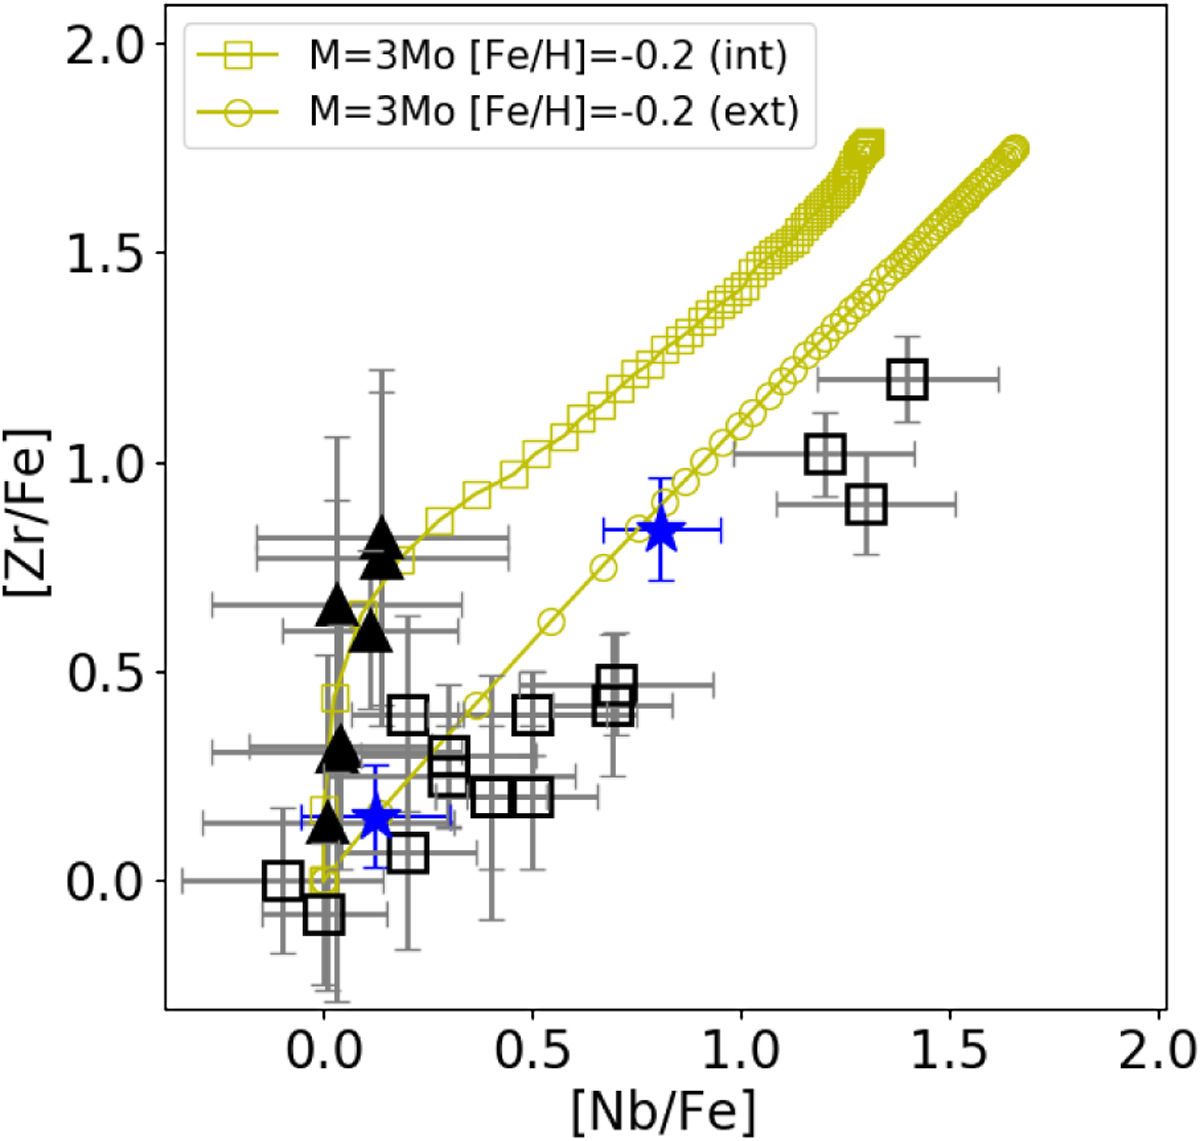
[Zr/Fe] vs [Nb/Fe] ratios for the sample stars (blue star symbols), as compared with intrinsic (triangles) and extrinsic (open squares) S stars from Shetye et al. (2018, 2019). The yellow-green curves are the nucleosynthesis predictions from STAREVOL for 3 M⊙, [Fe/H] = −0.2 models. Each symbol along these curves represents a thermal pulse. The 2 M⊙ models completely overlap the 3 M⊙ ones, but they only reach up to [Zr/Fe] ∼ 1.3.
Current usage metrics show cumulative count of Article Views (full-text article views including HTML views, PDF and ePub downloads, according to the available data) and Abstracts Views on Vision4Press platform.
Data correspond to usage on the plateform after 2015. The current usage metrics is available 48-96 hours after online publication and is updated daily on week days.
Initial download of the metrics may take a while.