Fig. A.1.
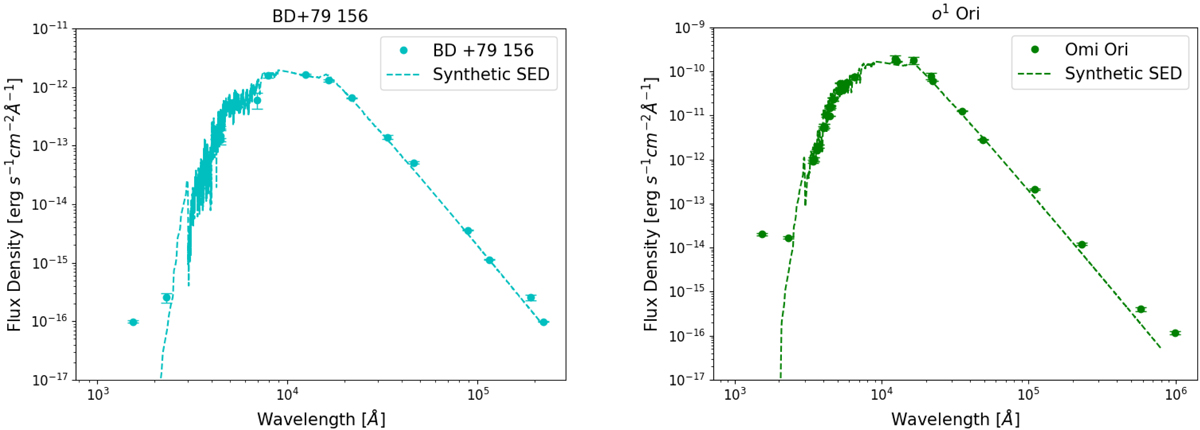
Photometric observations of BD+79°156 (left panel) and o1 Ori (right panel) compared with the synthetic spectral energy distribution generated using the MARCS model atmospheres with the parameters listed in Table 1. All photometric observations were retrieved from SIMBAD (Wenger et al. 2000). We note that in the two stars, the evident UV excess is in the bluest flux point.
Current usage metrics show cumulative count of Article Views (full-text article views including HTML views, PDF and ePub downloads, according to the available data) and Abstracts Views on Vision4Press platform.
Data correspond to usage on the plateform after 2015. The current usage metrics is available 48-96 hours after online publication and is updated daily on week days.
Initial download of the metrics may take a while.