Fig. 4.
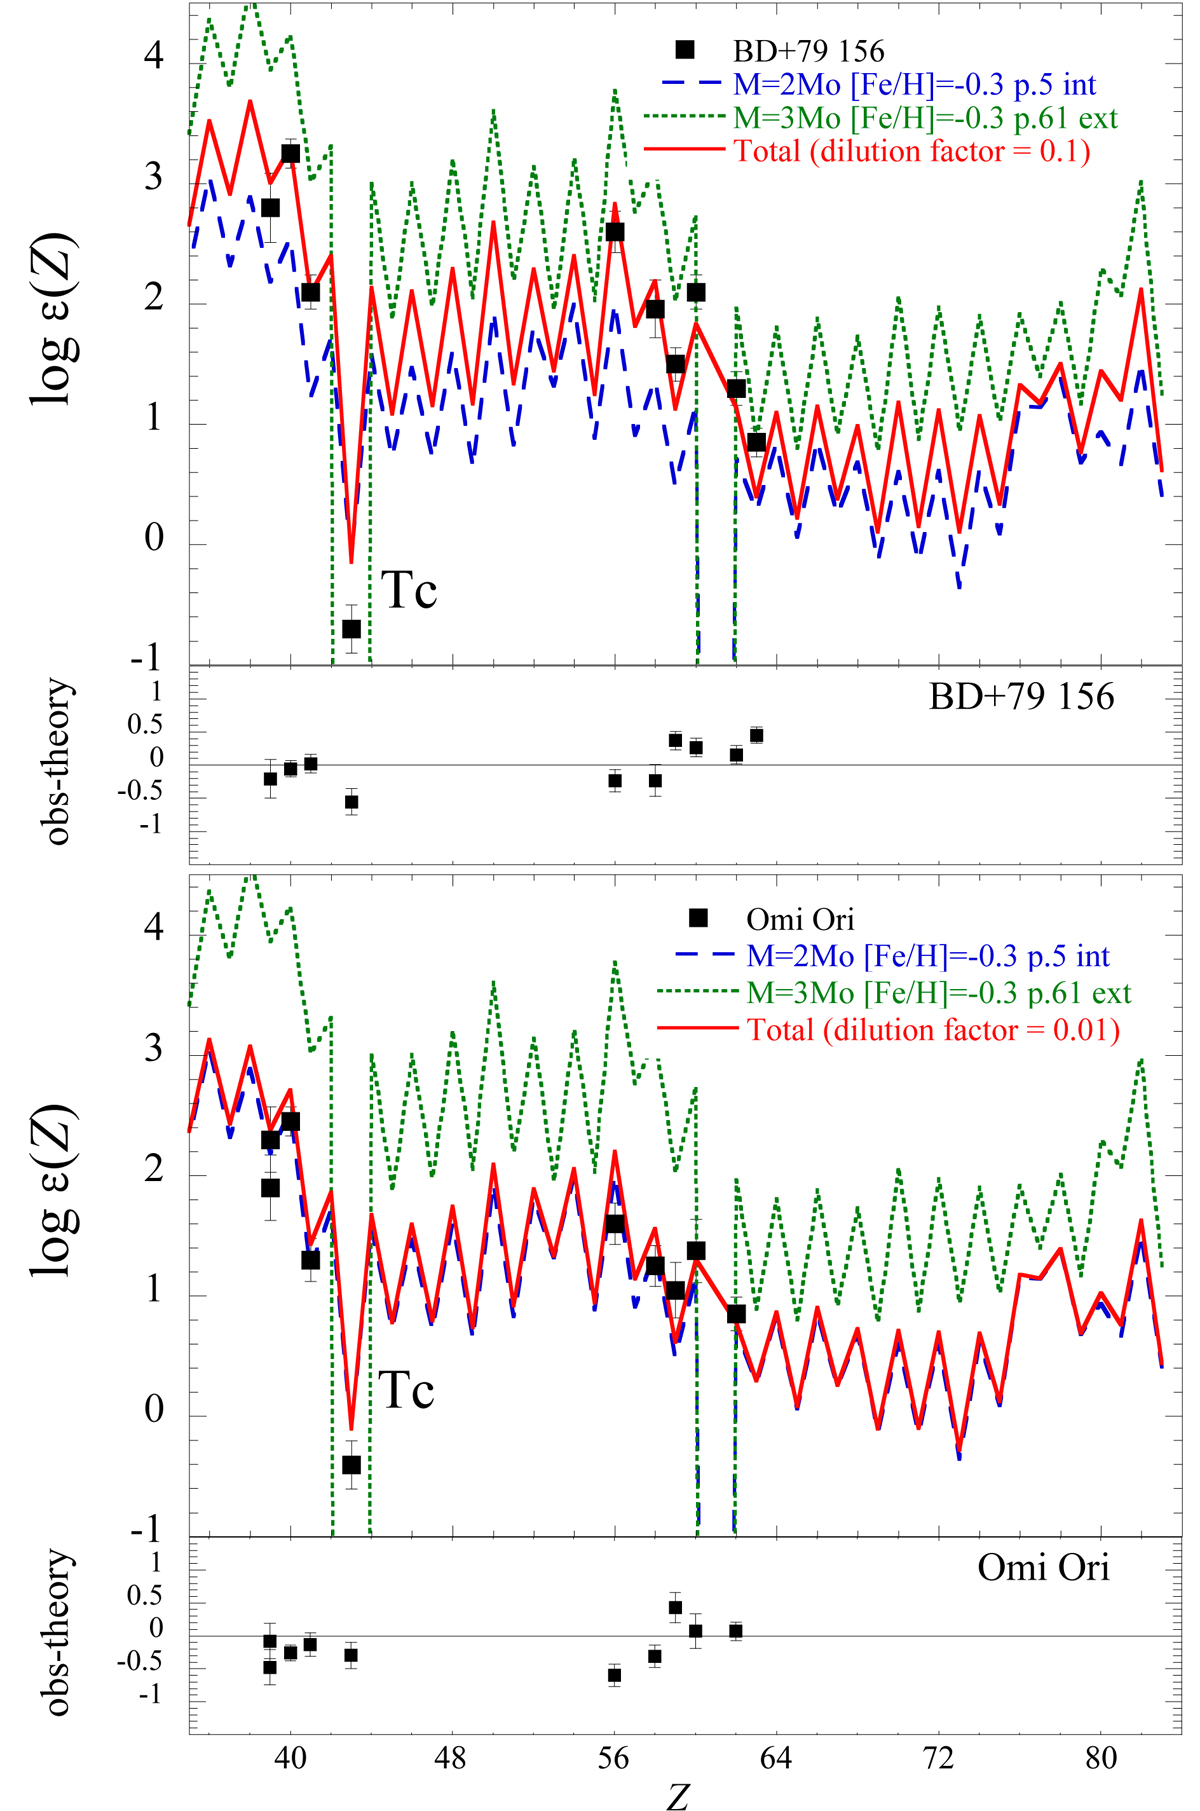
Comparison of the observed and predicted surface abundances for BD+79°156 (top panel) and o1 Ori (bottom panel) in unit of log ϵ. The best fit (solid red curves) results from the dilution of the yields from a 3 M⊙, [Fe/H] = −0.3 model within the envelope of a 2 M⊙ [Fe/H] = −0.3 intrinsic AGB star after it has experienced five thermal pulses. In both panels, “p.5 int” means that five pulses were involved in the intrinsic contribution whereas “p61 ext” means that 61 pulses occurred in the companion star (considering mass transfer at the end of the TP-AGB phase of the companion).
Current usage metrics show cumulative count of Article Views (full-text article views including HTML views, PDF and ePub downloads, according to the available data) and Abstracts Views on Vision4Press platform.
Data correspond to usage on the plateform after 2015. The current usage metrics is available 48-96 hours after online publication and is updated daily on week days.
Initial download of the metrics may take a while.