Fig. 2.
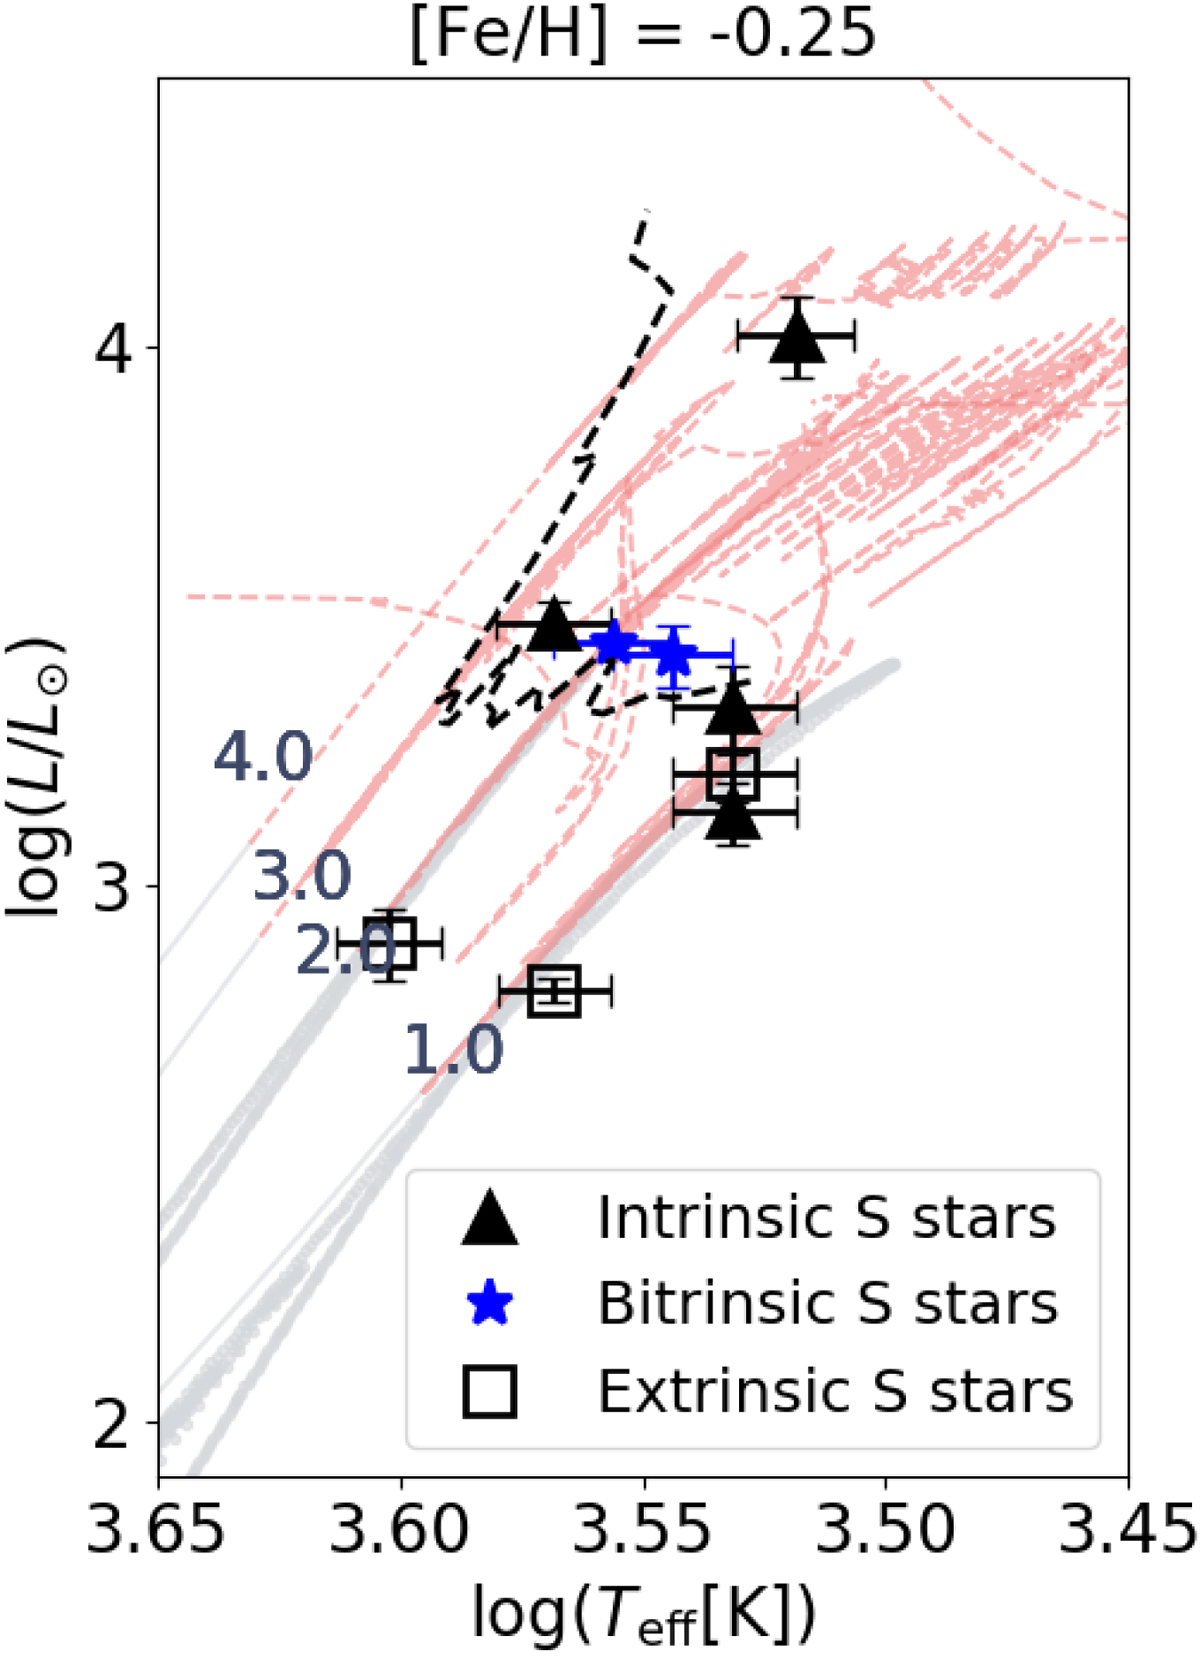
HR diagram of intrinsic (filled triangles) S stars from Shetye et al. (2018, 2019), bitrinsic S stars (blue stars), and extrinsic (open squares) S stars from Shetye et al. (2018) along with the STAREVOL evolutionary tracks corresponding to the closest grid metallicity. The red giant branch is represented by the gray dots, whereas the red dashed line corresponds to the AGB tracks. The black dashed line marks the onset of TDU.
Current usage metrics show cumulative count of Article Views (full-text article views including HTML views, PDF and ePub downloads, according to the available data) and Abstracts Views on Vision4Press platform.
Data correspond to usage on the plateform after 2015. The current usage metrics is available 48-96 hours after online publication and is updated daily on week days.
Initial download of the metrics may take a while.