| Issue |
A&A
Volume 634, February 2020
|
|
|---|---|---|
| Article Number | A129 | |
| Number of page(s) | 11 | |
| Section | Interstellar and circumstellar matter | |
| DOI | https://doi.org/10.1051/0004-6361/201935377 | |
| Published online | 27 February 2020 | |
Characterization of mid-infrared polarization due to scattering in protoplanetary disks
1
Institute of Theoretical Physics and Astrophysics, University of Kiel,
Leibnizstraße 15,
24118
Kiel,
Germany
e-mail: This email address is being protected from spambots. You need JavaScript enabled to view it.
2
CEA Saclay - Service d’Astrophysique, Orme des Merisiers,
Bât 709,
91191
Gif-sur-Yvette,
France
Received:
27
February
2019
Accepted:
2
October
2019
Abstract
Context. It is generally assumed that magnetic fields play an important role in the formation and evolution of protoplanetary disks. One way of observationally constraining magnetic fields is to measure polarized emission and absorption produced by magnetically aligned elongated dust grains. The fact that radiation also becomes linearly polarized by light scattering at optical to millimeter wavelengths complicates magnetic field studies.
Aims. We characterize the linear polarization of mid-infrared radiation due to scattering of the stellar radiation and dust thermal re-emission radiation (self-scattering).
Methods. We computed the radial polarization profiles at wavelengths across the N and Q bands for a broad range of circumstellar disk configurations. These simulations served as a basis to analyze the correlations between selected disk parameters and the resulting linear polarization.
Results. We find that the thermal re-emission radiation is stronger than the scattered stellar radiation for disks with inner holes smaller than ~10 au within the considered parameter range. The mid-infrared polarization due to scattering shows several clear trends: for scattered stellar radiation only, the linear polarization degree decreases slightly with increasing radial distance, while it increases with radial distance for thermal re-emission radiation only and for a combination of scattered stellar radiation and thermal re-emission radiation. The linear polarization degree decreases with increasing disk flaring and luminosity of the central star. An increasing inner radius shifts the increase of the linear polarization degree further outside, while a larger scale height increases the linear polarization degree for small radial distances and decreases this degree further outside. For longer wavelengths, i.e., toward the Q band in our study, the linear polarization degree converges more slowly.
Conclusions. We found several clear trends for polarization due to scattering. These trends are the basis to distinguish polarization due to scattering from polarization due to dichroic emission and absorption.
Key words: scattering / methods: numerical / protoplanetary disks / polarization / radiative transfer
© ESO 2020
1 Introduction
It is generally assumed that magnetic fields play an important role in the formation and evolution of protoplanetary disks. For example, magnetic fields can cause strong magnetic braking, hindering the formation of a centrifugally supported disk (Galli et al. 2006). A magnetic field oriented vertically with respect to the disk midplane increases angular momentum transport in accretion disks by means of magnetorotational instability even in ideal magnetohydrodynamics (MHD). In nonideal MHD simulations, the presence of a vertical magnetic field is important to provide accretion rates that are consistent with observations (Simon et al. 2013). Despite this importance, magnetic fields in protoplanetary disks are still poorly constrained observationally (Stephens et al. 2017).
One way of observationally constraining magnetic fields is to measure polarized emission produced by dichroic emission and absorption by magnetically aligned elongated dust grains (Cho & Lazarian 2007). The polarization state of the radiation is described by its linear and circular component, where the latter is usually neglected because it is significantly weaker than the former. Another established method relies on measuring the Zeeman splitting of spectral lines (Brauer et al. 2017). By comparing the derivative of the flux profile with the circularly polarized emission, it provides the line-of-sight magnetic field strength (Crutcher et al. 1993). The total magnetic field can be derived by combining Zeeman observations with complimentary observations of linear polarization (Heiles & Haverkorn 2012). However, the requirements for spatially resolved Zeeman observations cannot be met with current instruments (Brauer et al. 2017). Only spatially unresolved observations are predicted to be feasible under certain circumstances.
Most polarization observations were done in the submillimeter wavelength regime. Rao et al. (2014) obtained spatially resolved polarization observations of IRAS 16293–2422 using the Submillimeter Array. The magnetic field derived from this observation suggests a complex field structure. For HL Tau, analysis of spatially resolved polarization observations at 1.25 mm (Stephens et al. 2014) shows that the orientation of the magnetic field is coincident with the major axis of the disk.
Polarization in the mid-infrared (mid-IR) provides an alternative approach to study these fields (Smith et al. 2000). Protoplanetary disks are optically thick in the mid-IR (Chiang & Goldreich 1997), allowing for the probing of upper disk layers. This is useful to study the alignment of (sub-)micron sized grains with superparamagnetic inclusions because their alignment with the magnetic field is predicted to be possible there (Tazaki et al. 2017). Up to now, there are only a few spatially resolved polarization observations in the mid-IR (e.g., Li et al. 2016). However, spatially unresolved observations in this wavelength range can be used to constrain the magnetic field as well (Li et al. 2018).
However, polarized emission is not produced by dichroic emission and absorption alone, but also by scattering of stellar radiation and the thermal re-emission radiation of the dust, known as “self-scattering” (Kataoka et al. 2015). Spectropolarimetry can help to distinguish dichroic emission from absorption (Aitken et al. 2004; Zhang et al. 2017), while distinguishing scattering from dichroic emission and absorption is less straightforward (Yang et al. 2016). Scattering is often neglected in the mid-IR. Yet, mid-IR polarization observations of AB Aur (Li et al. 2016) indicate that both polarization mechanisms are at work: dichroic emission and absorption within the inner ~ 80 au around the central star and scattering at larger radial distances.
In addition, recent follow-up studies of HL Tau have shown that the 870 μm emission could arise solely from dust scattering (Stephens et al. 2017), while the emission at 1.3 mm shows signs of both scattering and dichroic emission and absorption. Therefore, a reliable analysis of polarization observations must take scattering into account.
To allow for the distinction of polarization due to scattering from dichroic emission and absorption, the characterization of the polarization caused by scattering alone is necessary. In the current study we investigate the dependence of the linear, wavelength-dependent polarization degree on selected parameters describing the central star and disk structure.
This paper is organized as follows: in Sect. 2, the applied Monte Carlo radiative transfer code as well as the disk and dust setup are described. In Sect. 3, we analyze the results from our simulations. Afterward, in Sect. 4, we discuss how our results can help to distinguish scattering from dichroic emission and absorption. Finally, in Sect. 5, we summarize our results.
2 Setup
In Sect. 2.1, we describe the applied Monte Carlo radiative transfer code. Afterward, in Sect. 2.2, we describe the disk model used, before we describe the dust model in Sect. 2.3.
2.1 Monte Carlo radiative transfer code
The simulations presented in this article are produced with the 3D dust radiative transfer code POLARIS (Reissl et al. 20161). This code calculates the dust temperature based on the assumption of local thermodynamic equilibrium, combining the continuous absorption method proposed by Lucy (1999) and the immediate temperature correction by Bjorkman & Wood (2001). The code allows the use of multiple polarization mechanisms: first, dichroic emission and absorption by aligned elongated dust grains; second, scattering of stellar radiation; and third, self-scattering of thermal re-emission radiation. However, we solely consider scattering by spherical grains as polarization mechanism in this study.
We constructed the polarization maps as follows: in a first step, we computed the temperature structure using a Monte Carlo approach. In the second step, we computed the scattered stellar radiation and the radiative transfer of the thermal re-emission radiation based on the temperature profile computed before, taking the effect of self-scattering into account.
Model parameters.
2.2 Disk setup
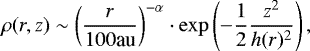
We applied a parameterized density distribution according to Shakura & Sunyaev (1973), successfully used in earlier polarization studies (e.g., Sauter et al. 2009; Gräfe et al. 2013; Kirchschlager et al. 2016; Bertrang & Wolf 2017), as follows:
 (1)
(1)
 (2)
(2)
In this equation, r is the radial distance from the central star in the disk midplane while z is the height above the midplane.
We used inner disk radii between the dust sublimation radius and those observed in transition disks (Williams & Cieza 2011). We considered dust masses ranging from 10−6 M⊙ to 10−3 M⊙, to cover the range of masses observed in the Taurus-Auriga star-forming region (Andrews & Williams 2005), which spans the widest range of masses of the clusters presented in Williams & Cieza (2011).
The outer radii considered cover the range of radii observed in Taurus-Auriga (Schaefer et al. 2009). The values for the flaring exponent β, the density distribution exponent α, and the scale height h100 are chosen to include the range of values typically found in the literature (Pinte et al. 2008; Sauter et al. 2009; Huélamo et al. 2010; Madlener et al. 2012; Liu et al. 2012; Gräfe et al. 2013; Kirchschlager et al. 2016).
We considered circumstellar disks around two different central stars, a T Tauri and a Herbig Ae star. In these systems, light scattering simulations are performed at nine logarithmically distributed wavelengths across the N and Q bands: five wavelengths from 8 to 13 μm and four from 16 to 22 μm.
If not specified otherwise, the results presented in the following are for a reference disk with an inner radius of 1 au, a dust mass of 10−4 M⊙, β = 1.2, α = 2.1, and h100 = 10 au. The inclination of the reference disk is 0° (face-on), the wavelength is 9.5 μm, and the central star is a T Tauri star (see Table 1 for details).
2.3 Dust
The dust model in our simulations consists of a homogeneous mixture of silicate and graphite adapted from Draine & Lee (1984), Laor & Draine (1993), and Weingartner & Draine (2001). The dust mixture has an assumed density of 2.5 g cm−3 and consists of 62.5% silicate and 37.5% graphite. The one-third to two-third approximation by Draine & Malhotra (1993) was applied to account for the anisotropic optical properties of graphite. We applied a grain radius distribution following n ~ a−3.5 with a lower grain radius of 5 nm and an upper grain radius of 250 nm, which is consistent with the dust parameters found for the interstellar medium (ISM; Mathis et al. 1977). Additionally, we performed simulations with an upper grain radius of 2.5 and 10 μm to account for the presence of micron-sized grains (Mulders et al. 2013). If not specified otherwise, the results presented in the following are for a reference grain size distribution with a maximum grain radius of 250 nm.
3 Results
We investigated the influence of the following parameters on the polarization state of the scattered light: the wavelength of the scattered radiation, the dust mass, and the inner disk radius. Afterward, we included the spatial dust distribution, disk inclination, and luminosity of the central star. Before assessing the influence of these parameters on the linear polarization degree (Sect. 3.2), we analyzed the ratio of the thermal dust re-emission radiation to scattered stellar radiation (Sect. 3.1).
3.1 Assessing the influence of the radiation source
We assessed the relative influence of thermal re-emission radiation versus that of scattered stellar radiation on the total flux.
Wavelength
The ratio of both contributions across the N and Q bands is shown in Fig. 1. We find two important trends. First, close to the inner rim of the disk, the ratio reaches its maximum and decreases toward larger radial distances. This results from the temperature structure of the disk. The re-emitted flux decreases faster with increasing radial distance from the central star than the scattered stellar radiation does (~ r−2, geometrical attenuation). Second, because of the increasing contribution of the thermal re-emission radiation and the decreasing contribution of the stellar irradiation, the flux ratio increases with wavelength.
The general trends are the same if the central star is a Herbig Ae star. However, the ratio is increased because of the increased heating of the disk.
Dust mass
The flux ratio increases slightly with increasing mass, because the larger dust mass increases the thermal re-emission radiation. However, the differences between the ratios are smaller than for a change in wavelength.
Outer disk radius
The flux ratio increases slightly with increasing outer radius because the lower dust density decreases the scattered stellar radiation. However, the differences between the ratios are even smaller than for a change in dust mass.
Inner disk radius
Shown in Fig. 2 is the ratio of thermal re-emission radiation to scattered stellar radiation for a fixed wavelength of 9.5 μm but differentinner radii. As the temperature at the inner rim decreases with increasing inner disk radius, the contribution of the thermal re-emission radiation decreases while that of the stellar irradiation is hardly affected. Interestingly, this trend is inverted for a disk with an inner radius of 0.1 au. That is because in this case, the location at which the temperature reaches ~ 300 K moves closer to the central star. In turn, the size of the effective mid-IR emitting region is reduced. This is illustrated in Fig. 3 where the temperature of the optical depth τ(9.5 μm) = 1 surface (as seen from above the disk) is shown.
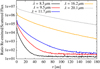 |
Fig. 1 Ratio of thermal re-emission radiation to scattered stellar radiation for wavelengths across the N and Q bands. For details, see Sect. 3.1. |
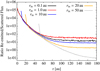 |
Fig. 2 Ratio of thermal re-emission radiation to scattered stellar radiation for different inner radii. For details, see Sect. 3.1. |
Flaring exponent β
A comparison of the flux ratios for different values of the flaring exponent β is shown in Fig. 4. For larger β, the larger increase of the scale height increases the efficiency of light scattering and thus the intensity of scattered stellar radiation. The effective absorption of the disk is increased as well, resulting in a more efficient dust heating. For small radial distances, the impact on the dust heating dominates, while the impact on the scattering dominates further outside.
Scale height h100
The fluxratio for different scale heights h100 is shown in Fig. 5. Outside ≈40 au, the flux ratio significantly increases with increasing scale height, while the differences become minor further inside. A smaller scale height corresponds to a more compact disk in the vertical direction, decreasing the width of the layer in which mid-IR radiation is produced. However, while the scattering of the stellar radiation is affected in a similar manner, the impact on the dust heating and re-emission dominates.
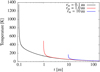 |
Fig. 3 Comparison of the temperatures at the optical depth τ(9.5 μm) = 1 surface as seen from above the disk, perpendicular to the disk midplane, vs. radial distance for disks with different inner radii (rin). For details, see Sect. 3.1. |
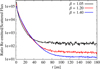 |
Fig. 4 Ratio of thermal re-emission radiation to scattered stellar radiation for disks with different flaring exponents β. For details, see Sect. 3.1. |
Density distribution exponent α
Finally, we considered the exponent α, which determines the radial decrease of the density distribution. At steeper radial dust profiles the flux ratio increases. A more detailed description of this trend is omitted because the relative differences between the ratios are smaller than for a change in β or h100.
Larger grains
Extending the grain size distribution to larger radii (2.5 and 10 μm) increases the net albedo (Fig. 12) of the dust and therefore the flux density of the scattered radiation. This decreases the ratio of thermal re-emission radiation to scattered stellar radiation, making the contribution of the scattered stellar radiation important at an inner radius of ~10 au already. However, we omitted a more detailed analysis because the trends found and discussed for small grains are not altered qualitatively.
In summary, the mid-IR thermal re-emission radiation of the dust is stronger than the scattered stellar radiation for disks with an inner radius up to ~20 au for grain size distributions with small maximum grain radii (250 nm) and up to ~10 au for grain size distributions with larger maximum grain radii (2.5, 10 μm). Hence, changes of the thermal re-emission radiation potentially have a greater influence on the resulting linear polarization degree than modifications of the scattered stellar radiation. However, for disks with larger inner radii (i.e., rin ≳ 10 au), the influence of the scattered stellar radiation may become significant. This finding can be relevant for the analysis of polarization observationsof transition disks, which often possess inner disk radii of a few dozen astronomical units (e.g., Williams & Cieza 2011). Therefore, both sources of radiation have to be taken into account when analyzing observations of scattering polarization.
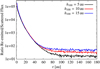 |
Fig. 5 Ratio of thermal re-emission radiation to scattered stellar radiation for disks with different scale heights h100. For details, see Sect. 3.1. |
3.2 Scattered light polarization
We investigated the dependence of the radial polarization profile on the radiation source (Sect. 3.2.1), wavelength used (Sect. 3.2.2), disk mass (Sect. 3.2.3), and inner disk radius (Sect. 3.2.4). Afterward, we investigated the dependence of the radial polarization profile on the disk flaring, density distribution, and scale height in Sect. 3.2.5, before we assessed the inclination dependence of the polarization pattern in Sect. 3.2.6 and the consequences of exchanging the central star with a Herbig Ae star in Sect. 3.2.7.
3.2.1 Source dependence of scattering polarization
The individual contributions of scattered stellar radiation and scattered thermal re-emission radiation are shown in Fig. 6. For thermal re-emission radiation, the radiation originating at the inner part of the disk is almost unpolarized because its unscattered fraction dominates. Further outside, i.e., toward regions with lower dust temperatures, the contributionfrom the direct thermal re-emission radiation decreases, while the contribution from the scattered radiation decreases less rapidly. Consequently, the linear polarization degree of the thermal re-emission radiation increases with increasing distance from the central star.
For stellar radiation, there is no unscattered contribution besides the direct photospheric emission. The radiation is significantly polarized, even in the inner part of the disk. The linear polarization degree decreases slightly with increasing radial distance because the scattering angle increasingly deviates from 90° owing to the disk flaring. Outside a radial distance of ≈160 au, where the unscattered thermal re-emission radiation is negligible, the linear polarization degree for both radiation sources becomes similar. When calculating the net polarization, taking both radiation sources (disk, star) into account, therelative contribution of both sources to the net flux (discussed in Sect. 3.1) becomes important.
In the case of grain size distributions with a larger maximum grain radius, we find the following main differences to the above scenario based on ISM-like grain sizes (see Fig. 7):
The overall polarization degree is lower. This is because the expected polarization degree for single scattering is lower for larger than for smaller grains (see Fig. 8).
The polarization degree of scattered thermal re-emission radiation increases faster with radial distance than for a grain size distribution with a smaller maximum grain radius. This is because of the higher albedo of the grain size distributions with a larger maximum grain radius (see Fig. 12), resulting in an increased contribution of scattered and therefore polarized radiation. Additionally, the area of effective mid-IR radiation, see Fig. 9, is smaller because of the steeper decrease of the temperature with radial distance. Consequently, the mid-IR bright region in which the direct (unscattered) thermal re-emission radiation dominates the net flux (and thus the net polarization) is confined to a smaller region in the case of grain size distributions with a larger maximum grain radius.
The radial polarization profiles for scattered stellar radiation and scattered thermal re-emission radiation do not converge to the same value. There are three reasons for this:
First, the stellar radiation has to pass through the optically thick inner rim of the disk, while the thermal re-emission radiation originates mainly from the surface of the disk (see Fig. 10). Therefore, the depolarization by multiple scattering is stronger for scattered stellar radiation than for scattered thermal re-emission radiation. For illustration of this effect, Fig. 11 shows that neglecting multiple scattering significantly reduces the difference between scattered stellar radiation and scattered thermal re-emission radiation. This depolarization effect is less important in the case of grain size distributions with small maximum grain radii because the albedo of these is so small that multiple scattering can be neglected (see Fig. 12).
Second, the scattering angles for scattered stellar radiation and scattered thermal re-emission radiation are different (see Fig. 10). Although this applies for grain size distributions with small maximum grain radii as well, it only has a significant impact on the net polarization for grain size distributions with larger maximum grain radii because of the increased contribution of scattered radiation.
Third, the effective radiation source for mid-IR thermal re-emission radiation is more compact for grain size distributions with larger maximum grain radii (see Fig. 9), increasing the anisotropy of the overall radiation field and thus the linear polarization degree. This effect is marginal for the large disks we consider in this work, but it can gain significance in smaller disks.
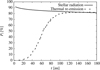 |
Fig. 6 Comparison of the radial dependence of the linear polarization degree for scattered stellar radiation and scattered thermal re-emission radiation. For details, see Sect 3.2.1. |
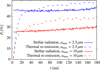 |
Fig. 7 Radial polarization profiles at 9.5 μm for the case of grain size distributions with larger maximum grain radii (2.5, 10 μm). For details, see Sect 3.2.1. |
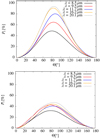 |
Fig. 8 Comparison of the expected linear polarization degree as a function of the scattering angle Θ for grain size distributions with a maximum grain radius of amax = 2.5 μm (top) and amax = 10 μm (bottom), for various wavelengths. For details, see Sects. 3.2.1 and 3.2.2. |
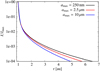 |
Fig. 9 Comparison of the radial extent of the effective mid-IR emitting region (reference wavelength: 9.5 μm). For details, see Sect 3.2.1. |
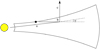 |
Fig. 10 Comparison of the path stellar radiation (a) and radiation originating from thermal re-emission (b) take toward the point of scattering and the path they take after scattering (c). The path the radiation would take without scattering is illustrated with a dashed line. The difference of the scattering angles for stellar radiation and scattered thermal re-emission radiation is denoted as γ. For details, see Sect. 3.2.1. |
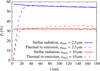 |
Fig. 11 Radial polarization profiles at 9.5 μm for the case of grain size distributions with larger maximum grain radii (2.5, 10 μm). For illustration purposes (see Sect. 3.2.1), only the fraction of the radiation that has been scattered at most once is considered, i.e., multiply scattered radiation is not considered. |
3.2.2 Wavelength dependence of scattering polarization
The resulting linear polarization degree of scattering polarization is determined by the polarization after single scattering, the albedo and the ratio of scattered radiation versus unscattered, i.e., unpolarized radiation. The wavelength dependence of the single scattering polarization is negligible because the shortest wavelength considered is much larger than the maximum grain radius. The scattering angle is expected to get closer to 90° because the height of the optical depth τ = 1-surface decreases with increasing wavelength. This would increase the linear polarization degree. However, the albedo (Fig. 12) decreases, thereby decreasing the flux density of the scattered and thus polarized radiation. In addition, the flux density of the thermal re-emission radiation increases with wavelength, thereby increasing the contribution of the unscattered radiation.
To test which mechanism dominates, the radial polarization profiles for multiple wavelengths through the N and Q bands are computed and the results are shown in Fig. 13. The linear polarization degree decreases with increasing wavelength, indicating that the change in the ratio of scattered versus unscattered radiation dominates that of the scattering angle. In addition, the linear polarization degree increases with radial distance, similar to the radial dependence of the linear polarization degree for pure thermal re-emission radiation (Sect. 3.2.1).
The radial polarization profiles for different wavelengths for the grain size distributions with larger maximum grain radii (2.5, 10 μm) are shown in Fig. 14. The differences between these profiles and the profile for grain size distributions with small maximum grain radii (250 nm; Fig. 13) can be explained as follows: for larger maximum grain radii, the albedo (Fig. 12) increases. Therefore, the flux density of the scattered radiation is significantly increased. However, the expected linear polarization degree (Fig. 8) now depends on the wavelength. Therefore, the profiles for different wavelengths now converge to different values of the linear polarization degree. In addition, the depolarization due to multiple scattering needs to be taken into account.
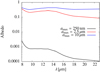 |
Fig. 12 Wavelength-dependence of the dust albedo in the considered wavelength range. For details, see Sect. 3.2.2. |
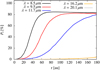 |
Fig. 13 Radial polarization profiles at wavelengths across the N and Q bands. For details, see Sect. 3.2.2. |
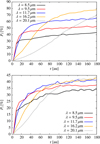 |
Fig. 14 Radial polarization profiles for the case of grain size distributions with larger maximum grain radii (top: 2.5 μm, bottom: 10 μm) at wavelengths across the N and Q bands. For details, see Sect. 3.2.2. |
3.2.3 Dependence of scattered light polarization on disk mass and outer radius
A lower disk mass results in a decreased optical depth of the disk, decreasing the height of the optical depth τ(9.5 μm) = 1 surface (as seen from above the disk). Therefore, the scattering angle is expected to be closer to 90°, increasing the linear polarization degree at larger radial distances. Simultaneously, the lower optical depth enables the light from the star to penetrate deeper into the disk, increasing the efficiency of dust heating. This increases the contribution of unscattered radiation and therefore decreases the linear polarization degree in the innermost disk regions.
The radial polarization profiles for disks with various masses are shown in Fig. 15. As expected, the linear polarization degree for disks with lower masses is decreased at small radial distances, but increased further outside.
For grain size distributions with medium (2.5 μm) maximum grain radii, the trends are similar. However, the differences are reduced because the degree of the linear polarization (resulting from single scattering) is not a simple symmetric function of the scattering angle (Fig. 8). More specifically, the maximum polarization occurs for a scattering angle slightly below 90°. For the largest maximum grain radii (10 μm), the polarization degree increases with disk mass for all radial distances because the maximum polarization occurs for a smaller scattering angle than for grains with smaller maximum grain radii.
Increasing the outer radius decreases the optical depth as well. However, the differences in the optical depth are smaller than for a change of the disk mass, resulting in a minor change of the radial polarization profile with outer radius.
3.2.4 Dependence of scattered light polarization on inner disk radius
The temperature at the inner rim (Fig. 3) decreases with increasing inner radius. This results in a decrease of the overall flux density and thus the contribution by self-scattered radiation.
In Fig. 16 we show the radial polarization profiles for disks with various inner radii. The increase of the linear polarization degree is shifted outside for larger inner radii because the inner rim of the disk is shifted further outside. Interestingly, this trend is reversed for an inner radius of 0.1 au. This is because for the disk with an inner radius of 0.1 au, the radial distance where the temperature becomes ~ 300 K is located closer to the central star than for the disk with an inner radius of 1 au. As a result, the size of the effective mid-IR emitting region is reduced. Grain size distributions with larger maximum grain radii show similar trends. However, the maximum polarization degree is altered as well for different inner radii.
In summary, the linear polarization degree increases at the smallest radial distances if the size of the effective mid-IR emitting region is maximized. Both, smaller and larger corresponding inner radii shift this increase of the linear polarization degree to larger radial distances.
3.2.5 Influence of disk flaring, density distribution, and scale height
In the preceding sections, we assumed a flaring exponent of β = 1.2, radial density profile described by α = 2.1, and scale height of h100 = 10 au. In the following, we investigate the influence of these parameters on the radial polarization profile.
Flaring exponent β
The radial dependence of the linear polarization degree for different flaring exponents β is shown in Fig. 17. The relative difference in the linear polarization degree is largest for intermediate radial distances, i.e., between ≈ 40 au and ≈ 80 au. There, the linear polarization degree decreases with increasing β, i.e., increasing disk flaring. The greater increase of the gradient of the scale height significantly increases the effectiveabsorption of the disk, resulting in a more efficient dust heating and therefore larger contribution by unscattered thermal re-emission radiation. If a grain size distribution with larger maximum grain radii is used, the trend is similar, but the differences are largest for small radial distances, i.e., inside ~ 20 au.
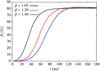 |
Fig. 17 Comparison of the radial polarization profiles for various flaring exponents. For details, see Sect. 3.2.5. |
Scale height h100
The radial dependence of the linear polarization degree for various scale heights h100 is shown in Fig. 18. For radial distances below ≈70 au, the linear polarization degree increases with increasing scale height. Further outside, i.e., for radial distances above ≈ 90 au, the linear polarization degree decreases with increasing scale height. First, a smaller scale height corresponds to a more compact disk in the vertical direction, reducing the width of the layer in which mid-IR radiation is produced. Second, the height of the τ = 1-surface is decreasedas well, decreasing the deviation of the scattering angle from 90°. For smaller radial distances, the first effect is more important, while for larger radial distances, the second dominates. For grain size distributions with larger maximum grain radii, the first effect only dominates inside a radial distance of ~ 20 au and the differences between the linear polarization degrees for various scale heights decrease.
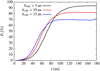 |
Fig. 18 Comparison of the radial polarization profiles for disks with various scale heights. For details, see Sect. 3.2.5. |
Radial density parameter α
A steeper radial dust profile increases the linear polarization degree slightly. However, a more detailed analysis is omitted in this case because this effect is negligible compared to a change in disk flaring or scale height. Grain size distributions with larger maximum grain radii show the same trends.
In summary, increasing the flaring exponent decreases the linear polarization degree at smaller radial distances, while an increasing scale height increases the linear polarization degree further inside and decreases it further outside.
3.2.6 Inclination dependence of the polarization pattern
In the preceding chapters, we considered a face-on disk, causing a centro-symmetric polarization pattern as shown in Fig. 19. Before showing how the polarization pattern changes with inclination, we briefly discuss the change of the net linear polarization degree with inclination. This value is zero for a face-on disk owing to the centro-symmetry of the polarization pattern. With increasing inclination, the net linear polarization degree increases because the polarization pattern gets asymmetric. However, this is difficult to observe because, below an inclination of ~ 70°, the net linear polarization degree is very low (<1%). For inclinations above ~70°, the net linear polarization degree is larger but the net mid-infrared flux, resulting from scattering in the upper disk layers only becomes very low.
We now show the polarization maps for three different inclinations in Fig. 20, right. The part of the disk that is further away from the observer (“far edge” in the following) is shown in the upper half of each polarization map, while the part that is closer to the observer (“close edge”) is shown in the lower half.
For an inclination of 20°, the linear polarization degree for the close edge of the disk is decreased compared to the face-on disk because an increasing fraction of the radiation is scattered at angles ≷ 90°. The linear polarization degree for the far-edge is increased because the scattering angle is closer to 90°. At the same time, the orientation of the polarization vectors remains unchanged. Increasing the disk inclination, the linear polarization degree for the close edge decreases with the exception of a band in the lower part of the map that is produced by the flared outer rim of the disk. This band has a high linear polarization degree, but it is difficult to observe because of the low flux density (Fig. 20, left). The linear polarization degree of the far edge decreases as well because the scattering angle deviates from perpendicular again. However, the distribution of the directions of the polarization vectors remains qualitatively unchanged.
For grain size distributions with larger maximum grain radii, the polarization degree is decreased, but the overall polarization pattern is unchanged. This is illustrated in Fig. 21 for amax = 2.5 μm.
In summary, increasing the disk inclination increases the net linear polarization degree. The polarization maps become asymmetric with increasing inclination, and the linear polarization degree, especially of the close edge, is decreased. However, the distribution of the directions of the polarization vectors remains qualitatively unchanged.
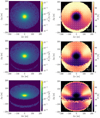 |
Fig. 20 Intensity maps (left) and polarization maps (right) for an inclination of 20° (top), 40° (center) and 60° (bottom). For details, see Sect. 3.2.6. |
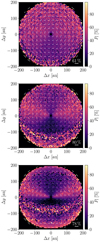 |
Fig. 21 Polarization maps for a grain size distribution with a maximum grain radius of 2.5 μm and an inclination of 20° (top), 40° (center) and 60° (bottom). For details, see Sect. 3.2.6. |
3.2.7 Herbig Ae star
Herbig Ae stars are significantly more luminous than T Tauri stars. Hence, the hotter disks are stronger and larger mid-IR radiation sources than their T Tauri counterparts. At the same time, unscattered thermal re-emission radiation is expected to dominate over the scattered radiation out to larger radial distances. This lowers the expected linear polarization degree at a given radial distance from the central star. To verify this hypothesis, we computed the radial polarization profiles for a disk heated by a Herbig Ae star and grain species with multiple maximum grain radii and show these in Fig. 22. The polarization profile for amax = 2.5 μm is omitted because the results are similar to the case of amax = 10 μm.
As shown in Fig. 22, the mid-IR radiation from disks heated by a Herbig Ae star is almost unpolarized for grain size distributions with small maximum grain radii. For grain size distributions with larger maximum grain radii, the scattered radiation is much stronger. Therefore, the radiation of the disk is significantly polarized even if the central star is a Herbig Ae star. The other trends are similar to those for the T Tauri star. Only the increase of the linear polarization degree happens at the smallest radial distance for an inner radius of ~ 20 au because the size of the effective mid-IR emitting region is maximized for this inner radius (see Fig. 23). For grains with larger maximum grain radii (2.5 μm and 10 μm), the linear polarization degree increases at the smallest radial distance for an inner radius of ~ 10 au.
In conclusion, replacing the T Tauri star by a Herbig Ae star substantially increases the flux density but decreases the linear polarization degree for grain size distributions with small maximum grain radii. The inner radius at which the increase of the linear polarization degree happens furthest inside is ~ 20 au for the stellar parameters provided in this work and ~10 au for grain size distributions with a larger maximum grain radius. The other results are similar to those for disks heated by a T Tauri star.
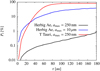 |
Fig. 22 Comparison of the radial polarization profiles for disks around the considered T Tauri and a Herbig Ae star. For details, see Sect. 3.2.7. |
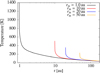 |
Fig. 23 Comparison of the temperatures at the τ(9.5 μm) = 1 surface as seen from above the disk, perpendicular to the disk midplane, vs. radial distance for multiple inner radii and a Herbig Ae star as central star. For details, see Sect. 3.2.7. |
4 Discussion
This study was motivated by the fact that the analysis of the linear continuum polarization potentially allows us to assess the magnetic field of a protoplanetary disk. While this assumption is based on the impact of magnetically aligned grains on the polarization state of the observable radiation, the role of scattering of radiation (stellar, thermal (dust) re-emission) should be known. In the following, we discuss our results for scattered light polarization in view of their potential to distinguish between both polarization mechanisms:
- 1.
For scattering, the linear polarization degree increases with radial distance. In contrast, the linear polarization degree in the case of dichroic emission and absorption shows a weaker and less distinct dependence on radial distance (Li et al. 2016).
- 2.
The linear polarization degree decreases with increasing wavelength for grains with small maximum grain radii (250 nm). For larger maximum grain radii (2.5, 10 μm), it converges to the final value more slowly, but this final value depends on both the wavelength and maximum dust grain radius. In the context of the disk and dust model investigated by Aitken et al. (2004), the authors found that the linear polarization degree has a maximum at a wavelength between 10 and 11 μm and decreases for longer wavelengths. However, at wavelengths above the N band, it is possible that the linear polarization degree increases with increasing wavelength (Cho & Lazarian 2007). Using this trend to distinguish scattering polarization from polarization due to dichroic emission and absorption requires independent measurements of the dust grain properties (e.g., composition).
- 3.
The polarization vectors for polarization by scattering show a tangential pattern, while the polarization vectors due to dichroic emission and absorption depend on the alignment of the dust grains (Tazaki et al. 2017). This alignment depends on the magnetic field. Therefore, the polarization vectors can also be used to obtain information about the magnetic field structure. However, if the dust grains are magnetically poor and align only with the radiation direction, the polarization vectors can be tangential even if the polarization is caused by dichroic emission and absorption. Therefore, an analysis of the polarization vectors alone does not always yield distinct results.
In summary, polarization due to dichroic emission and absorption and scattering shows different trends, potentially allowing us to distinguish both polarization mechanisms. However, we recommend using multiple trends to make distinguishing the polarization mechanisms more clear because of the potential for ambiguity.
5 Conclusions
In the first part of our mid-IR study (Sect. 3.1), we computed the ratio of thermal re-emission radiation to scattered stellar radiation to determine the dominating radiation source. We find that thermal re-emission radiation is stronger than scattered stellar radiation for disks with an inner radius below ~ 10 au, a T Tauri star as the central star and a wavelength of 9.5 μm. Therefore, self-scattering potentially has a greater influence on the resulting linear polarization degree than scattered stellar radiation. However, the scattered stellar radiation may become significant in the case of transition disks with sufficiently large inner radii. Using a Herbig Ae star as central star significantly increases the thermal re-emission radiation and therefore also the flux ratio.
In the second part, we performed studies of the polarization due to scattering in the mid-IR. The following trends were identified based on these studies:
- 1.
For scattered stellar radiation only, the linear polarization degree slowly decreases with radial distance (Sect. 3.2.1).
- 2.
For thermal re-emission radiation and for combined thermal re-emission radiation and scattered stellar radiation, the linear polarization degree increases with radial distance (Sects. 3.2.1 and 3.2.2). In contrast, the linear polarization degree due to dichroic emission and absorption shows less distinct and less strong dependence on radial distance (Li et al. 2016).
- 3.
The linear polarization degree decreases for longer wavelengths and grain size distributions with small maximum grain radii (250 nm). For grain size distributions with larger maximum grain radii (2.5, 10 μm), this degree converges slower. The polarization degree at large radial distances from the star depends on both the wavelength and the maximum dust grain radius (Sect. 3.2.2). Using this trend to distinguish scattering polarization from polarization due to dichroic emission and absorption requires using an independent method to assess the dust grain properties (e.g., composition).
- 4.
The linear polarization degree increases further inside for larger dust masses, while the maximum linear polarization degree decreases (Sect. 3.2.3). For grain size distributions with the largest maximum dust grain radius, the linear polarization degree increases with dust mass for all radial distances.
- 5.
The linear polarization degree increases at the smallest radial distance if the size of the effective radiation source is maximized. For smaller and larger corresponding inner radii, the linear polarization degree increases further outside (Sect. 3.2.4). For grain size distributions with larger maximum dust grain radii, the maximum polarization degree depends on the inner disk radius.
- 6.
An increase of the flaring exponent β decreases the linear polarization degree inside a radial distance of ≈ 100 au (grain size distributions with small maximum grain radii) and ≈20 au (grain size distributions with larger maximum grain radii; Sect. 3.2.5).
- 7.
An increase of the scale height h100 increases the linear polarization degree inside a radial distance of ≈ 70 au for grain size distributions with small maximum grain radii and ≈20 au for grain size distributions with larger maximum grain radii. Further outside, at radial distances above ≈ 90 au for grain size distributions with small maximum grain radii and ≈30 au for grain size distributions with larger maximum grain radii, an increasing scale height decreases the linear polarization degree (Sect. 3.2.5).
- 8.
The net linear polarization degree increases with disk inclination. The beginning of the large increase of the net linear polarization degree at an angle of ≈70° coincides with that in the optical depth between the star and the observer (Sect. 3.2.6).
- 9.
The polarization vectors show a tangential pattern (Sect. 3.2.6). This distribution of directions remains qualitatively unchanged for inclined disks. For polarization due to dichroic emission and absorption, the polarization vectors depend on the alignment of the dust grains (Tazaki et al. 2017). Hence, if the magnetic field is strong enough, the polarization vectors significantly differ from a tangential pattern.
- 10.
With increasing inclination, the linear polarization degree at the close edge of the polarization map is decreased, while that at the far edge is first increased and then decreased (Sect. 3.2.6).
- 11.
Using a Herbig Ae star instead of a T Tauri star as central star significantly decreases the polarization degree for grain size distributions with small maximum grain radii. For larger maximum grain radii, the effect is less great (Sect. 3.2.7).
Three of these trends (items 2, 3, and 9) potentially enable us to distinguish polarization due to scattering from polarization due to dichroic emission and absorption. However, we recommend using multiple trends to distinguish the polarization mechanisms more clearly. Using these trends requires a sufficient spatial resolution to map structures on sub-disk scales (≈ 50 au). Additionally, using item 3 requires an independent method to constrain the dust grain properties.
Acknowledgements
The authors acknowledge support by the DFG program WO857/18-1.
References
- Aitken, D. K., Hough, J. H., Roche, P. F., Smith, C. H., & Wright, C. M. 2004, MNRAS, 348, 279 [NASA ADS] [CrossRef] [Google Scholar]
- Andrews, S. M., & Williams, J. P. 2005, ApJ, 631, 1134 [NASA ADS] [CrossRef] [Google Scholar]
- Bertrang, G. H.-M., & Wolf, S. 2017, MNRAS, 469, 2869 [NASA ADS] [CrossRef] [Google Scholar]
- Bjorkman, J. E., & Wood, K. 2001, ApJ, 554, 615 [NASA ADS] [CrossRef] [Google Scholar]
- Brauer, R., Wolf, S., & Flock, M. 2017, A&A, 607, A104 [NASA ADS] [CrossRef] [EDP Sciences] [Google Scholar]
- Chiang, E. I., & Goldreich, P. 1997, ApJ, 490, 368 [NASA ADS] [CrossRef] [Google Scholar]
- Cho, J., & Lazarian, A. 2007, ApJ, 669, 1085 [NASA ADS] [CrossRef] [Google Scholar]
- Crutcher, R. M., Troland, T. H., Goodman, A. A., et al. 1993, ApJ, 407, 175 [NASA ADS] [CrossRef] [Google Scholar]
- Draine, B. T., & Lee, H. M. 1984, ApJ, 285, 89 [Google Scholar]
- Draine, B. T., & Malhotra, S. 1993, ApJ, 414, 632 [NASA ADS] [CrossRef] [Google Scholar]
- Galli, D., Lizano, S., Shu, F. H., & Allen, A. 2006, ApJ, 647, 374 [NASA ADS] [CrossRef] [Google Scholar]
- Gräfe, C., Wolf, S., Guilloteau, S., et al. 2013, A&A, 553, A69 [NASA ADS] [CrossRef] [EDP Sciences] [Google Scholar]
- Heiles, C., & Haverkorn, M. 2012, Space Sci. Rev., 166, 293 [NASA ADS] [CrossRef] [EDP Sciences] [Google Scholar]
- Huélamo, N., Bouy, H., Pinte, C., et al. 2010, A&A, 523, A42 [NASA ADS] [CrossRef] [EDP Sciences] [Google Scholar]
- Kataoka, A., Muto, T., Momose, M., et al. 2015, ApJ, 809, 78 [NASA ADS] [CrossRef] [Google Scholar]
- Kirchschlager, F., Wolf, S., & Madlener, D. 2016, MNRAS, 462, 858 [NASA ADS] [CrossRef] [Google Scholar]
- Laor, A., & Draine, B. T. 1993, ApJ, 402, 441 [NASA ADS] [CrossRef] [Google Scholar]
- Li, D., Pantin, E., Telesco, C. M., et al. 2016, ApJ, 832, 18 [NASA ADS] [CrossRef] [Google Scholar]
- Li, D., Telesco, C. M., Zhang, H., et al. 2018, MNRAS, 473, 1427 [NASA ADS] [CrossRef] [Google Scholar]
- Liu, Y., Madlener, D., Wolf, S., Wang, H., & Ruge, J. P. 2012, A&A, 546, A7 [NASA ADS] [CrossRef] [EDP Sciences] [Google Scholar]
- Lucy, L. B. 1999, A&A, 344, 282 [NASA ADS] [Google Scholar]
- Madlener, D., Wolf, S., Dutrey, A., & Guilloteau, S. 2012, A&A, 543, A81 [NASA ADS] [CrossRef] [EDP Sciences] [Google Scholar]
- Mathis, J. S., Rumpl, W., & Nordsieck, K. H. 1977, ApJ, 217, 425 [NASA ADS] [CrossRef] [Google Scholar]
- Mulders, G. D., Min, M., Dominik, C., Debes, J. H., & Schneider, G. 2013, A&A, 549, A112 [NASA ADS] [CrossRef] [EDP Sciences] [Google Scholar]
- Pinte, C., Padgett, D. L., Ménard, F., et al. 2008, A&A, 489, 633 [NASA ADS] [CrossRef] [EDP Sciences] [Google Scholar]
- Rao, R., Girart, J. M., Lai, S.-P., & Marrone, D. P. 2014, ApJ, 780, L6 [NASA ADS] [CrossRef] [Google Scholar]
- Reissl, S., Wolf, S., & Brauer, R. 2016, A&A, 593, A87 [NASA ADS] [CrossRef] [EDP Sciences] [Google Scholar]
- Sauter, J., Wolf, S., Launhardt, R., et al. 2009, A&A, 505, 1167 [NASA ADS] [CrossRef] [EDP Sciences] [Google Scholar]
- Schaefer, G. H., Dutrey, A., Guilloteau, S., Simon, M., & White, R. J. 2009, ApJ, 701, 698 [NASA ADS] [CrossRef] [Google Scholar]
- Shakura, N. I., & Sunyaev, R. A. 1973, A&A, 24, 337 [NASA ADS] [Google Scholar]
- Simon, J. B., Bai, X.-N., Armitage, P. J., Stone, J. M., & Beckwith, K. 2013, ApJ, 775, 73 [NASA ADS] [CrossRef] [Google Scholar]
- Smith, C. H., Wright, C. M., Aitken, D. K., Roche, P. F., & Hough, J. H. 2000, MNRAS, 312, 327 [NASA ADS] [CrossRef] [Google Scholar]
- Stephens, I. W., Looney, L. W., Kwon, W., et al. 2014, Nature, 514, 597 [NASA ADS] [CrossRef] [Google Scholar]
- Stephens, I. W., Yang, H., Li, Z.-Y., et al. 2017, ApJ, 851, 55 [NASA ADS] [CrossRef] [Google Scholar]
- Tazaki, R., Lazarian, A., & Nomura, H. 2017, ApJ, 839, 56 [NASA ADS] [CrossRef] [Google Scholar]
- Weingartner, J. C., & Draine, B. T. 2001, ApJ, 548, 296 [NASA ADS] [CrossRef] [Google Scholar]
- Williams, J. P., & Cieza, L. A. 2011, ARA&A, 49, 67 [NASA ADS] [CrossRef] [Google Scholar]
- Yang, H., Li, Z.-Y., Looney, L. W., et al. 2016, MNRAS, 460, 4109 [NASA ADS] [CrossRef] [Google Scholar]
- Zhang, H., Telesco, C. M., Pantin, E., et al. 2017, MNRAS, 465, 2983 [NASA ADS] [CrossRef] [Google Scholar]
Available online at http://www1.astrophysik.uni-kiel.de/~polaris/
All Tables
All Figures
|
Fig. 1 Ratio of thermal re-emission radiation to scattered stellar radiation for wavelengths across the N and Q bands. For details, see Sect. 3.1. |
| In the text | |
|
Fig. 2 Ratio of thermal re-emission radiation to scattered stellar radiation for different inner radii. For details, see Sect. 3.1. |
| In the text | |
|
Fig. 3 Comparison of the temperatures at the optical depth τ(9.5 μm) = 1 surface as seen from above the disk, perpendicular to the disk midplane, vs. radial distance for disks with different inner radii (rin). For details, see Sect. 3.1. |
| In the text | |
|
Fig. 4 Ratio of thermal re-emission radiation to scattered stellar radiation for disks with different flaring exponents β. For details, see Sect. 3.1. |
| In the text | |
|
Fig. 5 Ratio of thermal re-emission radiation to scattered stellar radiation for disks with different scale heights h100. For details, see Sect. 3.1. |
| In the text | |
|
Fig. 6 Comparison of the radial dependence of the linear polarization degree for scattered stellar radiation and scattered thermal re-emission radiation. For details, see Sect 3.2.1. |
| In the text | |
|
Fig. 7 Radial polarization profiles at 9.5 μm for the case of grain size distributions with larger maximum grain radii (2.5, 10 μm). For details, see Sect 3.2.1. |
| In the text | |
|
Fig. 8 Comparison of the expected linear polarization degree as a function of the scattering angle Θ for grain size distributions with a maximum grain radius of amax = 2.5 μm (top) and amax = 10 μm (bottom), for various wavelengths. For details, see Sects. 3.2.1 and 3.2.2. |
| In the text | |
|
Fig. 9 Comparison of the radial extent of the effective mid-IR emitting region (reference wavelength: 9.5 μm). For details, see Sect 3.2.1. |
| In the text | |
|
Fig. 10 Comparison of the path stellar radiation (a) and radiation originating from thermal re-emission (b) take toward the point of scattering and the path they take after scattering (c). The path the radiation would take without scattering is illustrated with a dashed line. The difference of the scattering angles for stellar radiation and scattered thermal re-emission radiation is denoted as γ. For details, see Sect. 3.2.1. |
| In the text | |
|
Fig. 11 Radial polarization profiles at 9.5 μm for the case of grain size distributions with larger maximum grain radii (2.5, 10 μm). For illustration purposes (see Sect. 3.2.1), only the fraction of the radiation that has been scattered at most once is considered, i.e., multiply scattered radiation is not considered. |
| In the text | |
|
Fig. 12 Wavelength-dependence of the dust albedo in the considered wavelength range. For details, see Sect. 3.2.2. |
| In the text | |
|
Fig. 13 Radial polarization profiles at wavelengths across the N and Q bands. For details, see Sect. 3.2.2. |
| In the text | |
|
Fig. 14 Radial polarization profiles for the case of grain size distributions with larger maximum grain radii (top: 2.5 μm, bottom: 10 μm) at wavelengths across the N and Q bands. For details, see Sect. 3.2.2. |
| In the text | |
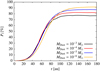 |
Fig. 15 Radial polarization profiles for various disk masses. For details, see Sect. 3.2.3. |
| In the text | |
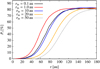 |
Fig. 16 Radial polarization profiles for various inner disk radii. For details, see Sect. 3.2.4. |
| In the text | |
|
Fig. 17 Comparison of the radial polarization profiles for various flaring exponents. For details, see Sect. 3.2.5. |
| In the text | |
|
Fig. 18 Comparison of the radial polarization profiles for disks with various scale heights. For details, see Sect. 3.2.5. |
| In the text | |
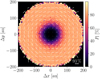 |
Fig. 19 Polarization map for the reference disk. For details, see Sect. 3.2.6. |
| In the text | |
|
Fig. 20 Intensity maps (left) and polarization maps (right) for an inclination of 20° (top), 40° (center) and 60° (bottom). For details, see Sect. 3.2.6. |
| In the text | |
|
Fig. 21 Polarization maps for a grain size distribution with a maximum grain radius of 2.5 μm and an inclination of 20° (top), 40° (center) and 60° (bottom). For details, see Sect. 3.2.6. |
| In the text | |
|
Fig. 22 Comparison of the radial polarization profiles for disks around the considered T Tauri and a Herbig Ae star. For details, see Sect. 3.2.7. |
| In the text | |
|
Fig. 23 Comparison of the temperatures at the τ(9.5 μm) = 1 surface as seen from above the disk, perpendicular to the disk midplane, vs. radial distance for multiple inner radii and a Herbig Ae star as central star. For details, see Sect. 3.2.7. |
| In the text | |
Current usage metrics show cumulative count of Article Views (full-text article views including HTML views, PDF and ePub downloads, according to the available data) and Abstracts Views on Vision4Press platform.
Data correspond to usage on the plateform after 2015. The current usage metrics is available 48-96 hours after online publication and is updated daily on week days.
Initial download of the metrics may take a while.