| Issue |
A&A
Volume 633, January 2020
|
|
|---|---|---|
| Article Number | A161 | |
| Number of page(s) | 10 | |
| Section | Extragalactic astronomy | |
| DOI | https://doi.org/10.1051/0004-6361/201935962 | |
| Published online | 28 January 2020 | |
Large-scale environment of FR 0 radio galaxies
1
INAF-Osservatorio Astrofisico di Torino, Via Osservatorio 20, 10025 Pino Torinese, Italy
e-mail: This email address is being protected from spambots. You need JavaScript enabled to view it.
2
Dipartimento di Fisica, Università degli Studi di Torino, Via Pietro Giuria 1, 10125 Torino, Italy
3
Istituto Nazionale di Fisica Nucleare, Sezione di Torino, 10125 Torino, Italy
4
Consorzio Interuniversitario per la Fisica Spaziale, Via Pietro Giuria 1, 10125 Torino, Italy
5
Department of Physics and Astronomy, University of Southampton, Highfield SO17 1BJ, UK
Received:
27
May
2019
Accepted:
29
November
2019
Abstract
We explore the properties of the large-scale environment of the sources in the Faranoff-Riley class 0 catalog (FR0CAT). This sample includes 104 compact radio sources that are associated with nearby (z < 0.05) early-type galaxies. Using various estimators, we find that FR 0s are located in regions with higher than the average number of galaxies. The average galaxies density around FR 0s is a factor two lower with respect to FR I radio galaxies. This latter difference is driven by the large fraction (63%) of FR 0s that are located in groups formed by fewer than 15 galaxies. FR Is rarely (17%) inhabit an environment like this. In addition to the lack of substantial extended radio emission that defines the FR 0 class, this is the first significant difference between the properties of these two populations of low-power radio galaxies. We interpret the differences in environment between FR 0s and FR Is as due to an evolutionary link between local galaxies density, black hole spin, jet power, and extended radio emission.
Key words: galaxies: active / galaxies: jets / galaxies: elliptical and lenticular, cD
© ESO 2020
1. Introduction
The connection between the large-scale environment and the properties of extragalactic radio sources has been explored since the 1970s (e.g., Longair & Seldner 1979). Longair & Seldner found that weak radio galaxies (RGs) show no tendency of belonging to groups or clusters of galaxies. Groups or clusters are instead typical of extended powerful radio sources. Prestage & Peacock (1988) claimed that Fanaroff–Riley class II sources (Fanaroff & Riley 1974), FR IIs, as well as compact radio sources, on average lie in poorer clusters than those of class I (FR Is). Hill & Lilly (1991) found a strong evolution of the RG environment: at z = 0.5, most powerful sources are located in rich clusters, unlike what is seen at lower redshifts.
Several radio surveys that cover large areas and reach the mJy flux level became available in the past two decades, such as the Faint Images of the Radio Sky at Twenty centimeters survey (FIRST; Becker et al. 1995; Helfand et al. 2015) and the National Radio Astronomy Observatory Very Large Array Sky Survey (NVSS; Condon et al. 1998). The studies of the RG environment based on these surveys broadly confirmed the earlier results. Best (2004) found that radio active galactic nuclei (AGN) are preferentially located in galaxy groups and galaxy clusters with poor to moderate richness. Gendre et al. (2013) provided further support to the hypothesis that more local galaxies are located around FR Is than FR IIs. The authors also noted the possible presence of a link between the various optical classes of RGs (Laing et al. 1994): high-excitation galaxies (HEGs) are found almost exclusively in low-density environments, while low-excitation galaxies (LEGs) occupy a wider range of densities. Using observations from the International Low Frequency Array (LOFAR; van Haarlem et al. 2013), Croston et al. (2019) found a connection between size and luminosity at 150 MHz of the brightest radio AGN with the cluster richness. In contrast, Massaro et al. (2019a), hereafter M19, concluded that regardless of their radio morphological classification (FR I or FR II) and/or their optical classification (LEGs or HEGs), RGs in the local Universe are located in galaxy-rich large-scale environments that have similar characteristics and richness. This different result is probably driven by the different selection criteria of the samples.
These studies focused almost exclusively on bright extended RGs. However, the identification of the optical counterparts of radio sources (Best et al. 2005; Best & Heckman 2012) in FIRST and NVSS showed that the majority of them are associated with low-redshift galaxies and are unresolved (Baldi & Capetti 2009). This is a radical change in our view of the radio sky because earlier surveys (performed at lower frequency and higher flux threshold) were dominated by sources that typically extended over a scale of hundreds of kiloparsec (e.g., Hardcastle et al. 1998). The general lack of substantial extended radio emission suggested that these “compact” sources might be defined as “FR 0s” (Ghisellini 2011; Sadler et al. 2014), as a convenient way to include them into the canonical Fanaroff & Riley (1974) classification scheme of RGs.
The information on FR 0s is quite limited, even at the radio frequencies used to classify them: the available radio data are of poor resolution, and multifrequency data are available only for the FR 0s of higher flux density. As a consequence, the nature of these compact sources and their relation to the other RG classes are still unclear. In order to perform systematic studies of FR 0s, Baldi et al. (2018), hereafter BCM18, selected a sample of 104 compact radio sources, called FR0CAT, while Capetti et al. (2017) built a comparison sample of extended, edge-darkened FR I RGs (see Sect. 2 for further details on the samples selection). The number density of FR0CAT sources is five time higher than that of FR Is, which quantitatively confirms that they represent the dominant population of radio sources in the local Universe (BCM18). Baldi et al. (2018) found that the FR0CAT hosts are mostly luminous red early-type galaxies with high black hole (BH) masses (108 ≲ MBH ≲ 109 M⊙). These properties are similar to those seen for the hosts of FR Is: they are just on average a factor 1.6 less massive, but there is a large overlap between the two mass distributions.
Baldi et al. (2015, 2019) obtained high-resolution multifrequency radio images of a subsample of FR 0s extracted from FR0CAT. Although they reach an angular resolution of 0 3 (corresponding to a few hundred parsec), the majority of the FR 0s are still unresolved, while the remaining extend to only a few kiloparsec. Most of them have flat spectra, and the ratio between the core and total emission in FR 0s is ∼30 times higher than that in FR Is.
The comparison of optical line emission luminosity, a robust proxy of the radiative power of the AGN, indicates that FR 0s share the same range as FR Is, but their median radio luminosity is a factor ∼30 lower than that of FRICAT (BCM18). However, there is no sharp boundary between the properties of FR 0s and FR Is: low-luminosity RGs form a continuous distribution, from the FR 0s at the lowest ratios of the radio/line luminosity, to the FRICAT sources at intermediate ratios, and finally to the extreme values reached by the most powerful FR Is that are part of the Third Cambridge catalog (Spinrad et al. 1985). When we instead consider only the emission from the radio core, the FR 0s lie in the same region as is populated by the FR Is, indicating a common nature of the nuclei of the two groups of sources. This similarity is also supported by available X-ray observations (Torresi et al. 2018).
It therefore appears that while the host galaxies and the nuclear properties of FR 0s and FR Is are very similar, their appearance in the radio images is radically different. The origin of their different nature still remains to be understood. For example, a scenario in which FR 0s are young RGs that will all eventually evolve into extended radio sources cannot be reconciled with the large space density of FR 0s. FR 0s might instead be recurrent sources, characterized by short phases of activity (BCM18). Finally, the jet properties of FR 0s might be intrinsically different from those of the FR Is, for example, the former class has lower bulk Lorentz factors (Baldi et al. 2019). The very long baseline (VLBI) observations obtained by Cheng & An (2018) indicate a diversity of relativistic beaming indicators in the sources of the subsample of 14 bright (with flux densities > 50 mJy) FR 0s they analyzed.
In this work we extend our comparison of FR 0s and FR Is by studying their large-scale environment, probing distances of up to 2 Mpc, testing whether their different radio morphologies are related to the local densities of galaxies, for instance. The paper is organized as follows: in Sect. 2 we describe the samples, and the environment is studied in Sect. 3. The results are discussed in Sect. 4, and our conclusions are given in Sect. 5.
Throughout the paper we assume the same cosmology as in M19, that is, H0 = 69.6 km s−1 Mpc−1, ΩM = 0.286, and ΩΛ = 0.714 (Bennett et al. 2014). This means that 1″ corresponds to 0.984 kpc at z = 0.05.
2. Samples
The three samples of RGs we selected to compare their large-scale (up to 2 Mpc) environmental properties are those formed by the compact FR0CAT sources with z < 0.05, and the two catalogs of edge-darkened sources, FRICAT, and sFRICAT. In these last samples we only considered sources the same redshift limit as the FR 0s.
We recently created a catalog of 219 FR Is (FRICAT, Capetti et al. 2017) starting from the list of radio AGN produced by Best & Heckman (2012). We visually inspected the FIRST image for each individual source with z < 0.15 and selected those whose radio emission has an edge-darkened morphology. We initially considered only those extending to a radius r larger than 30 kpc, that is, well-resolved sources at the 5″ resolution of the FIRST images within the redshift range of interest. Capetti et al. (2017) also considered a second sample of 14 smaller FR Is (hereafter sFRICAT), with 10 < r < 30 kpc, but limited to the objects with z < 0.05 to preserve a sufficient spatial resolution. The final sample of low-redshift FR Is is composed of 23 objects: the 9 FRICAT objects with z < 0.05, and the 14 sFRICAT. From the point of view of the optical spectroscopic classification, all FRICAT and sFRICAT sources are LEGs.
FR0CAT is instead composed of 104 compact RGs (BCM18)1. They were selected from the Best & Heckman catalog, imposing a redshift limit of 0.05. We set a limit to the maximum deconvolved size of 4″, corresponding to a size r ≲ 2.5 kpc. We also required an optical spectroscopic classification as LEGs. In the three tables in the appendix we list the main properties of the samples.
The redshift distributions of the samples cannot be distinguished statistically, with an average value of 0.037 for the FR 0s and 0.036 for the FR Is (see Fig. 1, left panel, and Table 1). Conversely, as already noted by BCM18, the FR Is hosts are 0.66 magnitudes brighter than those of FR 0s (Fig. 1, right panel).
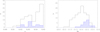 |
Fig. 1. Redshift (left) and absolute magnitude (right) distributions for the RG samples. The FR 0s are plotted in black, and the FR Is, including both FRICAT and sFRICAT objects, are blue shaded. |
Summary of the statistical results.
Following M19, we also used a catalog of mock sources (called MOCK hereinafter) in our analysis to estimate the efficiency of our procedures. This was created by shifting the positions of the FRICAT sources by a random radius between 2° and 3° while preserving their redshift distribution. The MOCK sample lists 4056 sources, 278 of which have z < 0.05. The MOCK sample provides us with a description of the environmental properties of random locations in the local Universe, to be compared with those derived from our sources of interest.
3. Environmental properties
3.1. Estimates of the local galaxy density
Massaro et al. (2019b) studied the environment of the subsample of 195 FRICAT sources that are located in the central part of the Sloan Digital Sky Survey (SDSS) footprint (see, e.g., Ahn et al. 2012). This is the area covered by the catalog of groups and clusters of galaxies produced by Tempel et al. (2012), hereinafter T12, which was used as reference for their analysis.
Massaro et al. (2019b) defined as “cosmological neighbors” all galaxies located within a region of a given projected radius (they mostly used a radius of 2 Mpc) and whose spectroscopic redshift z differed by less than 0.005 from the radio galaxy in the center of the field they examined. This choice corresponds to the maximum velocity dispersion in groups and clusters of galaxies (see, e.g., Eke et al. 2004). At the average redshift of the RG samples, 0.037, the spectroscopic limit of the SDSS (mr = 17.7) corresponds to an absolute magnitude of Mr = −18.4. This luminosity is well below the peak in the luminosity function of elliptical galaxies (e.g., Tempel et al. 2011) and about four magnitudes below the median optical luminosity of FR 0s and FR Is: at these low redshifts, the SDSS provides us with detailed information on environment.
The number of cosmological neighbors within 2 Mpc,  , spans a wide range, reaching values as high as 164, see Fig. 2. The median values of
  are 13 for the FR 0s and 44 for the FR Is, and the distributions of this parameter for the two classes differ significantly, see Table 1. The same result is obtained when a radius of 1 Mpc is used to derive
  : the medians of this parameter are 7 and 21 for FR 0s and FR Is, respectively.
 |
Fig. 2. Top panel: distribution of the number of cosmological neighbors for the FR 0s; the inset shows the same distribution with a smaller bin size, i.e., 1 instead of 5, to focus on the region of low |


We compared our results with those derived by cross-correlating our lists of sources with published catalogs of galaxy clusters and groups. More specifically, we considered the T12 catalog created using a modified version of the friends-of-friends (FoF) algorithm (Huchra & Geller 1982; Tago et al. 2010). In Fig. 3 we compare the number of cosmological neighbors,  , with the number of galaxies, Ngal, that is associated with the groups or clusters hosting the radio sources according to T12 (this is possible for all but six of the FR 0s because they are located outside the area covered by the T12 analysis). These two estimates of the galaxy density are generally consistent. However, in several cases, Ngal is much smaller than
  . For example, six objects have Ngal < 5 and
  . The field around one of them (SDSS J111113.18+284147.0) is shown in the right panel of Fig. 3. T12 reported a group of two galaxies, while we found 92 cosmological neighbors, with a strong concentration of sources ∼200 kpc to the west. We found that using the FoF algorithm, individual clusters of galaxies might be split into multiple substructures that are not recognized as being part of a single entity. When we searched for the closest group or cluster at a given position, the outcome might underestimate the local galaxy density. This effect is particularly severe at low redshift where structures cover large areas of the sky. In this case, the counting of cosmological neighbors is a more reliable method for environmental studies.
 |
Fig. 3. Left panel: comparison between the number of cosmological neighbors within a diameter of 2000 kpc ( |


We analyzed the fields around the MOCKs with the same strategy as we used for the RGs. In the bottom panel of Fig. 2 we show as a green histogram the resulting distribution of  , which shows a strong concentration for low values of
  . In particular, we find that 95% of the MOCKs correspond to
  . This implies that a value of
  has a probability of < 5% to occur by chance. The strong difference in the distributions of
  between FR Is, FR 0s, and the MOCKs (see the insets in the left panel of Fig. 2) indicates that both classes of RGs are located in regions in which the galaxy density is higher than average.
We also estimated the projected galaxy density following the approach of Dressler (1980), that is, measuring the Σk parameter. Σk is defined as the ratio between the number of sources k and the projected area  , where rk is the projected distance between the central galaxy and the kth nearest neighbor. More specifically, we estimated Σ5, derived from the distance of the fifth closest candidate elliptical galaxy. Candidate elliptical galaxies are optical sources located within the 2 Mpc distance from the RG whose optical colors are consistent with those of quiescent ellipticals at the same redshift. The distributions of Σ5 for FR 0s and FR Is differ significantly, with the latter group showing a median value a factor ∼3 higher (Fig. 4). The median of the distribution of Σ5 for the MOCKs is lower by a factor ∼2 than the average of the FR 0s. This confirms that overall, FR 0s are located in an environment that is richer than average.
 |
Fig. 4. Comparison of the Σ5 parameter for FR 0s (black, top panel) and MOCKs (green, scaled by a factor 104/278)), and the distribution of Σ5 for the FR Is (bottom). |
All the estimators concur that the local galaxy density around FR Is is a factor ∼2–3 higher than around FR 0s. However, this ratio does not fully capture their different environments. Figure 2 shows that the main characteristic of the megaparsec-scale environment is the large fraction of FR 0s that are located in poor groups of galaxies, an environment that FR Is rarely inhabit. More quantitatively, about two-thirds of the FR 0s (65/104) have  , while this occurs for only 4 out of 23 FR Is (17%).
Despite the similarity in the distance distribution of FR 0s and FR Is, we cannot exclude that some residual effect due to redshift is still present and that this affects our results. To address this possibility, we artificially moved all sources to a common redshift of 0.05. The magnitudes of each source and of all its cosmological neighbors were reevaluated by considering the increased distance modulus, with an average correction of ∼0.7 magnitudes. All neighbors that after this flux dimming fell below the threshold of the SDSS spectroscopic selection (i.e., r > 17.7) were excluded from the estimates of the local galaxy density. Effectively, this strategy produces a list of cosmological friends with a fixed absolute magnitude limit of Mr < −19, with the only drawback that the number of cosmological friends is reduced by an average factor 1.5. In Fig. 5 we compare the simulated number of cosmological neighbors within 2 Mpc at a redshift of z = 0.05,  of FR 0s and FR Is: the two distributions still differ at a high significance level (see Table 1).
 |
Fig. 5. Distribution of the simulated number of cosmological neighbors for the FR 0s and FR Is (black and blue histograms, respectively) within 2 Mpc after all sources were moved to a common redshift of 0.05. |
We considered the possibility of a connection between the environment properties of the active nucleus and of the RG host galaxy. In particular, we tested whether  is related with (1) the [O III] line luminosity, (2) the host BH mass, and (3) the strength of the Dn(4000) index. The Spearman rank test did not return any significant correlation. The only notable result concerns the five FR 0s that form the tail of low BH mass values, log MBH < 7.8, for which we find an even poorer environment than for the FR 0s population, with an average value
  .
.
3.2. Location of the RGs within the group or cluster of galaxies
The local density of galaxies is not the only parameter that defines the environmental properties because it is also important to establish in which location within a cluster of galaxies, for example, a given source is located. The location of an AGN within the group or cluster of galaxies might have a profound effect on the level of accretion, and consequently, on its nuclear power (see, e.g., Koulouridis et al. 2018). For example, by exploring the properties of early-type galaxies in the Virgo cluster, Vattakunnel et al. (2010) found a suggestive trend between jet power and location within the cluster. A similar result was found by Croston et al. (2019).
We then estimated the projected distance,  , of each RG from the average of the positions in the sky of all its cosmological neighbors within 2 Mpc. Similarly, we estimated the difference between their redshift with respect to the average of the cosmological neighbors, cΔz. These two quantities are reported in Fig. 6, and a statistical summary is given in Table 1. We found
  kpc and |cΔz|< 800 km s−1 for all but three of the RGs we considered.
 |
Fig. 6. Projected distance (in kpc) vs. the redshift difference times the speed of light (in km s−1) for each RG from the average of its cosmological neighbors. In the left panel the symbol size is proportional to |

The average distance (∼340 kpc) and the difference in velocity (∼200 km s−1) are similar for FR 0s and FR Is, and the distributions for the two classes cannot be distinguished statistically. The same result is obtained when we consider the distribution of cosmological neighbors within 1 Mpc, with  kpc and 250 kpc for FR 0s and FR Is, respectively. There is a difference between the average values between FRICAT and sFRICAT sources, both indicating that the former are closer to the center of the group or cluster, but the small number statistics prevents us from drawing a firm conclusion. When we restrict the sample to the cosmological neighbors within 1 Mpc, this difference disappears.
We also explored the possibility that the location of the radio sources depends on the optical luminosity of the source or on the richness of the galaxy structure. For this reason, the symbol sizes in the two panels of Fig. 6 are proportional to  and Mr, respectively: we do not find any apparent dependency between these quantities. More quantitatively, we experimented whether a cutoff at low values of
  and/or Mr affects the results, but this not the case: in particular, the median values of
  and cΔz do not change significantly.
We conclude that RG hosts are often strongly displaced (by about 200–300 kpc) from the average of the projected location of the cosmological neighbors. FR 0s and FR Is do not show significant differences in this respect.
On the other hand, the RG host galaxies are invariably the most luminous galaxy among the cosmological neighbors within 2 Mpc. This might indicate a substantial complexity in the galaxy distribution, possibly indicative of substructures that are not yet completely relaxed. Alternatively, the average of the galaxy locations might not accurately trace the location of the center of the galaxy structure.
4. Discussion
The main conclusion about the environmental properties of the three samples of low-redshift RGs is that FR 0s are located in regions with fewer galaxies than FR Is, independently of the method used. This is driven by the small fraction of FR Is that is located in groups that are formed by fewer than 15 galaxies. This environment is typical of FR 0s, however. That the environment of FR 0s is poorer than that of FR Is is the first significant difference between these two RG classes, except for the defining characteristic of FR 0s, which is the lack of substantial extended radio emission.
One possibility to account for the connection between environment and the properties of the extended radio emission is related to the adiabatic losses of the radio-emitting plasma (e.g., Longair 1994). In a poorer environment, density and pressure of the external medium are reduced with respect to regions of higher galaxy density: this causes a faster lateral expansion of the jets, stronger adiabatic losses, and consequently, a reduced emissivity. However, the high-resolution radio observations by Baldi et al. (2019) showed that most FR 0s do not reach sizes of even ∼1 kpc: at these small scales, the external gas in which they expand is still well within the core of the hot corona of their host. The similarity of FR 0 and FR I host galaxies suggests that their coronae will also have similar properties, based on the connection between optical and X-ray luminosity (Fabbiano et al. 1992). A large spread in the X-ray properties for galaxies of similar absolute magnitude exists, but it does not appear to be closely connected with the local galaxy density (Su et al. 2015). The possibility that the separation between FR 0s and FR Is is driven by differences in the hot gas content of their hosts appears contrived: the paucity of extended radio emission in FR 0s is more likely to be an intrinsic property of these sources. Nonetheless, it would be important to verify this conclusion with X-ray imaging of these low-redshift RGs.
Baldi et al. (2015, 2019) suggested that FR 0s are associated with jets whose bulk Lorentz factor Γ is lower than that of FR Is, thus reducing their ability to penetrate the ambient medium. Baldi et al. (2015) proposed that a high Γ jet, leading to a FR I morphology, is only produced when the BH spin is close to its maximum value, following the suggestion that the BH spin and Γ are related (McKinney 2005; Tchekhovskoy et al. 2010; Chai et al. 2012; Maraschi et al. 2012). FR 0s could be associated with BHs of lower spin.
The origin of the connection between BH spin and environment can have two explanations, depending on whether the spin evolution is mainly driven by accretion or BH mergers.
Within the first option, Garofalo & Singh (2019) included the FR 0s in an evolutionary framework for RGs: FR 0s represent the class of sources that formed during the transition from highly retrogradely spinning (with respect to the accretion disk) BHs that are associated with the powerful FR IIs, to the prograde BHs of the less powerful FR II LEG or FR I. Garofalo & Singh (2019) ascribed the change in BH spin to the angular momentum of the accreting material: a low-spin FR 0 evolves into a highly spinning source, that is, an FR I, when the accreting material reaches ∼30% of the initial BH mass. We note that RGs do not need to follow this full evolution, starting as powerful FR IIs: FR 0s might form associated with low-spin BHs and then evolve into FR Is. The connection between environment and the classes of RGs in this scheme requires a positive link between local galaxy density and accretion rate. If this is the case, the low BH spin phase would last longer in poorer environment than in regions of higher galaxy density. This would generate a connection between the environment and the jet speed and power. This connection can be seen only on a statistical basis, not in individual objects. FR 0s would preferentially inhabit a poor environment, but they can also be found in galaxy clusters if they formed recently and do not have accreted a sufficient amount of mass onto their central BH yet to turn into an FR I. Similarly, FR Is might also be seen in poor galaxy groups. There is evidence that the accretion rate in RGs is controlled by the amount of hot gas that is available in the circumnuclear regions (Allen et al. 2006; Balmaverde et al. 2008), but the process that would eventually connect the scale at which this is measured (typically ≲100 pc) and to the megaparsec environment remains to be understood. In this respect, it would be very important to be able to assess the location of RGs with respect to the center of the gravitational well.
Alternatively, the BH spin distribution is set mainly by the merger history of BHs. The simulations performed by Dubois et al. (2014) indicate that the most massive BHs (MBH ≳ 108 M⊙), in particular those associated with gas-poor galaxies (such as the low-redshift RGs we are considering), indeed acquire most of their mass through BH coalescence. An analysis of how the BH spin distribution is related to environment, focusing on the massive early-type galaxies, is needed in order to link the observed differences between FR 0s and FR Is to the results of numerical simulations.
5. Summary and conclusions
We compared the environment on the megaparsec scale of FR 0s and FR Is, taking advantage of the information of the local galaxy distribution provided by the SDSS. The samples we considered are formed by 104 objects from FR0CAT, 14 from sFRICAT, and 9 from FRICAT (limited to those with z < 0.05, the same redshift limit as for the other two samples). The latter two catalogs are formed by FR Is of different linear size. The redshift distributions of the samples we considered do not differ significantly, and this enabled us to perform a direct comparison between their environment free from biases due to distance.
Following the methods described in M19, we used as tracer of the local density of galaxies the number of cosmological neighbors, that is, the galaxies located within a given radius (usually 2 Mpc, but our results are the same when smaller radii are used, e.g., 1 Mpc) and whose spectroscopic redshift differ by less than 0.005 from our sources of interest. The median number of cosmological neighbors is a factor ∼3 larger for FR Is than FR 0s. The same conclusion is reached when other estimators are considered, the fifth nearest neighbor density Σ5 or the number of galaxies associated with the RGs according to a catalog of galaxy clusters and groups. This difference is due to the large fraction (63%) of FR 0s that is located in groups of galaxies formed by fewer than 15 sources, where we only find 17% of the FR Is. That the environment of FR 0s is poorer than that of FR Is is the first significant difference found between these two classes, except for the defining property of FR 0s, that is, the lack of substantial extended radio emission. The possibility that this link is due stronger adiabatic losses, which might cause a lower jet brightness in FR 0s, appears to be contrived: their jets are confined within the hot corona of their hosts, and the distribution of the external medium on larger scales does not affect them.
Our results suggest a connection between environment and jet power, driven by a common link with the BH spin. There are two possibilities for this connection. Low-spin RGs (i.e., the FR 0s) might evolve into high-spin FR Is due to accretion: in an environment of lower density, the FR 0 phase would last longer. Alternatively, the BH spin distribution results from galaxy mergers and BH coalescence: the most massive BHs that are located in gas-poor galaxies indeed acquire most of their mass through coalescence. The role of environment in the BH spin evolution remains to be fully investigated.
Our analysis of the environment is only based on optical data. Clearly, X-ray observations of these low-redshift RGs are crucial for an independent and complementary analysis of their environment. The X-ray luminosity and temperature of the intergalactic medium provide an estimate of the total mass of galaxy structures. Furthermore, we found that while both FR 0s and FR Is are always associated with the brightest galaxy among the cosmological neighbors, they do not appear to be located at the barycenter of their neighbors. This might be an indication that the distribution of galaxies is not yet fully relaxed or that the optical average might not accurately trace the location of the center of the galaxy structure. The distribution of the intergalactic medium derived from X-ray images might provide a clearer answer to this problem. Finally, such data would also enable us to compare the properties of the RG hot coronae in which their jets propagate.
The initial FR0CAT sample was formed by 108 objects. The inspection of their NVSS images revealed the presence of low-brightness diffuse emission, which is resolved out in the FIRST images, in four of them. These sources were therefore removed from the catalog (see Baldi et al. 2019, for further details).
Acknowledgments
We thank M. Volonteri, A. Paggi, I. Pillitteri, and R. Campana, C. C. Cheung and A. Tramacere for useful comments and discussion. This work is supported by the “Departments of Excellence 2018–2022” Grant awarded by the Italian Ministry of Education, University and Research (MIUR) (L. 232/2016). This research has made use of resources provided by the Compagnia di San Paolo for the grant awarded on the BLENV project (S1618_L1_MASF_01) and by the Ministry of Education, Universities and Research for the grant MASF_FFABR_17_01. This investigation is supported by the National Aeronautics and Space Administration (NASA) grants GO4-15096X, AR6-17012X and GO6-17081X. F.M. acknowledges financial contribution from the agreement ASI-INAF n.2017-14-H.0. Funding for SDSS and SDSS-II has been provided by the Alfred P. Sloan Foundation, the Participating Institutions, the National Science Foundation, the U.S. Department of Energy, the National Aeronautics and Space Administration, the Japanese Monbukagakusho, the Max Planck Society, and the Higher Education Funding Council for England. The SDSS website is http://www.sdss.org/. The SDSS is managed by the Astrophysical Research Consortium for the Participating Institutions. The Participating Institutions are the American Museum of Natural History, Astrophysical Institute Potsdam, University of Basel, University of Cam- bridge, Case Western Reserve University, University of Chicago, Drexel University, Fermilab, the Institute for Advanced Study, the Japan Participation Group, Johns Hopkins University, the Joint Institute for Nuclear Astrophysics, the Kavli Institute for Particle Astrophysics and Cosmology, the Korean Scientist Group, the Chinese Academy of Sciences (LAMOST), Los Alamos National Laboratory, the Max- Planck-Institute for Astronomy (MPIA), the Max-Planck- Institute for Astrophysics (MPA), New Mexico State University, Ohio State University, University of Pittsburgh, University of Portsmouth, Princeton University, the United States Naval Observatory, and the University of Washington.
References
- Ahn, C. P., Alexandroff, R., Allende Prieto, C., et al. 2012, ApJS, 203, 21 [NASA ADS] [CrossRef] [Google Scholar]
- Allen, S. W., Dunn, R. J. H., Fabian, A. C., Taylor, G. B., & Reynolds, C. S. 2006, MNRAS, 372, 21 [NASA ADS] [CrossRef] [Google Scholar]
- Baldi, R. D., & Capetti, A. 2009, A&A, 508, 603 [NASA ADS] [CrossRef] [EDP Sciences] [Google Scholar]
- Baldi, R. D., Capetti, A., & Giovannini, G. 2015, A&A, 576, A38 [NASA ADS] [CrossRef] [EDP Sciences] [Google Scholar]
- Baldi, R. D., Capetti, A., & Massaro, F. 2018, A&A, 609, A1 [NASA ADS] [CrossRef] [EDP Sciences] [Google Scholar]
- Baldi, R. D., Capetti, A., & Giovannini, G. 2019, MNRAS, 482, 2294 [NASA ADS] [CrossRef] [Google Scholar]
- Balmaverde, B., Baldi, R. D., & Capetti, A. 2008, A&A, 486, 119 [NASA ADS] [CrossRef] [EDP Sciences] [Google Scholar]
- Becker, R. H., White, R. L., & Helfand, D. J. 1995, ApJ, 450, 559 [NASA ADS] [CrossRef] [Google Scholar]
- Bennett, C. L., Larson, D., Weiland, J. L., & Hinshaw, G. 2014, ApJ, 794, 135 [NASA ADS] [CrossRef] [Google Scholar]
- Best, P. N. 2004, MNRAS, 351, 70 [NASA ADS] [CrossRef] [Google Scholar]
- Best, P. N., & Heckman, T. M. 2012, MNRAS, 421, 1569 [NASA ADS] [CrossRef] [Google Scholar]
- Best, P. N., Kauffmann, G., Heckman, T. M., & Ivezić, Ž. 2005, MNRAS, 362, 9 [NASA ADS] [CrossRef] [Google Scholar]
- Capetti, A., Massaro, F., & Baldi, R. D. 2017, A&A, 598, A49 [NASA ADS] [CrossRef] [EDP Sciences] [Google Scholar]
- Chai, B., Cao, X., & Gu, M. 2012, ApJ, 759, 114 [NASA ADS] [CrossRef] [Google Scholar]
- Cheng, X.-P., & An, T. 2018, ApJ, 863, 155 [NASA ADS] [CrossRef] [Google Scholar]
- Condon, J. J., Cotton, W. D., Greisen, E. W., et al. 1998, AJ, 115, 1693 [NASA ADS] [CrossRef] [Google Scholar]
- Croston, J. H., Hardcastle, M. J., Mingo, B., et al. 2019, A&A, 622, A10 [NASA ADS] [CrossRef] [EDP Sciences] [Google Scholar]
- Dressler, A. 1980, ApJ, 236, 351 [NASA ADS] [CrossRef] [Google Scholar]
- Dubois, Y., Volonteri, M., & Silk, J. 2014, MNRAS, 440, 1590 [NASA ADS] [CrossRef] [Google Scholar]
- Eke, V. R., Baugh, C. M., Cole, S., et al. 2004, MNRAS, 348, 866 [NASA ADS] [CrossRef] [Google Scholar]
- Fabbiano, G., Kim, D.-W., & Trinchieri, G. 1992, ApJS, 80, 531 [NASA ADS] [CrossRef] [EDP Sciences] [Google Scholar]
- Fanaroff, B. L., & Riley, J. M. 1974, MNRAS, 167, 31P [Google Scholar]
- Garofalo, D., & Singh, C. B. 2019, ApJ, 871, 259 [NASA ADS] [CrossRef] [Google Scholar]
- Gendre, M. A., Best, P. N., Wall, J. V., & Ker, L. M. 2013, MNRAS, 430, 3086 [NASA ADS] [CrossRef] [Google Scholar]
- Ghisellini, G. 2011, in American Institute of Physics Conference Series, eds. F. A. Aharonian, W. Hofmann, & F. M. Rieger, 1381, 180 [NASA ADS] [CrossRef] [Google Scholar]
- Hardcastle, M. J., Alexander, P., Pooley, G. G., & Riley, J. M. 1998, MNRAS, 296, 445 [NASA ADS] [CrossRef] [Google Scholar]
- Helfand, D. J., White, R. L., & Becker, R. H. 2015, ApJ, 801, 26 [NASA ADS] [CrossRef] [Google Scholar]
- Hill, G. J., & Lilly, S. J. 1991, ApJ, 367, 1 [NASA ADS] [CrossRef] [Google Scholar]
- Huchra, J. P., & Geller, M. J. 1982, ApJ, 257, 423 [NASA ADS] [CrossRef] [Google Scholar]
- Koulouridis, E., Ricci, M., Giles, P., et al. 2018, A&A, 620, A20 [NASA ADS] [CrossRef] [EDP Sciences] [Google Scholar]
- Laing, R. A., Jenkins, C. R., Wall, J. V., & Unger, S. W. 1994, in The Physics of Active Galaxies, eds. G. V. Bicknell, M. A. Dopita, & P. J. Quinn, ASP Conf. Ser., 54, 201 [NASA ADS] [Google Scholar]
- Longair, M. S. 1994, High Energy Astrophysics (Cambridge: Cambridge University Press) [CrossRef] [Google Scholar]
- Longair, M. S., & Seldner, M. 1979, MNRAS, 189, 433 [NASA ADS] [CrossRef] [Google Scholar]
- Maraschi, L., Colpi, M., Ghisellini, G., Perego, A., & Tavecchio, F. 2012, J. Phys. Conf. Ser., 355, 012016 [NASA ADS] [CrossRef] [Google Scholar]
- Massaro, F., Álvarez-Crespo, N., Capetti, A., et al. 2019a, ApJS, 240, 20 [NASA ADS] [CrossRef] [Google Scholar]
- Massaro, F., Álvarez-Crespo, N., Capetti, A., et al. 2019b, ApJS, 240, 20 [NASA ADS] [CrossRef] [Google Scholar]
- McKinney, J. C. 2005, ApJ, 630, L5 [NASA ADS] [CrossRef] [Google Scholar]
- Prestage, R. M., & Peacock, J. A. 1988, MNRAS, 230, 131 [NASA ADS] [CrossRef] [Google Scholar]
- Sadler, E. M., Ekers, R. D., Mahony, E. K., Mauch, T., & Murphy, T. 2014, MNRAS, 438, 796 [NASA ADS] [CrossRef] [Google Scholar]
- Spinrad, H., Marr, J., Aguilar, L., & Djorgovski, S. 1985, PASP, 97, 932 [NASA ADS] [CrossRef] [Google Scholar]
- Su, Y., Irwin, J. A., White, III., R. E., & Cooper, M. C. 2015, ApJ, 806, 156 [NASA ADS] [CrossRef] [Google Scholar]
- Tago, E., Saar, E., Tempel, E., et al. 2010, A&A, 514, A102 [NASA ADS] [CrossRef] [EDP Sciences] [Google Scholar]
- Tchekhovskoy, A., Narayan, R., & McKinney, J. C. 2010, ApJ, 711, 50 [NASA ADS] [CrossRef] [Google Scholar]
- Tempel, E., Saar, E., Liivamägi, L. J., et al. 2011, A&A, 529, A53 [NASA ADS] [CrossRef] [EDP Sciences] [Google Scholar]
- Tempel, E., Tago, E., & Liivamägi, L. J. 2012, A&A, 540, A106 [NASA ADS] [CrossRef] [EDP Sciences] [Google Scholar]
- Torresi, E., Grandi, P., Capetti, A., Baldi, R. D., & Giovannini, G. 2018, MNRAS, 476, 5535 [NASA ADS] [CrossRef] [Google Scholar]
- van Haarlem, M. P., Wise, M. W., Gunst, A. W., et al. 2013, A&A, 556, A2 [NASA ADS] [CrossRef] [EDP Sciences] [Google Scholar]
- Vattakunnel, S., Trussoni, E., Capetti, A., & Baldi, R. D. 2010, A&A, 522, A89 [NASA ADS] [CrossRef] [EDP Sciences] [Google Scholar]
Appendix A: Additional tables
Properties of the FR0CAT sample.
Properties of the sFRICAT sources.
Properties of the FRICAT sources with z < 0.05.
All Tables
All Figures
|
Fig. 1. Redshift (left) and absolute magnitude (right) distributions for the RG samples. The FR 0s are plotted in black, and the FR Is, including both FRICAT and sFRICAT objects, are blue shaded. |
| In the text | |
|
Fig. 2. Top panel: distribution of the number of cosmological neighbors for the FR 0s; the inset shows the same distribution with a smaller bin size, i.e., 1 instead of 5, to focus on the region of low |
| In the text | |
|
Fig. 3. Left panel: comparison between the number of cosmological neighbors within a diameter of 2000 kpc ( |
| In the text | |
|
Fig. 4. Comparison of the Σ5 parameter for FR 0s (black, top panel) and MOCKs (green, scaled by a factor 104/278)), and the distribution of Σ5 for the FR Is (bottom). |
| In the text | |
|
Fig. 5. Distribution of the simulated number of cosmological neighbors for the FR 0s and FR Is (black and blue histograms, respectively) within 2 Mpc after all sources were moved to a common redshift of 0.05. |
| In the text | |
|
Fig. 6. Projected distance (in kpc) vs. the redshift difference times the speed of light (in km s−1) for each RG from the average of its cosmological neighbors. In the left panel the symbol size is proportional to |
| In the text | |
Current usage metrics show cumulative count of Article Views (full-text article views including HTML views, PDF and ePub downloads, according to the available data) and Abstracts Views on Vision4Press platform.
Data correspond to usage on the plateform after 2015. The current usage metrics is available 48-96 hours after online publication and is updated daily on week days.
Initial download of the metrics may take a while.