| Issue |
A&A
Volume 674, June 2023
|
|
|---|---|---|
| Article Number | A191 | |
| Number of page(s) | 7 | |
| Section | Extragalactic astronomy | |
| DOI | https://doi.org/10.1051/0004-6361/202245257 | |
| Published online | 21 June 2023 | |
Investigating the large-scale environment of wide-angle tailed radio galaxies in the local Universe
1
Dipartimento di Fisica, Università degli Studi di Torino, Via Pietro Giuria 1, 10125 Torino, Italy
e-mail: This email address is being protected from spambots. You need JavaScript enabled to view it.
2
Institute of Astrophysics, Foundation for Research and Technology – Hellas, Voutes, 7110 Heraklion, Greece
3
INAF – Osservatorio Astrofisico di Torino, Via Osservatorio 20, 10025 Pino Torinese, Italy
4
Istituto Nazionale di Fisica Nucleare, Sezione di Torino, 10125 Torino, Italy
5
Consorzio Interuniversitario per la Fisica Spaziale, Via Pietro Giuria 1, 10125 Torino, Italy
6
INAF – Istituto di Radioastronomia, Via Piero Gobetti 101, 40129 Bologna, Italy
7
Center for Astrophysics, Harvard & Smithsonian, 60 Garden Street, 02138 Cambridge, MA, USA
8
Dipartimento di Fisica “Ettore Pancini”, Università di Napoli Federico II, Via Cintia, 80126 Napoli, Italy
9
University of Geneva, Chemin d’Ecogia 16, Versoix, 1290
Switzerland
10
INAF/OAS, Via Piero Gobetti 101, 40129 Bologna, Italy
11
INFN – Sezione di Bologna, Viale Berti Pichat 6/2, 40127 Bologna, Italy
12
INAF – Osservatorio Astronomico di Palermo “G. S. Vaiana”, Piazza del Parlamento 1, 90134 Palermo, Italy
Received:
10
October
2022
Accepted:
18
April
2023
Abstract
We present a statistical analysis of the large-scale (up to two Mpc) environment of a homogeneous and complete sample, both in radio and optical selection, of wide-angle tailed radio galaxies (WATs) in the local Universe (i.e., with redshifts z ≲ 0.15). The analysis is carried out using the parameters obtained from cosmological neighbors within two Mpc of the target source. Results regarding the large-scale environments of the WATs are then compared with those of Fanaroff–Riley type I (FR Is) and type II (FR IIs) radio galaxies listed in two other homogeneous and complete catalogs and selected with the same criterion adopted for the WATs catalog. We obtain indication that at low redshift, WATs inhabit environments with a larger number of galaxies than those of FR Is and FR IIs. In the explored redshift range, the physical size of the galaxy group or cluster in which the WATs reside appears to be almost constant with respect to FR Is and FR IIs, being around one Mpc. From the distribution of the concentration parameter, defined as the ratio between the number of cosmological neighbors lying within 500 kpc and within one Mpc, we conclude that WATs tend to inhabit the central region of the group or cluster in which they reside, in agreement with the general paradigm that WATs are the brightest cluster or group galaxy.
Key words: galaxies: active / galaxies: clusters: general / methods: statistical / galaxies: jets / surveys / radio continuum: galaxies
© The Authors 2023
 Open Access article, published by EDP Sciences, under the terms of the Creative Commons Attribution License (https://creativecommons.org/licenses/by/4.0), which permits unrestricted use, distribution, and reproduction in any medium, provided the original work is properly cited.
This article is published in open access under the Subscribe to Open model. This email address is being protected from spambots. You need JavaScript enabled to view it. to support open access publication.
1. Introduction
Extragalactic extended radio sources have been classified taking into account the relative positions of their high and low brightness regions. These regions have been found to be correlated with the luminosities of the sources (Fanaroff & Riley 1974). Edge-darkened radio sources were classified as Fanaroff–Riley type I (FR Is), while edge-brightened sources were classified as Fanaroff–Riley type II (FR IIs). A summary of the structural properties of extended extragalactic radio sources was reported by Miley (1980). The FR I-FR II dichotomy reflects the different cosmological evolution of these two classes (Longair 1971), and there is debate as to whether there is a link between accretion modes and radio morphology (Best & Heckman 2012). These sources also appear to be related to the large-scale environment where they reside (see e.g., Worrall & Birkinshaw 2000). Many different methods have already been used to investigate the large-scale environment of radio sources. Thanks to multifrequency observations and redshift estimates, it has been possible to remove galaxies that are not in the same group or cluster, allowing for greater reliability in the analysis of the large-scale environment of the sources (Best 2004). In the optical range, the Sloan Digital Sky Survey (SDSS; York et al. 2000) has expanded both our knowledge of galaxy properties, such as luminosities, morphologies, star-formation rates, and nuclear activity, and how these properties depend on the environment that a galaxy inhabits. All these properties can place important constraints on models of galaxy formation and evolution, and they enable the intrinsic properties of the galaxies to be separated from those that have been externally induced.
Through study of the environments of FR Is and FR IIs on the megaparsec scale, FR Is have been found to generally inhabit galaxy-rich environments, as members of groups or galaxy clusters, while FR IIs have been found to be more isolated, as shown, for example, in Zirbel (1997). There are however some well known exceptions, such as Cygnus A (Carilli & Barthel 1996).
The environments of powerful radio sources have been widely studied (see e.g., Prestage & Peacock 1988; Hill & Lilly 1991) up to a z ∼ 0.5. From the estimate of the galaxy density around these sources, it has been concluded that there is no strong statistical evidence for a difference in the environments hosting FR Is and FR IIs, but at low redshift (z < 0.5), the environments appear less galaxy-rich than those of the counterparts of the same radio power at high redshift.
Another class of radio galaxies are the wide-angle tailed radio galaxies (WATs), which show the so-called jet-hotspot-lobe transition. In WATs, there are bright hotspots (called “warmspots”) closer to their radio core, with respect to FR IIs, and they have extended radio plumes beyond them (O’Donoghue et al. 1990).
The general morphology of WATs (first classified by Owen & Rudnick 1976) suggests that these sources interact significantly with their surrounding medium. For example, these sources show bent tails as a result of the ram pressure from the relative motion between the radio source and intracluster medium (ICM; see e.g., simulations in Massaglia et al. 2019). In addition, WATs are normally found in galaxy clusters and are generally associated with the brightest cluster galaxy (BCG; see e.g., Burns 1981). This implies that WATs can be found in merging systems, as shown in Gómez et al. (1997) via ROSAT X-ray data, or in relaxed systems showing “sloshing” of the central ICM due to minor mergers of clusters (Ascasibar & Markevitch 2006). Notably, WATs have proven to be reliable tracers of high-density environments up to high redshifts (see e.g., Giacintucci & Venturi 2009) and may therefore be used as probes for the presence of the ICM. In the already cited work by Burns (1981), Very Large Array (VLA) 20-cm observations of the WAT 1919+479 (4C 47.51) were presented. The author discussed the morphology, polarization, environment, and nature of the galaxy cluster hosting the radio source. The author also highlighted that with X-ray observations, it is possible to support the contention that the cluster around the WAT is gas rich.
As shown by Wing & Blanton (2011) through SDSS and Faint Images of the Radio Sky at Twenty Centimeters (FIRST; Becker et al. 1995) data, bent radio sources are more often found in galaxy clusters than non-bent radio sources, and therefore the authors point out that a radio-selected galaxy cluster sample can be obtained by classifying bent radio sources from their radio morphology and then looking for their optical counterpart. In Garon et al. (2019), the authors investigate the effect of the cluster environment on the morphology of the sources. These authors present bent source properties (e.g., spatial distribution of radio galaxies around clusters and bending angle as a function of cluster mass or pressure) selected from the Radio Galaxy Zoo project catalog (Banfield et al. 2015), showing that bending is higher in sources near the center of a cluster, but the authors could not draw firm conclusions on the radio morphology of BCGs hosted in disturbed clusters.
In the literature, the environments of WATs and bent-double radio sources have been studied both at low (z ∼ 0.2) and mid-redshift (z > 0.2). Blanton et al. (2001) presented observations of a complete magnitude-limited sample of 40 radio galaxies from the VLA FIRST survey, part of a larger sample of bent-double radio sources at moderate redshift. The most interesting result is that ∼46% of the sources in the sample are associated with groups, some of them being poor groups. The high-redshift Clusters Occupied by Bent Radio AGN (COBRA) Survey (Blanton et al. 2015) uses bent radio sources as tracers of distant galaxy clusters on the assumption that, as shown at low redshift, these sources are good tracers of high-density environments.
Smolčić et al. (2007), having identified a complex galaxy cluster system in the Cosmic Evolution Survey (COSMOS) field via a WAT, used optical and X-ray data to investigate its host environment. The cluster shows evidence of subclustering, both in diffuse X-ray emission and in the spatial distribution of galaxies found from the optical analysis applying the Voronoi tessellation-based approach.
In this paper, we extend the analysis of the large-scale environment to a complete and homogeneous (both in luminosity and redshift) sample of WATs restricted to the local Universe (i.e., source redshifts zsrc ≤ 0.15) to prove if the environments of WATs differ from those of FR Is and FR IIs in the catalogs FRICAT and FRICAT. The WATs used in this work are listed in WATCAT (Missaglia et al. 2019, see Sect. 2 for details of the catalogs). A similar analysis is reported in Massaro et al. (2019). The authors present results of their analysis of the large-scale environment of FR I and FR II radio galaxies, and they used the same catalogs we used. Massaro et al. (2019) concluded that radio galaxies, independent of their radio (FR I vs. FR II) classification, tend to inhabit galaxy-rich large-scale environments with similar richness.
Results from previous cited works, even if for samples at higher z with respect to that of the WATCAT, show that bent radio morphology is used to identify and characterize the environment in which the bent sources are hosted. For this reason, we define the parameters that are used in this work to characterize the environment in which WATCAT sources lie.
The paper is organized as follows: In Sect. 2 we briefly describe the samples used to carry out our analysis, while in Sects. 3 and 4 we provide a brief description of the cosmological neighbors and several ambient parameters obtainable from their distribution. Then, Sect. 5 is devoted to the results of the statistical analysis of the environment of WATs. Finally, a summary and conclusions are given in Sect. 6. In Appendix A, we report the values of the parameters obtained from the cosmological neighbors of WATs.
Hereafter, we adopt cgs units for numerical results and we assume a flat cosmology with H0 = 69.6 km s−1 Mpc−1, ΩM = 0.286, and ΩΛ = 0.714 (Bennett et al. 2014), unless otherwise stated. Thus, according to these cosmological parameters, in the z range of the WATCAT, 1″ corresponds to 0.408 kpc at zsrc = 0.02 and to 2.634 kpc at zsrc = 0.15.
2. Sample selection
We selected three radio galaxy catalogs to carry out our analysis, all of which were obtained from the radio-loud sample of Best & Heckman (2012). All sources were selected on the basis of their morphology as shown in the FIRST radio survey (Becker et al. 1995).
The first catalog we selected is the WATCAT (Missaglia et al. 2019). The catalog lists 47 radio sources at low redshift (zsrc ≤ 0.15) showing two-sided jets with two clear warmspots (i.e., jet knots as bright as 20% of the nucleus) lying on the opposite side of the radio core and having classical extended emission resembling a plume beyond the warmspots. As shown in Missaglia et al. (2019), WATs show multifrequency properties remarkably similar to FR I radio galaxies, which are more powerful at radio wavelengths and similar to FR IIs (see Table A.1 for WATCAT sources radio luminosities at 1.4 GHz).
The second catalog is the combination of FRICAT and sFRICAT, both of which are described in Capetti et al. (2017a). The FRICAT sources, chosen on the basis of their FR I radio morphology, have a radio structure extending beyond a distance of 30 kpc from the optical position of the host galaxy. The 14 sFRICAT sources have FR I radio morphology, radio emission extended between 10 and 30 kpc, and are limited to zsrc = 0.05 (see Capetti et al. 2017a, for details). The combination of these two samples includes FR Is at redshift zsrc ≤ 0.15. Sources from the FR I sample have radio luminosities at 1.4 GHz in the range of L1.4 ∼ 1039.5 − 1041.3 erg s−1, while the sFR I radio luminosities span 1039 − 1040.4 erg s−1.
The third catalog is the FRIICAT (Capetti et al. 2017b), which is composed of 105 edge-brightened radio sources (FR II type) within the same redshift range of the previous catalog. Sources in this sample have radio luminosities at 1.4 GHz that cover the range of L1.4 ∼ 1039.5 − 1042.5 erg s−1.
All three catalogs only include sources lying in the footprint of the SDSS, which is also covered by the main catalog of groups and clusters of galaxies adopted in our analysis, that is, the catalog created by Tempel et al. (2012) based on a modified version of the Friends-of-Friends algorithm (Huchra & Geller 1982; Tago et al. 2010). The Tempel catalog has the largest number of galaxy cluster and group detections, with spectroscopic redshifts 0.009 ≤zcl≤ 0.20 and a peak around 0.08. We want to stress that thanks to the adopted selection criteria, all three radio galaxy catalogs are free from contamination by compact radio objects, such as compact steep spectrum sources, and FR 0s (Baldi et al. 2015, 2018), which show a different cosmological evolution and lie in different environments.
3. Cosmological neighbors
To investigate the large-scale environment of WATs, we first defined a type of optical sources: the cosmological neighbors. We classified as cosmological neighbors all optical sources lying within a maximum distance of a two Mpc radius computed at zsrc of the central radio galaxy, with all the SDSS magnitude flags indicating a galaxy-type object (i.e., uc = rc = gc = ic = zc = 3), and having a spectroscopic redshift z with Δ z = |zsrc − z|≤0.005. This value corresponds to ∼1500 km s−1, which is the maximum velocity dispersion in groups and clusters of galaxies (see e.g., Berlind et al. 2006). However, in the galaxy-richest clusters, the large velocity dispersions may lead this method to underestimate the local galaxy density due to some companion galaxies falling outside of the selected range.
We designated  and
and  as the number of cosmological neighbors lying within 500 kpc and a two Mpc distance from the central radio galaxy, respectively, and they provide an estimate of the environmental richness. As shown in Fig. 1, it is quite evident that the Ngal parameter (cluster richness from Tempel et al. 2012) underestimates the group or cluster richness, and there are only a few cases in which
  provides a lower estimate of the group or cluster richness.
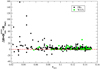 |
Fig. 1. Difference (ΔN) between the number of cosmological neighbors lying within a two Mpc distance from the central radio source ( |

4. Parameter definitions
Using the distribution of the cosmological neighbors, it is possible to define several parameters that can be used to investigate the properties of the large-scale environments of WATs and FR Is and FR IIs (hereafter, FRs).
We thus defined the following quantities: The “average projected distance  ” is the average distance of the distribution of cosmological neighbors within two Mpc from the central radio source; the “standard deviation σz” refers to the redshift distribution of the cosmological neighbors surrounding each radio source within two Mpc, and the “concentration parameter ζcn” is defined as the ratio between the number of cosmological neighbors lying within 500 kpc and within one Mpc. Under the assumption that the cosmological neighbors are uniformly distributed around the analyzed radio galaxy (given that the number of sources around a random position in the sky scales as N ∝ ϑ2, where ϑ is the angular separation from the selected position), we should observe a value of ζcn equals 0.25. This parameter allowed us to test if the analyzed radio galaxy tends to lie close to the center or in the outskirts of the group or clusters of galaxies in which it resides, if present.
All values of the environmental parameters for the WAT sample described above are reported in Table A.1.
5. Statistical analysis
In this section, we present the results obtained from the statistical analysis of the large-scale environments of WATs by means of the environmental parameters previously defined. We also searched for possible differences between the environmental properties of WATs and FRs during our analysis.
In Fig. 2, we have plotted the medians of the number of cosmological neighbors within 500 kpc (upper panel) and two Mpc (lower panel) from the WATCAT sources. We observed that median values for the WAT sample are systematically higher than that of FRs (with the exception of only the redshift bin 0.08–0.09). If we expect that the medians for the WAT sample are distributed randomly, we would therefore have the same probability of finding median values for WATs higher or lower than those of the FRs. According to the binomial distribution, we found that the probability that WATs’  are less than FRs’
  is ∼0.4% and that WATs’ N
 are less than FRs’
  is ∼2%. Therefore, we obtained some indications that WATs live in galaxy environments that are richer than that of FRs, but given the small sample of WATs, the significance is too low to draw firm conclusions (even if we would expect richer environments given the general consensus that WATs morphology is due to merger effects). This result is in agreement with the results reported in Golden-Marx et al. (2021) for high-z bent radio sources, where the authors find that richer clusters host narrower-bent radio sources.
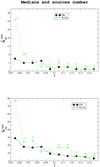 |
Fig. 2. Median values of the number of cosmological neighbors for the WATs (green) and the FRs (black) per bin of redshift z. Upper panel: median values of the cosmological neighbors within 500 kpc. Lower panel: median values of the cosmological neighbors within two Mpc. Above each median value, we also report the number of sources in each bin of z starting from 0.05. |
We then explored the distribution of the average projected distance  of the cosmological neighbors. This parameter, which provides an estimate of the galaxy group or cluster physical size, is shown as a function of the standard deviation σz of their redshifts (see Fig. 3, upper panel) and as a function of the redshift of the central source zsrc (see Fig. 3, lower panel). In the lower panel, we also overplotted the mean value of the average projected distance in each redshift bin of 0.01. In the upper panel of Fig. 3, the standard deviation σz of the cosmological neighbors’ redshifts are shown not to exceed a value of 0.003, which is consistent with the threshold of Δ z = |zsrc − z|≤0.005 used to select the cosmological neighbors. In the lower panel of the figure, all the sources in the WATCAT are shown to be clustered around a value of
  Mpc, implying that the size of the galaxy cluster or group in which the WAT is hosted is constant at low-z, and there are no values of
  larger than 1.2 Mpc, further implying that WATs tend to occupy the central region of the galaxy group/cluster that they inhabit. The observed scatter of the average projected distance values at high-z is due to the low number of cosmological neighbors detected. The same results are reported as normalized distributions in Fig. 4.
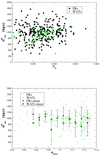 |
Fig. 3. Average projected distance |


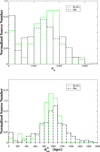 |
Fig. 4. Distribution of the standard deviation σz of the redshift distribution and of the average projected distance |


In Fig. 5, we show the distribution of the concentration parameter ζcn for WATCAT and FR sources. If we assume that the cosmological neighbors are uniformly distributed around the analyzed radio galaxy, we should observe a value of ζcn = 0.25. Instead, we found that the majority of the WATCAT sources (41 sources out of 47) have a value of ζcn higher than 0.25. This means that WATs tend to occupy the central region of the galaxy group or cluster in which they reside, which is in agreement with WATs being the BCGs. As shown in Golden-Marx et al. (2021), among the bent high-z radio sources considered in their study, some are indeed BCGs and others may evolve into BCGs. However, the lack of X-ray observation prevents us from comparing the ICM morphology with the spatial distribution of the cosmological neighbors. As pointed out in Vardoulaki et al. (2019), the radio morphology, and in particular how the morphology is disturbed, can be used to identify possible X-ray groups previously unidentified. As shown in Morris et al. (2022), bent sources are usually hosted in groups with a higher galaxy density than the groups hosting non-bent sources, and in general, bent sources are hosted in environments that are larger, denser, and less relaxed that unbent sources. As pointed out by the authors, these results would also benefit from X-ray observations, as they could help trace the ICM responsible for the bending.
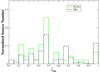 |
Fig. 5. pgDistribution of the concentration parameter ζcn estimated using the distribution of the cosmological neighbors. The black histogram refers to the FR I and FR II populations, and the green histogram refers to WATs. The largest fraction of their values lies above the expected value of 0.25 when assuming a uniform distribution of cosmological neighbors. |
6. Summary and conclusions
In this paper, we presented an extensive investigation of the large-scale environments of WATs in the local Universe (i.e., at zsrc ≤ 0.15). Our analysis made use of cosmological neighbors, defined as optical sources lying within two Mpc from the target source and with a redshift difference of Δ z ≤ 0.005 with respect to the radio galaxy lying at the center of the field examined. In our study, we also compared the large-scale environments of the radio galaxies classified as WATs with those of FR Is and FR IIs, all of which were selected from extremely homogeneous catalogs with uniform radio, infrared, and optical data available for all sources. For FR Is and FR IIs, Massaro et al. (2019) showed that independent of their radio morphological classification, they all have environments that are indistinguishable. For this reason, our goal was to investigate the environmental properties of our sample and to compare them with those already established for FR Is and FR IIs. We want to stress that this analysis cannot provide information on the intrinsic differences of the cluster hosting FRs and WATs, if any. We emphasize the importance of comparing radio sources in the same redshift bins to obtain a complete overview of their large-scale environments because this method takes into account cosmological biases.
Our main results are summarized as follows:
-
The median values of the number of cosmological neighbors within 500 kpc and two Mpc (
 and
and  ) are systematically higher than those of radio galaxies within a level of confidence of 0.4% and 2%, depending on
  and
and  , respectively;
 -
The average projected distance
 of the cosmological neighbors as function of the standard deviation σz of the redshift distribution of the cosmological neighbors and of the redshift zsrc of the sources is clustered around a distance of approximately one Mpc, implying that in the redshift range explored, WATs’ environments have similar sizes and do not exceed 1.2 Mpc, while there is no trend observed for FR Is and FR IIs;
 -
The typical values of the concentration parameter ζcn for WATs are well above the 0.25 value (it is greater or equal to 0.25 for 41 sources out of 47). This is expected considering a uniform distribution of cosmological neighbors around the central RG, implying that WATs tend to inhabit the central region of the galaxy group or cluster in which they reside and are therefore possibly associated with the BCG of the galaxy group or cluster.
We plan to extend our sample with observations from low radio frequency telescopes (e.g., LOFAR and the uGMRT) augmented with the analysis of WATCAT X-ray observations, such as the ones that eROSITA could provide in the future. We would therefore be able to estimate properties of the ICM, such as X-ray luminosity LX, mass, and environmental mass Menv, as well as X-ray fluxes. This information would complement the results obtained from the environmental parameters, given that both  and ζcn trace the position of the mass, not the gas. We also want to highlight that we have explored whether there is any link between
  and σz in comparison with the absolute magnitude in the R band of the radio galaxy, but no trend or link was identified. A similar situation occurred when comparing these two environmental parameters with radio power LR and emission line luminosity of the [OIII] (i.e., L[OIII]). These results can be compared with those presented in Croston et al. (2019) for a sample of radio-loud active galactic nuclei in the LOFAR Two-Metre Sky Survey (LoTSS) Data Release 1 catalogs. The authors find trends between the richness of the cluster and the radio luminosity and also investigated the position of the sources with respect to the cluster center. The absence of a trend in our sample could provide new insights into the different density of the environments observed for FRs and WATs.
Acknowledgments
We thank the anonymous referee for useful comments that led to improvements in the paper. This work is supported by the “Departments of Excellence 2018–2022” Grant awarded by the Italian Ministry of Education, University and Research (MIUR) (L. 232/2016). This research has made use of resources provided by the Compagnia di San Paolo for the grant awarded on the BLENV project (S1618_L1_MASF_01) and by the Ministry of Education, Universities and Research for the grant MASF_FFABR_17_01. This investigation is supported by the National Aeronautics and Space Administration (NASA) grants GO4-15096X, AR6-17012X and GO6-17081X. F.M. acknowledges financial contribution from the agreement ASI-INAF n.2017-14-H.0. F. M. wishes to thank Dr. C. C. Cheung for their valuable discussions on this project initially planned during the IAU 313 on the Galapagos islands. Funding for SDSS and SDSS-II has been provided by the Alfred P. Sloan Foundation, the Participating Institutions, the National Science Foundation, the U.S. Department of Energy, the National Aeronautics and Space Administration, the Japanese Monbukagakusho, the Max Planck Society, and the Higher Education Funding Council for England. The SDSS Web Site is http://www.sdss.org/. The SDSS is managed by the Astrophysical Research Consortium for the Participating Institutions. The Participating Institutions are the American Museum of Natural History, Astrophysical Institute Potsdam, University of Basel, University of Cambridge, Case Western Reserve University, University of Chicago, Drexel University, Fermilab, the Institute for Advanced Study, the Japan Participation Group, Johns Hopkins University, the Joint Institute for Nuclear Astrophysics, the Kavli Institute for Particle Astrophysics and Cosmology, the Korean Scientist Group, the Chinese Academy of Sciences (LAMOST), Los Alamos National Laboratory, the Max-Planck-Institute for Astronomy (MPIA), the Max-Planck-Institute for Astrophysics (MPA), New Mexico State University, Ohio State University, University of Pittsburgh, University of Portsmouth, Princeton University, the United States Naval Observatory, and the University of Washington. TOPCAT and STILTS astronomical software (Taylor 2005) were used for the preparation and manipulation of the tabular data and the images.
References
- Ascasibar, Y., & Markevitch, M. 2006, ApJ, 650, 102 [Google Scholar]
- Baldi, R. D., Capetti, A., & Giovannini, G. 2015, A&A, 576, A38 [NASA ADS] [CrossRef] [EDP Sciences] [Google Scholar]
- Baldi, R. D., Capetti, A., & Massaro, F. 2018, A&A, 609, A1 [NASA ADS] [CrossRef] [EDP Sciences] [Google Scholar]
- Banfield, J. K., Wong, O. I., Willett, K. W., et al. 2015, MNRAS, 453, 2326 [Google Scholar]
- Becker, R. H., White, R. L., & Helfand, D. J. 1995, ApJ, 450, 559 [Google Scholar]
- Bennett, C. L., Larson, D., Weiland, J. L., & Hinshaw, G. 2014, ApJ, 794, 135 [Google Scholar]
- Berlind, A. A., Frieman, J., Weinberg, D. H., et al. 2006, ApJS, 167, 1 [Google Scholar]
- Best, P. N. 2004, MNRAS, 351, 70 [NASA ADS] [CrossRef] [Google Scholar]
- Best, P. N., & Heckman, T. M. 2012, MNRAS, 421, 1569 [NASA ADS] [CrossRef] [Google Scholar]
- Blanton, E. L., Gregg, M. D., Helfand, D. J., Becker, R. H., & Leighly, K. M. 2001, AJ, 121, 2915 [CrossRef] [Google Scholar]
- Blanton, E. L., Paterno-Mahler, R., Wing, J. D., et al. 2015, IAU Proc., 10, S313 [CrossRef] [Google Scholar]
- Burns, J. O. 1981, MNRAS, 195, 523 [NASA ADS] [CrossRef] [Google Scholar]
- Capetti, A., Massaro, F., & Baldi, R. D. 2017a, A&A, 598, A49 [NASA ADS] [CrossRef] [EDP Sciences] [Google Scholar]
- Capetti, A., Massaro, F., & Baldi, R. D. 2017b, A&A, 601, A81 [NASA ADS] [CrossRef] [EDP Sciences] [Google Scholar]
- Carilli, C. L., & Barthel, P. D. 1996, A&ARv, 7, 1 [NASA ADS] [CrossRef] [Google Scholar]
- Croston, J. H., Hardcastle, M. J., Mingo, B., et al. 2019, A&A, 622, A10 [NASA ADS] [CrossRef] [EDP Sciences] [Google Scholar]
- Fanaroff, B. L., & Riley, J. M. 1974, MNRAS, 167, 31 [Google Scholar]
- Garon, A. F., Rudnick, L., Wong, O. I., et al. 2019, AJ, 157, 126 [Google Scholar]
- Giacintucci, S., & Venturi, T. 2009, A&A, 505, 55 [NASA ADS] [CrossRef] [EDP Sciences] [Google Scholar]
- Golden-Marx, E., Blanton, E. L., Paterno-Mahler, R., et al. 2021, ApJ, 907, 65 [NASA ADS] [CrossRef] [Google Scholar]
- Gómez, P. L., Pinkney, J., Burns, J. O., et al. 1997, ApJ, 474, 580 [CrossRef] [Google Scholar]
- Hill, G. J., & Lilly, S. J. 1991, ApJ, 367, 1 [NASA ADS] [CrossRef] [Google Scholar]
- Huchra, J. P., & Geller, M. J. 1982, ApJ, 257, 423 [NASA ADS] [CrossRef] [Google Scholar]
- Longair, M. S. 1971, Rep. Progr. Phys., 34, 1125 [CrossRef] [Google Scholar]
- Massaglia, S., Bodo, G., Rossi, P., Capetti, S., & Mignone, A. 2019, A&A, 621, A132 [NASA ADS] [CrossRef] [EDP Sciences] [Google Scholar]
- Massaro, F., Álvarez-Crespo, N., Capetti, A., et al. 2019, ApJS, 240, 20 [NASA ADS] [CrossRef] [Google Scholar]
- Miley, G. 1980, ARA&A, 18, 165 [Google Scholar]
- Missaglia, V., Massaro, F., Capetti, A., et al. 2019, A&A, 626, A8 [NASA ADS] [CrossRef] [EDP Sciences] [Google Scholar]
- Morris, M. E., Wilcots, E., Hooper, E., & Heinz, S. 2022, AJ, 163, 280 [CrossRef] [Google Scholar]
- O’Donoghue, A. A., Owen, F. N., & Eilek, J. A. 1990, ApJS, 72, 75 [CrossRef] [Google Scholar]
- Owen, F. N., & Rudnick, L. 1976, ApJ, 205, L1 [NASA ADS] [CrossRef] [Google Scholar]
- Prestage, R. M., & Peacock, J. A. 1988, MNRAS, 230, 131 [NASA ADS] [CrossRef] [Google Scholar]
- Smolčić, V., Schinnerer, E., Finoguenov, A., et al. 2007, ApJS, 172, 295 [CrossRef] [Google Scholar]
- Tago, E., Saar, E., Tempel, E., et al. 2010, A&A, 514, A102 [NASA ADS] [CrossRef] [EDP Sciences] [Google Scholar]
- Taylor, M. B. 2005, in Astronomical Data Analysis Software and Systems XIV, eds. P. Shopbell, M. Britton, & R. Ebert, ASP Conf. Ser., 347, 29 [Google Scholar]
- Tempel, E., Tago, E., & Liivamägi, L. J. 2012, A&A, 540, A106 [CrossRef] [EDP Sciences] [Google Scholar]
- Vardoulaki, E., Jiménez Andrade, E. F., Karim, A., et al. 2019, A&A, 627, A142 [NASA ADS] [CrossRef] [EDP Sciences] [Google Scholar]
- Wing, J. D., & Blanton, E. L. 2011, AJ, 141, 88 [CrossRef] [Google Scholar]
- Worrall, D. M., & Birkinshaw, M. 2000, ApJ, 530, 719 [NASA ADS] [CrossRef] [Google Scholar]
- York, D. G., Adelman, J., Anderson, J. E., Jr, et al. 2000, AJ, 120, 1579 [Google Scholar]
- Zirbel, E. L. 1997, ApJ, 476, 489 [Google Scholar]
Appendix A: Table
We report in Table A.1 all the parameters used for the analysis of the WATs presented in this work.
Properties of the WATCAT sources presented in this work with environmental parameter values.
All Tables
Properties of the WATCAT sources presented in this work with environmental parameter values.
All Figures
|
Fig. 1. Difference (ΔN) between the number of cosmological neighbors lying within a two Mpc distance from the central radio source ( |
| In the text | |
|
Fig. 2. Median values of the number of cosmological neighbors for the WATs (green) and the FRs (black) per bin of redshift z. Upper panel: median values of the cosmological neighbors within 500 kpc. Lower panel: median values of the cosmological neighbors within two Mpc. Above each median value, we also report the number of sources in each bin of z starting from 0.05. |
| In the text | |
|
Fig. 3. Average projected distance |
| In the text | |
|
Fig. 4. Distribution of the standard deviation σz of the redshift distribution and of the average projected distance |
| In the text | |
|
Fig. 5. pgDistribution of the concentration parameter ζcn estimated using the distribution of the cosmological neighbors. The black histogram refers to the FR I and FR II populations, and the green histogram refers to WATs. The largest fraction of their values lies above the expected value of 0.25 when assuming a uniform distribution of cosmological neighbors. |
| In the text | |
Current usage metrics show cumulative count of Article Views (full-text article views including HTML views, PDF and ePub downloads, according to the available data) and Abstracts Views on Vision4Press platform.
Data correspond to usage on the plateform after 2015. The current usage metrics is available 48-96 hours after online publication and is updated daily on week days.
Initial download of the metrics may take a while.