Fig. 3.
Download original image
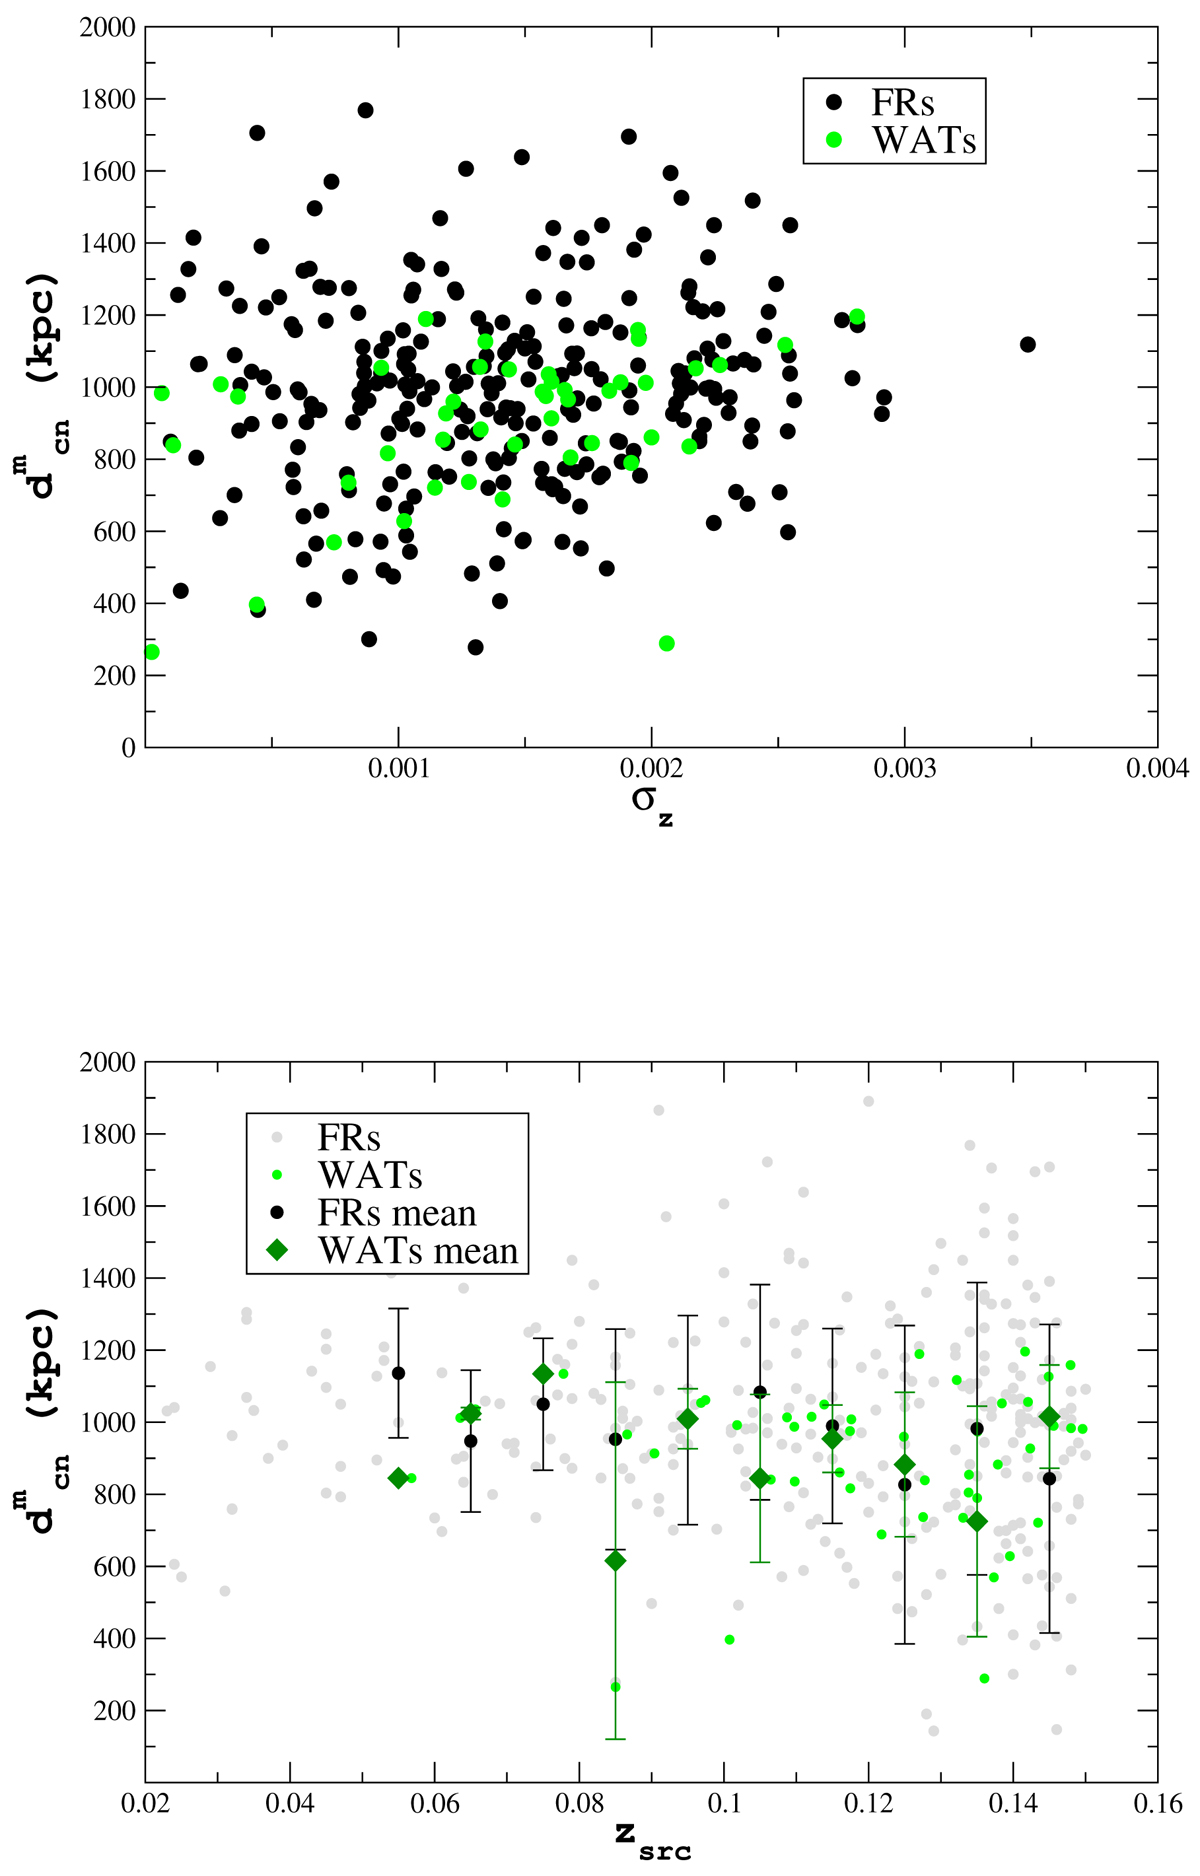
Average projected distance ![]() of the distribution of cosmological neighbors as a function of the standard deviation σz of their redshift distribution and of the redshift zsrc of the target radio source. Upper panel: average projected distance of the distribution of cosmological neighbors of FR Is and FR IIs (black circles) and WATCAT sources (green circles) is plotted as a function of the standard deviation σz of their redshift distribution. Lower panel: average projected distance of the distribution of cosmological neighbors of FR Is and FR IIs (gray circles) and WATCAT sources (green circles) plotted as a function of the redshift zsrc of the target radio source. In the lower panel, we also show the results as mean values per redshift bin (WATs are green diamonds and FR Is and FR IIs are black circles). The WATs cosmological neighbors are clustered around
of the distribution of cosmological neighbors as a function of the standard deviation σz of their redshift distribution and of the redshift zsrc of the target radio source. Upper panel: average projected distance of the distribution of cosmological neighbors of FR Is and FR IIs (black circles) and WATCAT sources (green circles) is plotted as a function of the standard deviation σz of their redshift distribution. Lower panel: average projected distance of the distribution of cosmological neighbors of FR Is and FR IIs (gray circles) and WATCAT sources (green circles) plotted as a function of the redshift zsrc of the target radio source. In the lower panel, we also show the results as mean values per redshift bin (WATs are green diamonds and FR Is and FR IIs are black circles). The WATs cosmological neighbors are clustered around ![]() Mpc. In the redshift bin 0.08–0.09, we observed a large scatter because there are only two sources and they have a large difference in the projected distance of the cosmological neighbors.
Mpc. In the redshift bin 0.08–0.09, we observed a large scatter because there are only two sources and they have a large difference in the projected distance of the cosmological neighbors.
Current usage metrics show cumulative count of Article Views (full-text article views including HTML views, PDF and ePub downloads, according to the available data) and Abstracts Views on Vision4Press platform.
Data correspond to usage on the plateform after 2015. The current usage metrics is available 48-96 hours after online publication and is updated daily on week days.
Initial download of the metrics may take a while.