Fig. 6.
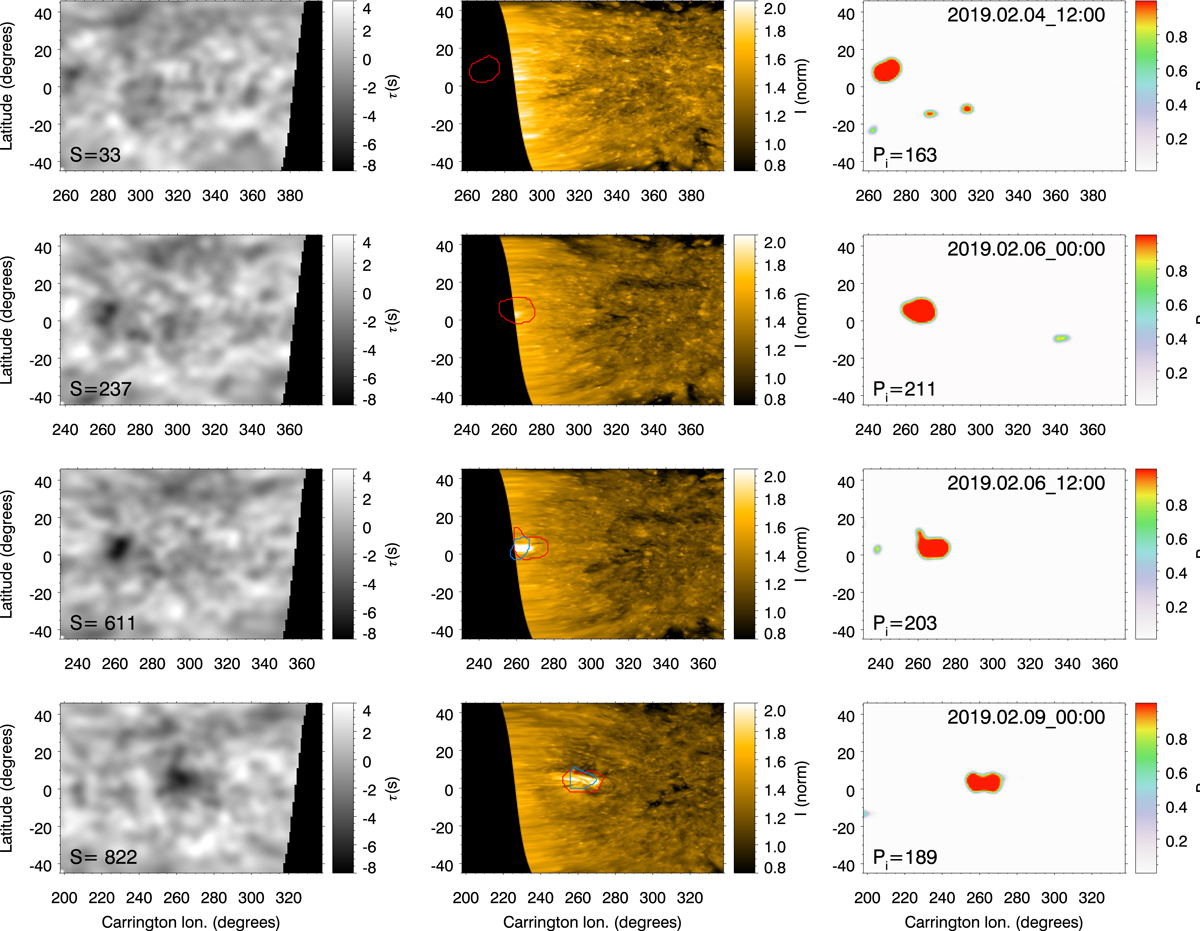
Detection of the far-side active region NN-2019-003 (FS-2019-001). Left column: far-side phase-shift maps obtained from 5 days of HMI Doppler velocity data. Bottom left corner of the panel: seismic strength of the strongest feature. Middle column: STEREO 171 Å data. Color contours indicate the active regions detected by the neural network (red) and by the traditional approach (blue). Right column: probability map, obtained as the output of the neural network. Bottom left corner of the panel: integrated probability of the strongest feature. Each row corresponds to a different time, indicated at the top part of the right panels.
Current usage metrics show cumulative count of Article Views (full-text article views including HTML views, PDF and ePub downloads, according to the available data) and Abstracts Views on Vision4Press platform.
Data correspond to usage on the plateform after 2015. The current usage metrics is available 48-96 hours after online publication and is updated daily on week days.
Initial download of the metrics may take a while.