Fig. 5.
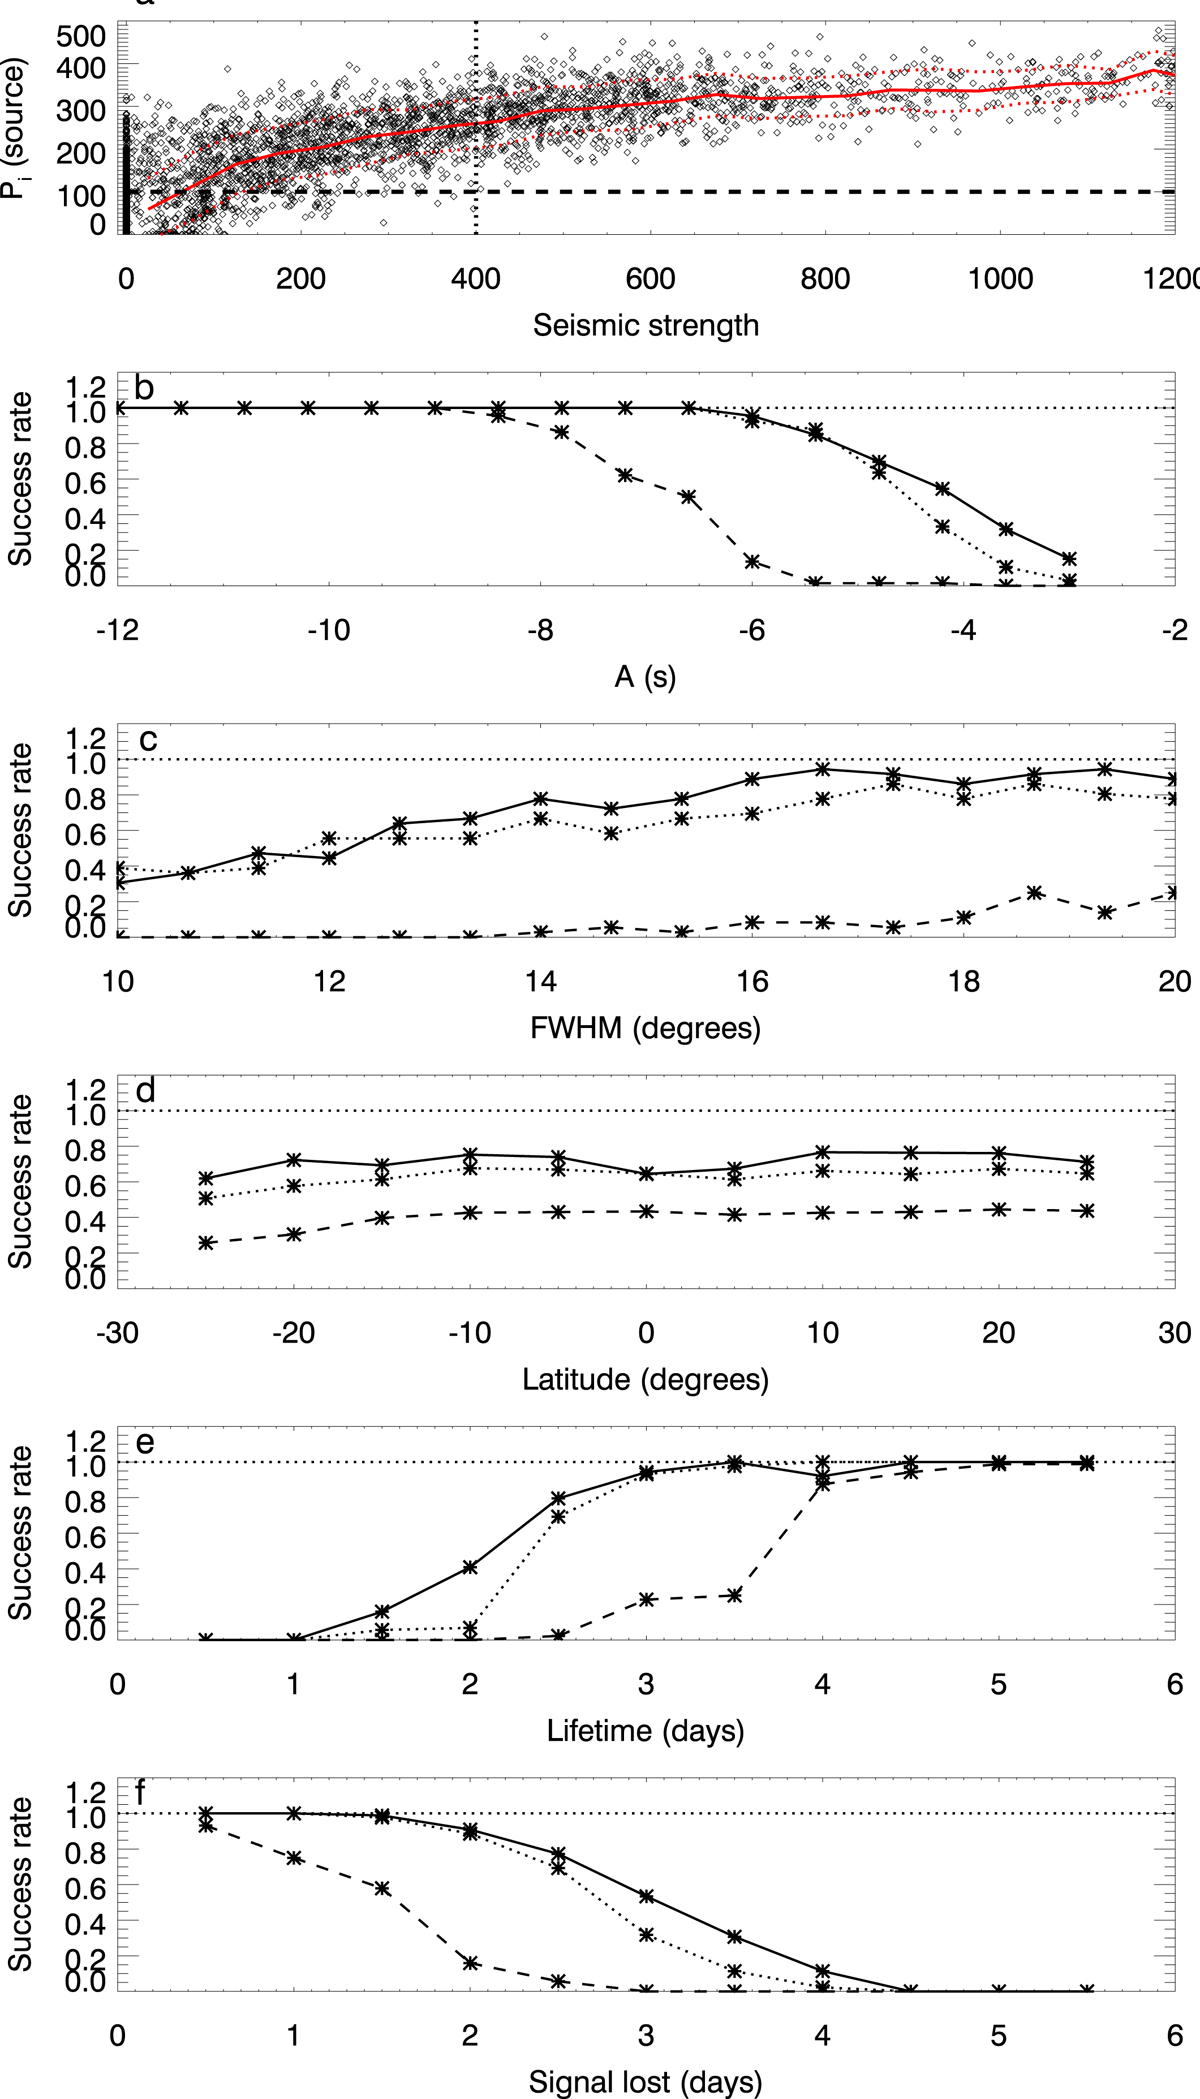
Analysis of 4048 artificial far-side maps. Panel a: integrated probability of the artificial acoustic source as a function of the seismic strength. The vertical black dotted line is the threshold for the identification of a far-side active region based on its seismic strength, and the horizontal black dashed line is the threshold for the detection of an active region using the neural network. The red solid line shows the integrated probability averaged in bins with a width of 50 in seismic strength. The red dotted lines illustrates the standard deviation of these averages. The rest of the panels shows the dependence of the success rate on the amplitude of the acoustic sources (panel b), their size (panel c), their latitude (panel d), their lifetime (panel e), and the number of seismic maps where the acoustic signal is lost (panel f). In panels b–f, the solid line with asterisks illustrates the success rate of the neural network, the dashed line with asterisks shows the success rate of the traditional method with a standard threshold of S = 400, and the dotted line with asterisks is the success rate of the traditional method with a threshold of S = 65.
Current usage metrics show cumulative count of Article Views (full-text article views including HTML views, PDF and ePub downloads, according to the available data) and Abstracts Views on Vision4Press platform.
Data correspond to usage on the plateform after 2015. The current usage metrics is available 48-96 hours after online publication and is updated daily on week days.
Initial download of the metrics may take a while.