Fig. 4.
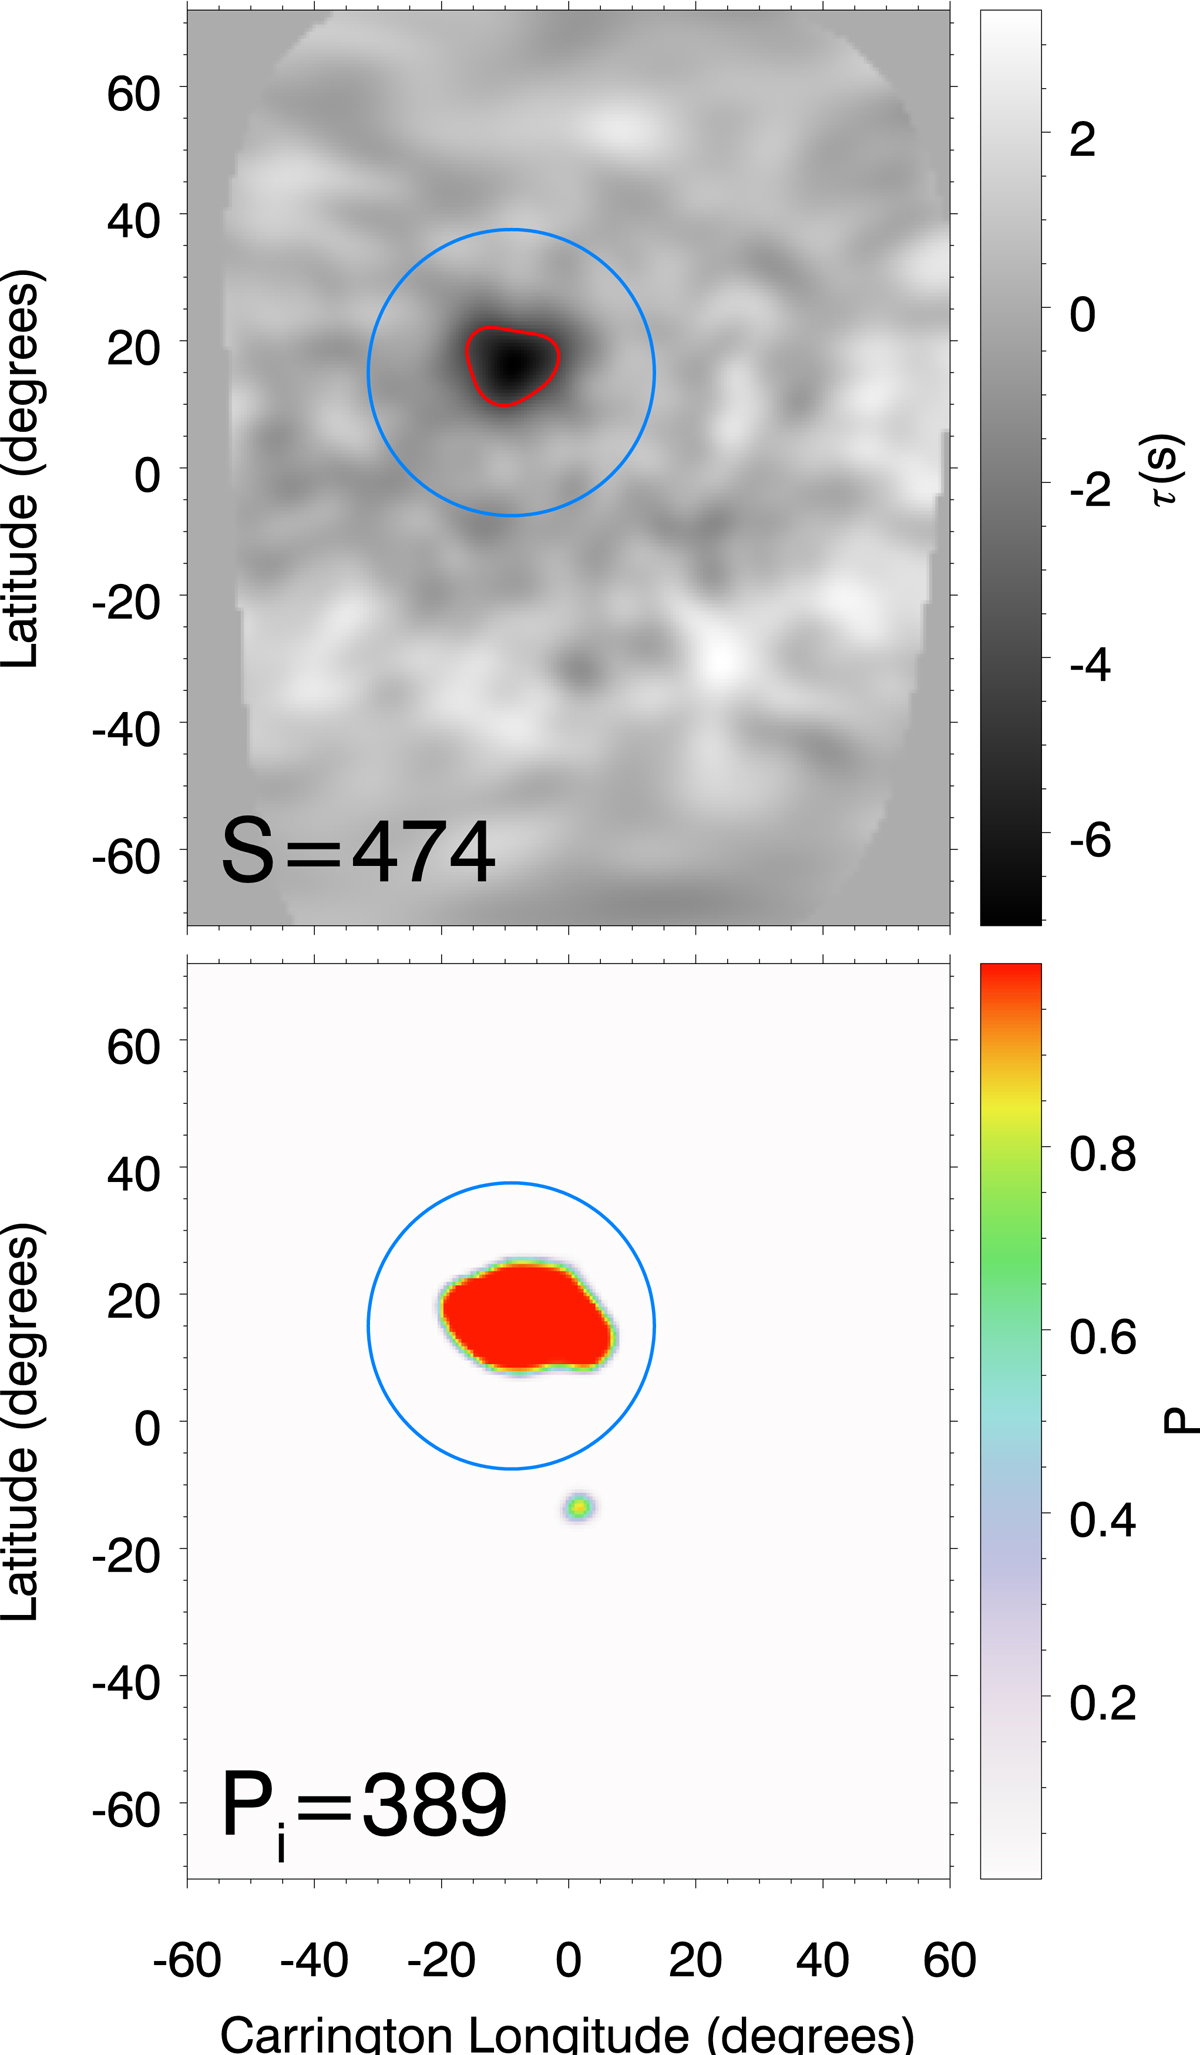
Top panel: five-day average of the phase shift for the artificial case illustrated in Fig. 3. The red contour delimits the region where the phase shift exceeds 0.085 rads. The strength of the acoustic source is shown in the bottom left corner. Bottom panel: probability map of the artificial active region illustrated in Fig. 3, as retrieved from the application of the neural network. The integrated probability Pi of the feature inside the blue circle is shown in the bottom left corner. In both panels the blue circle is centered at the location of the acoustic source, with a diameter of three times its FWHM.
Current usage metrics show cumulative count of Article Views (full-text article views including HTML views, PDF and ePub downloads, according to the available data) and Abstracts Views on Vision4Press platform.
Data correspond to usage on the plateform after 2015. The current usage metrics is available 48-96 hours after online publication and is updated daily on week days.
Initial download of the metrics may take a while.