Fig. 1.
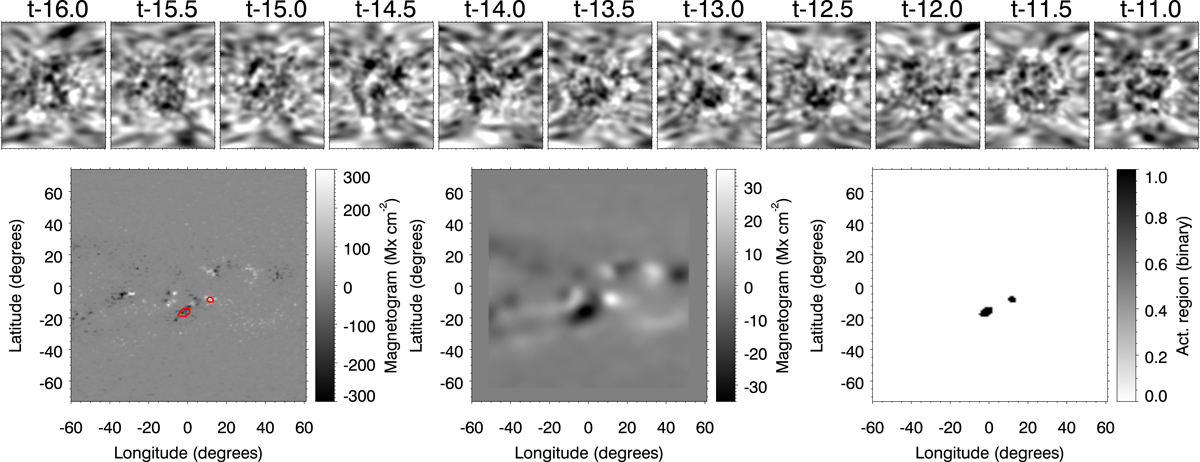
Example of one of the elements from the training set. Panels in the top row show 11 far-side seismic maps, each of them obtained from the analysis of 24 h of HMI Doppler data. The horizontal axis is the longitude (a total of 120°) and the vertical axis is the latitude (between −72° and 72°). The label above the panels indicates the number of days prior to the time t when the corresponding magnetogram was acquired (in this example, t is 2015 December 10 at 12:00 UT). Bottom row: magnetograms we used as a proxy for the presence of active regions. Left panel: original magnetogram in heliospheric coordinates, middle panel: magnetogram after active regions that emerged in the near side are removed and after a Gaussian smoothing was applied, and right panel: binary map in which a value of 1 indicates the presence of an active region in the locations whose magnetic flux in the smoothed magnetogram is above the selected threshold. Red contours in the bottom left panel delimit the regions where the binary map is 1. The neural network is trained by associating the 11 far-side seismic maps (top row) with the binary map.
Current usage metrics show cumulative count of Article Views (full-text article views including HTML views, PDF and ePub downloads, according to the available data) and Abstracts Views on Vision4Press platform.
Data correspond to usage on the plateform after 2015. The current usage metrics is available 48-96 hours after online publication and is updated daily on week days.
Initial download of the metrics may take a while.