| Issue |
A&A
Volume 630, October 2019
Rosetta mission full comet phase results
|
|
|---|---|---|
| Article Number | A2 | |
| Number of page(s) | 8 | |
| Section | Planets and planetary systems | |
| DOI | https://doi.org/10.1051/0004-6361/201833889 | |
| Published online | 20 September 2019 | |
Compressive strength of comet 67P/Churyumov-Gerasimenko derived from Philae surface contacts
1
Institut für Geophysik und extraterrestrische Physik (IGEP), Technische Universität Braunschweig,
Mendelssohnstr. 3,
38106
Braunschweig, Germany
e-mail: This email address is being protected from spambots. You need JavaScript enabled to view it.
2
Max-Planck-Institut für Sonnensystemforschung,
Justus-von- Liebig-Weg, 3,
37077
Göttingen, Germany
3
Deutsches Zentrum für Luft- und Raumfahrt e.V. (DLR),
Linder Höhe 1,
51147
Köln, Germany
Received:
17
July
2018
Accepted:
7
November
2018
Abstract
Context. The landing and rebound of the Philae lander, which was part of the ESA Rosetta mission, enabled us to study the mechanical properties of the surface of comet 67P/Churyumov-Gerasimenko, because we could use Philae as an impact probe.
Aims. The aim is to approximate the descent and rebound trajectory of the Philae lander and use this information to derive the compressive strength of the surface material from the different surface contacts and scratches created during the final touchdown. Combined with laboratory measurements, this can give an insight into what comets are made of and how they formed.
Methods. We combined observations from the ROMAP magnetometer on board Philae with observations made by the Rosetta spacecraft, particularly by the OSIRIS camera system and the RPC-MAG magnetometer. Additionally, ballistic trajectory and collision modeling was performed. These results are placed in context using laboratory measurements of the compressibility of different materials.
Results. It was possible to reconstruct possible trajectories of Philae and determine that a pressure of ~100 Pa is enough to compress the surface material up to a depth of ~20 cm. Considering all errors, the derived compressive strength shows little dependence on location, with an overall upper limit for the surface compressive strength of ~800 Pa.
Key words: comets: individual: 67P/Churyumov-Gerasimenko
© ESO 2019
1 Introduction
As part of the ESA Rosetta mission (Glassmeier et al. 2007a), the lander Philae touched down on comet 67P/Churyumov-Gerasimenko (67P) on November 12, 2014 at 15:34:04 UTC. Philae rebounded three times before it finally came to a stop in a region called Abydos. One of the primary objectives of the lander mission was to measure the surface properties (such as the compressive strength) of 67P in situ to determine what comets are made of and where they formed. While the growth of kilometer-sized planetesimals to larger planet-sized objects in the early solar system is well understood, it is still under debate how smaller objects formed out of sub-decimeter-sized dust aggregates (see Blum 2018 for a recent review). Because of their primitive nature, comets are the best candidates for planetesimals and possibly the sole small survivors of the planet-formation era (Davidsson et al. 2016), although they might have experienced a few collisions since formation (Morbidelli & Rickman 2015). The mechanical strength of the cometary material strongly depends on the formation history and evolution of the nucleus (Blum et al. 2014). Thus, measurements of mechanical properties can be used to study the origin and evolution of comets, and can thereby provide the missing link between protoplanetary dust and planets. Two different processes are currently discussed as the main driver behind comet nucleus formation: gravitational instability combined with a gentle collapse of pebble-sized dust aggregates (Johansen et al. 2007; Blum et al. 2017), or hierarchical agglomeration (Weidenschilling 1997; Davidsson et al. 2016).
In the first scenario, comets are believed to have formed in the young solar system by the gentle gravitational collapse of dust clouds, typically consisting of sub-decimeter-sized aggregates (Johansen et al. 2007). The nature of this process means that the nucleus mostly consists of intact dust aggregates (Blum et al. 2017) that have survived the comet formation owing to low impact velocities of less than 1 m s−1 during collapse and have thus experienced relatively little compression (Wahlberg Jansson & Johansen 2014; Wahlberg Jansson et al. 2017). In contrast, hierarchical agglomeration is based on growth by high-velocity impacts (up to ~50 m s−1) onto the cometesimal to form the cometary nucleus. Compared to a gentle gravitational collapse, this scenario leads to an increased mechanical strength and volume filling factor that is due to the higher compaction of the material (Blum 2018). Hence, in situ measurements of the mechanical properties like the compressive strength allows testing these formation hypotheses. The nature of 67P is most likely primordial (Davidsson et al. 2016), which makes it an ideal candidate for these types of studies.
Several different estimates for the compressive strength σ have been published. Spohn et al. (2015) derived a uniaxial lower limit of 2 MPa based on the results of a spot measurement with the Philae MUPUS hammer experiment. Biele et al. (2015) and Roll et al. (2016) estimated a surface compressive strength in the order of 1 kPa based on an analysis of the mechanics of Philae’s first touchdown. By analyzing the collapse of cliff overhangs observed from orbit, Groussin et al. (2015) inferred a compressive strength of between 30 Pa and 150 Pa.
In this paper we derive an upper limit for the surface compressive strength by using the Philae lander as an impact probe. The compressive strength is determined based on the energy balance and geometry of Philae’s contacts. While the lander initially touched down in an area covered by fallback dust, the other contacts (in the following the contacts between Philae and 67P are called first touchdown, collision, second touchdown, and third touchdown, in line with Auster et al. 2015 and Biele et al. 2015) took place in more consolidated areas without significant fallback. Deriving the compressive strength based on the energy balance requires reasonable knowledge of the contact duration and corresponding geometry. Reconstructions of the first touchdown (Biele et al. 2015; Roll & Witte 2016; Roll et al. 2016) showed that Philae pivoted several times between the individual landing feet. As the exact sequence of these events can only be estimated based on simulations, it is impossible to derive the contact geometry and corresponding contact duration. Additionally, in contrast to the subsequent surface contacts, the landing gear damper system was engaged during the initial touchdown, actively dissipating some of the kinetic energy. In this study we therefore did not revisit the first touchdown. The energy balance and compressive strength was only derived for the collision, second touchdown, and third touchdown.
To determine the total kinetic energy balance (translational and rotational energy) for each of the surface contacts, it is necessary toknow the incoming and outgoing velocities and the rotation rate of the lander during flight. While the velocities can be derived from the corresponding trajectories, the rotational energy was determined based on the rotation frequencies provided by Heinisch et al. (2017a). In the following section, the locations of the individual touchdowns are discussed and used to derive the required velocities based on assumed ballistic flight parabolas, taking into account previous reconstructions by Auster et al. (2015), Biele et al. (2015), and Heinisch et al. (2017a). In a next step, attitude information gained from two-point magnetic field observations by the ROMAP (Auster et al. 2007) and RPC-MAG (Glassmeier et al. 2007b) magnetometers based on the work of Heinisch et al. (2016, 2017a) and Richter et al. (2016) is used in conjunction with a digital terrain model of 67P (Preusker et al. 2017) to determine the geometry of the contacts. This is necessary to calculate the contact pressure (force per contact area). The compressive strength is finally calculated based on the total energy balance, contact geometry, and duration of the surface contacts.
Next, we combine attitude information for the last part of the trajectory up until third touchdown with scratches visible in the images of the lander at Abydos. As these features were most likely created by Philae, they can be used to constrain the surface compressive strength as well. Finally, the implications of these results are discussed.
2 Trajectory and attitude reconstruction
As the first and final landing sites were photographed from orbit (see Fig. 1), the respective positions were determined based on these images. For the first touchdown at Agilkia, the Cartesian (x, y, z) coordinates (2.12, −0.96, 0.50) km given by Biele et al. (2015) were used, while for Abydos (final location of Philae), the estimates (2.45, −0.07, −0.34) km of Heinisch et al. (2017a) were used. All coordinates are given in the 67P body-fixed CHEOPS coordinate system (SPICE: 67P/C-G_CK). The NASA NAIF SPICE system (Acton 1996) was used to facilitate the coordinate calculations.
The trajectory between first touchdown and collision was constrained by the flight time, surface structure, and an image of Philae and its shadow in flight, taken approximately 10 min (15:45:02 UTC) after first touchdown (see Fig. 2a). Based on this image, Philae’s approximate position at 15:45:02 UTC was (2.27, −0.88, 0.36) km. By combining this information with the coordinates of first touchdown, the direction of flight was determined (see Fig. 2). The flight time t1 = (2756 ± 3) s was derived based on the time between the initial touchdown and the collision. Assuming a free ballistic trajectory (similar to Auster et al. 2015) with a mean local gravitational acceleration of g ≈ 1.6 × 10⁻⁴ m s−2 (based on Biele et al. 2015), a possible area (approximately 120 m × 90 m) for the collision was identified using the latest SHAP7 digital terrain model (Preusker et al. 2017). This area was selected based on the flight direction, taking into account the preliminary collision coordinates proposed by Heinisch et al. (2017a), the flight time, and uncertainties in the digital terrain model. As the aim of this analysis is to estimate the velocities and kinetic energy for the rebound, it is not necessary to determine the exact contact locations or definitive trajectories. To simplify computation and be independent of a specific version of the terrain model, the area of interest was approximated by three planes placed parallel to the local surface to reflect the different slopes of the Hatmehit crater rim.
Possible locations for second touchdown are constrained by the estimated position of the collision (taking uncertainties in the location into account) and the known final landing site. A cliff-like structure visible in the upper right-hand corner of Fig. 2 further restricts the trajectory, as Philae would not have been able to clear the top of this cliff (relative height ~60 m) on a ballistic flight coming from the collision site. Hence the site of second touchdown must be between this cliff and the location of the collision. This yields an estimated flight direction relative to third touchdown given by (0.15, −0.95, 0.27) km, as previously described by Heinisch et al. (2017a). Based on the flight time between second and third touchdown of only t3 = (215 ± 3) s, the locations of the two touchdowns must be close together. A rough initial estimate for the horizontal velocity between the collision and second touchdown can be derived from the corresponding flight time t2 = (3926 ± 3), preliminarily assuming the locations of second and third touchdown to be identical. When we combine this estimated velocity with the flight directions, we find the area highlighted in red in Fig. 2b. The center of this region is approximately at (2.45, −0.07, −0.34) km. Even though the available information is not enough to determine a definitive touchdown site, the derived area is sufficient for the purpose of this study.
Based on the derived touchdown positions, we calculated the velocities and corresponding kinetic energies for each possible part of the trajectory. Combined with the rotation rates determined from magnetic field observations, the total energy balance of the reboundwas derived. To facilitate this, the possible areas for the individual touchdowns were discretized with a spatial resolution of1 m in each direction and the trajectories for each of these points were calculated. To determine the horizontal and vertical velocity components during the ballistic flights, a simple horizontal motion with constant velocity vh and a vertical motion upwards with a constant initial velocity, combined with a free fall were used. Because of the difference in relative height (Δh), the outgoing vertical velocity (vvO) after contact can differ from the incoming vertical velocity (vvI) of the following contact. The horizontal and vertical components of the velocity were calculated using
 (1)
(1)
 (2)
(2)
where d denotes the horizontal distance and Δh the height difference between the touchdowns. The incoming vertical velocity was calculated based on the outgoing velocity of the previous surface contact:
 (3)
(3)
The flight time tf was determined based on the time of the individual contacts to be t1 = (2756 ± 3) s for the flight between first touchdown and collision, t2 = (3926 ± 3) s for the flight between collision and second touchdown, and t3 = (215 ± 3) s for the last part of free flight after second touchdown. The rotational energy was calculated using
 (4)
(4)
with frot being the rotation frequency and IPL denoting the moment of inertia, which is ~16.6 kg m2 for rotation around the main body-axis (lander z-axis), ~ 15.9 kg m2 for rotation around the front landing gear axis (lander x-axis), and ~14.6 kg m2 along the axis parallel to the lander balcony (y-axis; Biele et al. 2015; Roll et al. 2016). During collision, the rotation pattern of the lander changed significantly, from a simple rotation along the body-axis (perpendicular to the landing gear plane) with a frequency of f1 = (77.0 ± 1.0) mHz to a precession with a frequency of f2 = (42.0 ± 1.0) mHz. After second touchdown, Philae had lost most of the rotational energy, spinning only with about f3 = (2.0 ± 0.5) mHz. The flight times, the rotation rates, contact times, contact geometry, and lander attitude used in the following sections were all taken from Heinisch et al. (2016, 2017a). All these values are also summarized in Table 1. The resulting total velocity and energy distributions for collision and second touchdown are depicted in Fig. 3.
During the collision, no significant acceleration along the body-axis (Philae z-axis) perpendicular to the landing gear was detected, in contrast to the other touchdowns. This constrains the direction of the contact force to the landing gear plane. As the acceleration vector was approximately orthogonal to the lander body-axis and in line with the landing gear during contact, Philae must have struck the comet with the side structure of the foot assembly and not with the soles of the feet. This is the major difference between this collision and the other touchdowns and the reason that Auster et al. (2015) introduced the different naming scheme. The approximation of the direction of acceleration was made possible by the fact that the ROMAP magnetometer was mounted at the end of a spring-supported boom. An assembly like this causes the magnetometer to swing from its nominal position as soon as the lander is accelerated perpendicular to the hinge axis. As the natural frequency of the boom assembly is significantly above the excitation caused by the surface contacts, the boom movement correlates to the impact acceleration. As the background magnetic field is known (Heinisch et al. 2017b), this movement can be tracked using the magnetic field measurements, turning ROMAP into a simple accelerometer.
The attitude just after second touchdown implies that the balcony was pointing toward the comet and at least one foot, the tip of the ROMAP boom, and possibly part of the balcony were in contact with the surface. This was confirmed by a deflection of the ROMAP boom away from the landing gear and the fact that the ROMAP plasma sensor was covered by dust (Heinisch et al. 2017a). The position of the entrances of the plasma monitor means that the sensor head must have penetrated the surface at least ~ 5 cm for the senor entrances to become covered by dust. This contact caused an upward deflection of the boom, as it is only supported by springs. As the plasma sensors housekeeping data remained nominal for the entire time, the sensor could not have sustained damage during contact. Especially the delicate charged retarding grids at the sensor entrance were not damaged. Considering an impact velocity of ≈ 0.22 m s−1, this is already a qualitative indication that the surface material has to be soft.
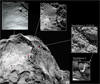 |
Fig. 1 Overview of the four contact sites on the upper lobe of comet 67P. All contacts took place during Philae’s descent on November 12, 2014. The zoomed-in inlays show the differences in morphology between the four contacts. The possible areas of contact are circled in white. The flight direction is illustrated by the red arcs. |
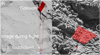 |
Fig. 2 Panela: possible area for the collision event overlaid on the digital terrain model (SHAP7) and the estimated trajectory (constrained by red lines, direction indicated by white arrow) from first touchdown, including the position of Philae in flight as seen in OSIRIS camera images. Panel b: possible area for second touchdown overlaid on an OSIRIS image. The incoming flight direction is indicated by a red arrow. Philae is visible to the right at its final locations (circled). |
Summary of the underlying values and results for the collision and second touchdown.
3 Compressive stress
The rebound of Philae offers the possibility of determining the compressive strength σ, which can be described as the threshold between plastic and elastic deformation. If the applied load is below the compressive strength limit of the material for a given area, the contact will be virtually elastic, with negligible loss of kinetic energy leading to rebounding. This would cause a strong but transient acceleration. Otherwise, the contact becomes inelastic as a result of plastic deformation or reordering of the material (e.g., Schräpler et al. 2015). As an inelastic contact is linked to a penetration of the material, the acceleration is weaker but spread out over a longer interval. Thus, an upper estimate can be derived by examining the load on the cometary material applied during contact and change in kinetic energy linked to it. Granular material behaves differently under load than regular solids (Biele et al. 2009), for example, exhibiting slip-stick interaction (Cole & Peters 2007). Hence, standard elastoplastic models (e.g., Li et al. 2001; Yigit et al. 2011)cannot be used. As there is no general description of the behavior of granular material under load (Cole & Peters 2007), a constant deceleration and hence a constant breaking force during contact is assumed. Even though this is not an exact description of real granular cometary material, it generally leads to an overestimation of the compressive strength, which is of no concern as we are only interested in an upper bound. Furthermore, additional energy losses inside the lander structure are neglected (similar on Biele et al. 2015). With these assumptions, an upper bound for the compressive strength of the material can be derived based on the total loss of energy using
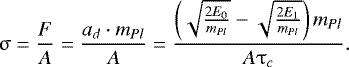 (5)
(5)
Here F is the breaking force linked to the deceleration ad. E0 and E1 denote the total energy before and after impact, respectively, τc is the contact duration, and A is the area of contact between the landing gear and the surface. The contact duration τc was determined from the movement of the ROMAP magnetometer boom caused by the acceleration during contact. As the boom is only supported by two springs, it can be deflected if an external acceleration is applied. This movement creates a characteristic signature in the observed magnetic field, which can be used to derive the duration of the acceleration (Heinisch et al. 2017a). The area of contact A was determined based on the known geometry of the landing gear, particularly the feet, combined with the angle of attack of the lander relative to the surface (derived from lander attitude) just before contact. The parameter mPl = 97.63 kg (Biele et al. 2015) is the mass of Philae. As we are primarily interested in an upper bound for σ, it is assumed that the change in total kinetic (E = Erot + Ekin) energy is only linked to the surface interaction. Hence the deceleration is determined based on the total loss of energy during contact and not just on the translational velocity.
For the collision event, the total energy E0 before contact was (7.02 ± 0.37) J, which decreased to E1 = (2.83 ± 0.22) J afterward. Based on the reconstructed attitude (Heinisch et al. 2017a), Philae struck the surface with only one foot. In contrast to first touchdown, the foot hit the comet not with the soles, but with the side of the foot structure, which leads to a contact area of A = (225 ± 40) cm2. This area was estimated based on the CAD model of the foot assembly (depicted in Fig. 4) and a plane angled relative to the foot to represent the attitude of the lander. Even though the exact angle between the local surface and the foot is unknown, angular deviations only lead to small changes in the area of contact because of the specifics of the foot design. The contact time τc = (1.5 ± 1.0) s was determined from the acceleration derived from ROMAP observations, as explained above. This leads to an upper limit for the compressive strength of σ = (399 ± 393) Pa.
The same approach was used for second touchdown. The kinetic energy E0 before contact was (2.97 ± 0.15) J, which is slightly higher than directly after the collision because of the difference in height between thearea of the collision and second touchdown. Afterward, the energy dropped to E1 (0.10 ± 0.02) J. The different contact geometry (at least one foot and magnetometer boom) leads to a higher contact area of (350 ± 75) cm2 and a longer contact duration of τc = (4 ± 1) s compared to the collision. This results in a compressive strength σ = (147 ± 77) Pa. These results are summarized in Table 1.
Images of Philae at the final Abydos landing site (Fig. 5) revealed several scratch features (SA, SB, and SC). Scratches SA and SB are located to the left of the lander and have a length of ~1.8 m, a width of ~11 cm, and are ~42 cm apart. The length was derived from the number of pixels while accounting for projection effects and using the known dimensions of the lander for validation. It is possible that the lengths of SA and SB are slightly underestimated, as the boulder is only visible up to the edge of what is depicted in Fig. 5. The imaging geometry means that some parts could be hidden behind smaller boulders in the foreground. Based on the size of these structures, a possible length error of 0.2 m was determined. The scratches are aligned with the incoming flight path of the lander coming from second touchdown (see Fig. 2 for reference). As all high-resolution images of this area were taken almost at the same time with similar geometry and lighting, it is impossible to reconstruct the exact 3D topography. Therefore the directionality of the scratch marks cannot be used to extrapolate the exact position of second touchdown. Based on the available local terrain model, it is only possible to estimate the approximate flight direction after second touchdown. No other parallel structures at scales comparable to the scratch marks are visible in the images of the landing area (Bibring et al. 2015; Poulet et al. 2016), which suggests that the scratches were made by Philae. From the attitude information derived from the magnetometer measurements (Heinisch et al. 2017a), we can infer that two of the landing legs were pointing toward the surface shortly before third touchdown. This makes it likely that the lander skidded across the surface for the final ~ 1.8 m, causing scratch marks SA and SB.
A third feature (scratch SC) with a length of approximately 30 cm is visible above Philae next to one of the feet. We assume that scratch SC was created while Philae came to a stop after it cleared the cliff (bottom left-hand corner in Fig. 5) and tilted while hitting the wall it now rests on. As the direction of scratch SC is parallel to the lander z-axis, the deceleration caused an observable movement of the ROMAP boom, which was visible in the magnetic field observations from 17:31:16 ± 1 s until 17:31:26 ± 1 s UTC.
The width of the scratches and the size of Philae’s leg structure indicates that only the soles of the feet have been in contact with the ground. This constrains the maximum penetration depth to approximately ~ 5 cm (see Fig. 4 for the dimensions of the foot), which is half the diameter of the soles. Otherwise, the significantly larger upper foot structure (see Fig. 5 for the total scale of the landing gear) would have been in contact with the surface, causing substantial drag and considerably larger scratch marks in the range of ~ 25 cm. A width-to-depth ratio of ~2 is also consistent with other depressions found on 67P (El-Maarry et al. 2015) and can be considered realistic for the surface material. It is impossible to derive the actual depth of the scratches from the images because of the diffuse lighting conditions. From the characteristics of the scratches, it is possible to estimate the contact pressure σ analogous to Eq. (5) based on the mechanical work done during creation of the scratches:
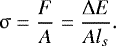 (6)
(6)
Here A is again the area of contact, F is the breaking force, ΔE denotes the mechanical work done while creating the scratches, and ls is the length of the scratches. While the material in front of the foot is compressed, additional energy is required to overcome the shear and tensile strength (see, e.g., Akono & Ulm 2011 for scratch modeling) at the boundary of the cometary material and the outer rim of the foot. As the aim of this study is to derive an upper limit for the compressive strength, it was assumed that the entire energy lost during the creation of the scratches was due to compression, hence leading to the highest possible compression force and preventing underestimation of the compressive strength.
To determine ΔE for scratches SA and SB, the remaining velocity afterward was estimated as half of the mean initial velocity (again assuming constant deceleration) as a conservativefirst-order approximation, based on the impact drag force analysis performed by Katsuragi & Blum (2017). The overall ratio of the individual values means that minor changes in the velocities would not cause major changes in the resulting compressive strength,
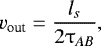 (7)
(7)
with τAB = (36 ± 5) s and ls = (1.8 ± 0.2) m, resulting in vout = (0.03 ± 0.006) m s−1. This yields a remaining kinetic energy of the lander of (0.04 ± 0.01) J, which combined with an incoming kinetic energy of (0.10 ± 0.02) J (see above) translates into ΔE = (0.06 ± 0.03) J. With a contact area of AAB = (41 ± 10) cm2 estimated based on the foot geometry and penetration depth, this yields an upper limit for the compressive strength of σ = (8 ± 7) Pa. Because of the change in attitude and single foot contact while scratch SC was created, the contact area was smaller, with AC = (20 ± 10) cm2. With the remaining energy of (0.04 ± 0.01) J lost during contact and a length of the scratch of ls = (0.3 ± 0.1) m, the resulting limit for the compressive strength is σ = (73 ± 70) Pa. These results are summarized in Table 2.
Even though the force necessary to plow through the material depends on several material properties, the resulting pressure is dominated by the compressive properties of the material. The compressive strength is expected to be the highest by afactor of roughly 10, especially due to the low gravitational compression of the material (e.g., Groussin et al. 2015).
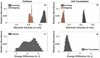 |
Fig. 3 Histogram of the incoming and outgoing total velocities for the collision (panel a) and second touchdown (panel b) calculated based on each possible trajectory using a spatial resolution of 1 m. Panels c and d: difference in energy before and after collision and second touchdown, respectively, which is equal to the work done during theses contacts. |
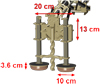 |
Fig. 4 Illustration of one of Philae’s feet based on a rendering of the 3D lander CAD model. The approximate dimensions of the soles and the upper feet structure are given in red. |
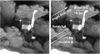 |
Fig. 5 OSIRIS camera image of the Philae lander at the final Abydos landing site. The right panel is annotated to show the scratch marks “A”, “B” and “C”, the approximated incoming flight direction is depicted by a white arrow. The image resolution is approximately 7 mm px−1. |
Summary of the underlying values and results for scratches A, B, and C.
4 Results and conclusions
The in situ results we presented for the compressive strength span a range between 7 Pa and 399 Pa, which agrees well with the compressive strength of 30 Pa to 150 Pa estimated from remote observations by Groussin et al. (2015). Deviations between the upper limitsfor the compressive strength values derived for the individual contacts can most likely be attributed to variations in local material. While the comet is homogeneous on larger sales, local differences in insolation, the dust-to-ice ratio (due to different outgassing rates) or volume filling factor are expected and lead to local deviations in the compressive strength. Possible uncertainties in the area of contact between the lander and the surface and errors in the estimated trajectories can also contribute to the differences, but these deviations should be covered by the conservative error range. Owing to the simplified mechanical model and the limited range of available measurements, the resulting compressive strength is only a local upper limit, without taking higher-order mechanical characteristics of granular material into account.
Based on the mechanical interaction during the surface contacts, a compressive pressure below 100 Pa is already enough to cause significant compaction of the surface material. This compaction led to an increase in compressive strength, which caused Philae to rebound at ~160 Pa. This kind ofmaterial makes comets like 67P an ideal target for lander missions as the surface is strong enough to support the weight of a probe without overpenetration, but is also soft enough to dissipate the kinetic energy during touchdown.
The range for the compressive strength derived above is slightly below the value of 1 kPa estimated by Biele et al. (2015) from first touchdown, which can largely be attributed to the difference in dust coverage. In contrast to the first landing site Agilkia, neither the cliff near the Hatmehit crater nor Abydos have significant surface dust layers (see Fig. 1; Schröder et al. 2017; Keller et al. 2015; Thomas et al. 2015). Hence, the mechanics of the subsequent contacts were not governed by surface dust layers and therefore provide insight into the properties of the more consolidated surface regions. This is also the reason why the scratch marks at Abydos are still visible two years after Philae landed, and it shows that regions that might look consolidated can in reality be extremely soft. Based on the hammering of the MUPUS instrument, Spohn et al. (2015) postulated a compressive strength of 2 MPa for the Abydos site, which is significantly above the independently derived results of Biele et al. (2015) and Groussin et al. (2015) or the range presented above. A possible explanation for this discrepancy is an overestimation of the compressive strength caused by uncertainties in the MUPUS deployment, especially as the placement of the hammer could not be confirmed independently by camera images.
The results of the scratch mark analysis are also inconsistent with a solidified surface ice layer with a thickness between 10 and 50 cm as proposed by Knapmeyer et al. (2018). It is also questionable if such an ice layer is consistent with the fact that the ROMAP plasma sensor was covered by dust during second touchdown (Heinisch et al. 2017a). This requires a relatively soft upper layer, as the ROMAP instrument was not damaged, but capable of breaking up the upper surface. As the results of Knapmeyer et al. (2018) rely on the correct deployment of the MUPUS hammer, uncertainties in the MUPUS operation might have caused an overprediction of the thickness of a possible surface ice layer.
Several laboratory experiments have been performed to determine the mechanical properties of possible building blocks of comets. In particular, Güttler et al. (2009), Schräpler et al. (2015), Lorek et al. (2016), and Katsuragi & Blum (2017) investigated how the compressibility of ice layers and different dust structures created by random ballistic deposition as well as pebble sub-structures (with scales of centimeters, millimeters, and 0.1 mm) depend on the volume filling factor. The respective results are summarized in Fig. 6. Remote observations lead to multiple independent estimates for the volume filling factor. Kofman et al. (2015) derived values of 0.15–0.25, Pätzold et al. (2016) estimated 0.25–0.30, and a study by Fulle et al. (2016) resulted in 0.21–0.37. The corresponding range is depicted in Fig. 6 by the horizontal bar shaded in blue. As thevolume filling factor is known, the laboratory measurements can be used to determine the most likely material of the surface. For the observed volume filling factor, dust and ice layers have a compressive strength above 103 Pa. A surface made up of such dust or ice layers is therefore inconsistent with the results of Groussin et al. (2015) or the compressive strength derived as part of this work. In contrast, a surface consisting of layers of dust and ice aggregates could explain all observations, except for the MPa range derived by Spohn et al. (2015). This is strong evidence for the presence of aggregate layers on the surface of 67P, that is, a surface composed of sub-decimeter-sized aggregates, as inferred from the gravitational collapse scenario. This conclusion can be drawn without precise knowledge of the actual value of the compressive strength, as the upper limit derived as part of this work and by Groussin et al. (2015), even considering all possible errors, is well below 103 Pa for different parts of 67P. The presence of such aggregate layers can only be explained by a formation dominated by relatively low-velocity collisions. Hierarchical agglomeration would cause a significantly higher compressive strength as a result of impact-compaction of the pebbles and possible break-up of aggregates (Blum 2018). The derived mechanical properties combined with the available laboratory models therefore suggest that the gentle collapse of aggregate ensembles played a major role in the formation ofcomets like 67P.
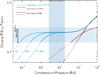 |
Fig. 6 Dependence between volume filling factor and compressive pressure for dust aggregate, dust, and water-ice layers measured inthe laboratory (SC15: Schräpler et al. 2015; GU09: Güttler et al. 2009; LO16: Lorek et al. 2016). The experimental results for dust and ice layers have been extrapolated for lower volume filling factors (dashed lines). The derived compression range for the surface contacts of Philae are depicted by the vertical blue area. Measurements from Kofman et al. (2015; K), Pätzold et al. (2016; F), and Fulle et al. (2016; P) have been used to determine the possible range for the volume filling factor. |
Acknowledgements
Rosetta is an ESA mission with contributions from its member states and NASA. We are indebted to the whole Rosetta Mission Team, LCC, SONC, SGS and RMOC for their outstanding efforts making this mission possible. The contributions of the ROMAP and RPC-MAG teams were financially supported by the German Ministerium für Wirtschaft und Energie and the Deutsches Zentrum für Luft- und Raumfahrt (DLR) under contract 50QP1401. Jürgen Blum acknowledges funding through DFG project BL298/24-1 and DLR project 50WM1536. The SPICE kernels used for this work are available as ROS-E/M/A/C-SPICE-6-V1.0 through PSA and PDS. We thank the anonymous referee for a very constructive review.
References
- Acton, C. H. 1996, Planet. Space Sci., 44, 65 [NASA ADS] [CrossRef] [Google Scholar]
- Akono, A.-T., & Ulm, F.-J. 2011, Eng. Fract. Mech., 78, 334 [CrossRef] [Google Scholar]
- Auster, H.-U., Apathy, I., Berghofer, G., et al. 2007, Space Sci. Rev., 128, 221 [NASA ADS] [CrossRef] [Google Scholar]
- Auster, H.-U., Apathy, I., Berghofer, G., et al. 2015, Science, 349, aaa5102 [NASA ADS] [CrossRef] [Google Scholar]
- Bibring, J.-P., Langevin, Y., Carter, J., et al. 2015, Science, 349, aab0671 [CrossRef] [Google Scholar]
- Biele, J., Ulamec, S., Richter, L., et al. 2009, Acta Astron., 65, 1168 [NASA ADS] [CrossRef] [Google Scholar]
- Biele, J., Ulamec, S., Maibaum, M., et al. 2015, Science, 349, aaa9816 [NASA ADS] [CrossRef] [Google Scholar]
- Blum, J. 2018, Space Sci. Rev., 214, 52 [NASA ADS] [CrossRef] [Google Scholar]
- Blum, J., Gundlach, B., Mühle, S., & Trigo-Rodriguez, J. 2014, Icarus, 235, 156 [NASA ADS] [CrossRef] [Google Scholar]
- Blum, J., Gundlach, B., Krause, M., et al. 2017, MNRAS, 469, S755 [CrossRef] [Google Scholar]
- Cole, D. M., & Peters, J. F. 2007, Granul. Matter, 9, 309 [CrossRef] [Google Scholar]
- Davidsson, B., Sierks, H., Güttler, C., et al. 2016, A&A, 592, A63 [NASA ADS] [CrossRef] [EDP Sciences] [Google Scholar]
- El-Maarry, M. R., Thomas, N., Giacomini, L., et al. 2015, A&A, 583, A26 [NASA ADS] [CrossRef] [EDP Sciences] [Google Scholar]
- Fulle, M., Della Corte, V., Rotundi, A., et al. 2016, MNRAS, 462, S132 [CrossRef] [Google Scholar]
- Glassmeier, K.-H., Boehnhardt, H., Koschny, D., Kührt, E., & Richter, I. 2007a, Space Sci. Rev., 128, 1 [NASA ADS] [CrossRef] [Google Scholar]
- Glassmeier, K.-H., Richter, I., Diedrich, A., et al. 2007b, Space Sci. Rev., 128, 649 [NASA ADS] [CrossRef] [Google Scholar]
- Groussin, O., Jorda, L., Auger, A.-T., et al. 2015, A&A, 583, A32 [NASA ADS] [CrossRef] [EDP Sciences] [Google Scholar]
- Güttler, C., Krause, M., Geretshauser, R. J., Speith, R., & Blum, J. 2009, ApJ, 701, 130 [NASA ADS] [CrossRef] [Google Scholar]
- Heinisch, P., Auster, H.-U., Richter, I., et al. 2016, Acta Astron., 125, 174 [CrossRef] [Google Scholar]
- Heinisch, P., Auster, H.-U., Plettemeier, D., et al. 2017a, Acta Astron., 140, 509 [NASA ADS] [CrossRef] [Google Scholar]
- Heinisch, P., Auster, H.-U., Richter, I., et al. 2017b, MNRAS, 469, S68 [CrossRef] [Google Scholar]
- Johansen, A., Oishi, J. S., Low, M.-M. M., et al. 2007, Nature, 448, 1022 EP [NASA ADS] [CrossRef] [Google Scholar]
- Katsuragi, H., & Blum, J. 2017, ApJ, 851, 23 [NASA ADS] [CrossRef] [Google Scholar]
- Keller, H. U., Mottola, S., Davidsson, B., et al. 2015, A&A, 583, A34 [NASA ADS] [CrossRef] [EDP Sciences] [Google Scholar]
- Knapmeyer, M., Fischer, H.-H., Knollenberg, J., et al. 2018, Icarus, 310, 165 [NASA ADS] [CrossRef] [Google Scholar]
- Kofman, W., Herique, A., Barbin, Y., et al. 2015, Science, 349, aab0639 [Google Scholar]
- Li, L.-Y., Wu, C.-Y., & Thornton, C. 2001, J. Mech. Eng. Sci., 216, 421 [Google Scholar]
- Lorek, S., Gundlach, B., Lacerda, P., & Blum, J. 2016, A&A, 587, A128 [NASA ADS] [CrossRef] [EDP Sciences] [Google Scholar]
- Morbidelli, A.,& Rickman, H. 2015, A&A, 583, A43 [NASA ADS] [CrossRef] [EDP Sciences] [Google Scholar]
- Pätzold, M., Andert, T., Hahn, M., et al. 2016, Nature, 530, 63 [NASA ADS] [CrossRef] [Google Scholar]
- Poulet, F., Lucchetti, A., Bibring, J.-P., et al. 2016, MNRAS, 462, S23 [CrossRef] [Google Scholar]
- Preusker, F., Scholten, F., Matz, K.-D., et al. 2017, A&A, 607, L1 [NASA ADS] [CrossRef] [EDP Sciences] [Google Scholar]
- Richter, I., Auster, H.-U., Berghofer, G., et al. 2016, Ann. Geophys., 34, 609 [NASA ADS] [CrossRef] [Google Scholar]
- Roll, R., & Witte, L. 2016, Planet. Space Sci., 125, 12 [NASA ADS] [CrossRef] [Google Scholar]
- Roll, R., Witte, L., & Arnold, W. 2016, Icarus, 280, 359 [NASA ADS] [CrossRef] [Google Scholar]
- Schröder, S., Mottola, S., Arnold, G., et al. 2017, Icarus, 285, 263 [NASA ADS] [CrossRef] [Google Scholar]
- Schräpler, R., Blum, J., von Borstel, I., & Güttler, C. 2015, Icarus, 257, 33 [NASA ADS] [CrossRef] [Google Scholar]
- Spohn, T., Knollenberg, J., Ball, A. J., et al. 2015, Science, 349, aab0464 [NASA ADS] [CrossRef] [Google Scholar]
- Thomas, N., Davidsson, B., El-Maarry, M. R., et al. 2015, A&A, 583, A17 [NASA ADS] [CrossRef] [EDP Sciences] [Google Scholar]
- Wahlberg Jansson, K., & Johansen, A. 2014, A&A, 570, A47 [NASA ADS] [CrossRef] [EDP Sciences] [Google Scholar]
- Wahlberg Jansson, K., Johansen, A., Bukhari, M., & Blum, J. 2017, ApJ, 835, 109 [NASA ADS] [CrossRef] [Google Scholar]
- Weidenschilling, S. 1997, Icarus, 127, 290 [NASA ADS] [CrossRef] [Google Scholar]
- Yigit, A. S., Christoforou, A. P., & Majeed, M. A. 2011, Nonlinear Dyn., 66, 509 [CrossRef] [Google Scholar]
All Tables
Summary of the underlying values and results for the collision and second touchdown.
All Figures
|
Fig. 1 Overview of the four contact sites on the upper lobe of comet 67P. All contacts took place during Philae’s descent on November 12, 2014. The zoomed-in inlays show the differences in morphology between the four contacts. The possible areas of contact are circled in white. The flight direction is illustrated by the red arcs. |
| In the text | |
|
Fig. 2 Panela: possible area for the collision event overlaid on the digital terrain model (SHAP7) and the estimated trajectory (constrained by red lines, direction indicated by white arrow) from first touchdown, including the position of Philae in flight as seen in OSIRIS camera images. Panel b: possible area for second touchdown overlaid on an OSIRIS image. The incoming flight direction is indicated by a red arrow. Philae is visible to the right at its final locations (circled). |
| In the text | |
|
Fig. 3 Histogram of the incoming and outgoing total velocities for the collision (panel a) and second touchdown (panel b) calculated based on each possible trajectory using a spatial resolution of 1 m. Panels c and d: difference in energy before and after collision and second touchdown, respectively, which is equal to the work done during theses contacts. |
| In the text | |
|
Fig. 4 Illustration of one of Philae’s feet based on a rendering of the 3D lander CAD model. The approximate dimensions of the soles and the upper feet structure are given in red. |
| In the text | |
|
Fig. 5 OSIRIS camera image of the Philae lander at the final Abydos landing site. The right panel is annotated to show the scratch marks “A”, “B” and “C”, the approximated incoming flight direction is depicted by a white arrow. The image resolution is approximately 7 mm px−1. |
| In the text | |
|
Fig. 6 Dependence between volume filling factor and compressive pressure for dust aggregate, dust, and water-ice layers measured inthe laboratory (SC15: Schräpler et al. 2015; GU09: Güttler et al. 2009; LO16: Lorek et al. 2016). The experimental results for dust and ice layers have been extrapolated for lower volume filling factors (dashed lines). The derived compression range for the surface contacts of Philae are depicted by the vertical blue area. Measurements from Kofman et al. (2015; K), Pätzold et al. (2016; F), and Fulle et al. (2016; P) have been used to determine the possible range for the volume filling factor. |
| In the text | |
Current usage metrics show cumulative count of Article Views (full-text article views including HTML views, PDF and ePub downloads, according to the available data) and Abstracts Views on Vision4Press platform.
Data correspond to usage on the plateform after 2015. The current usage metrics is available 48-96 hours after online publication and is updated daily on week days.
Initial download of the metrics may take a while.