Fig. 6
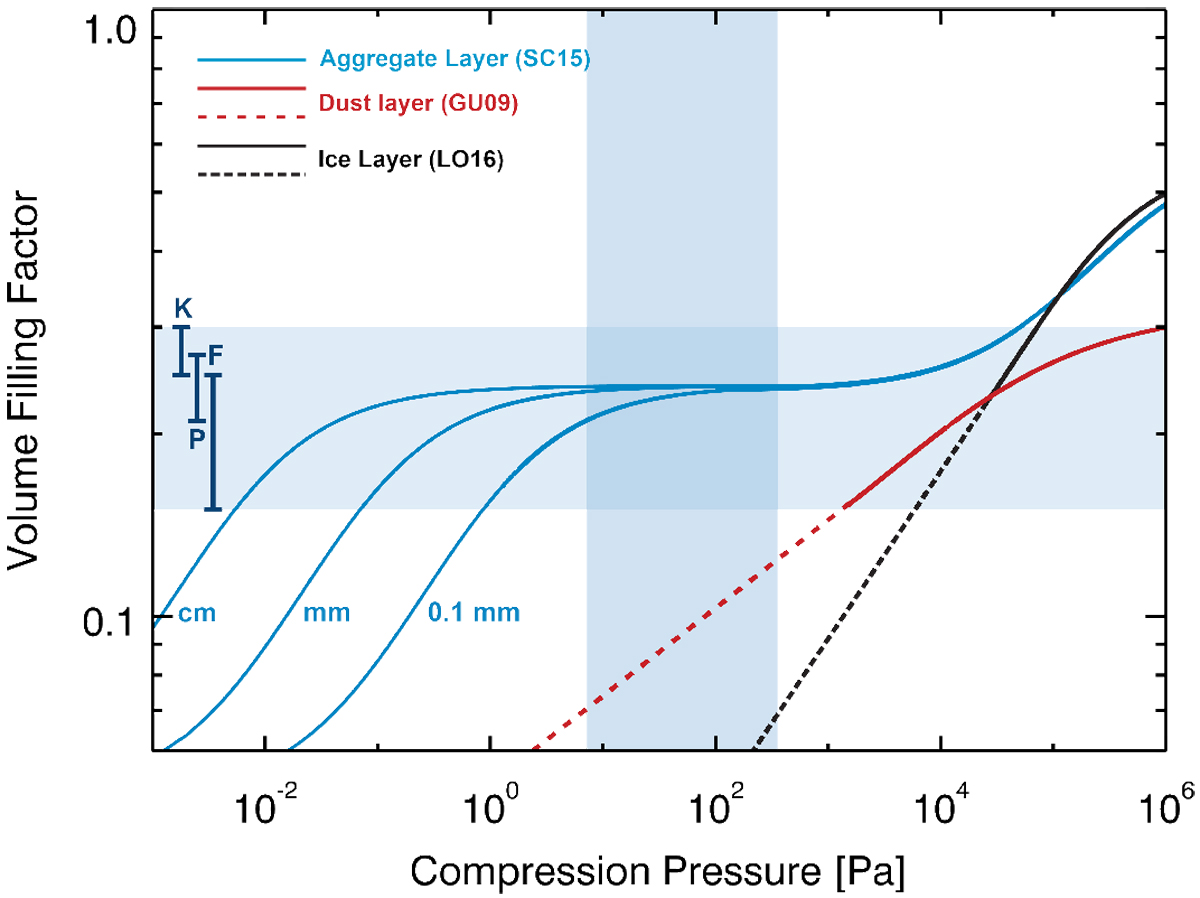
Dependence between volume filling factor and compressive pressure for dust aggregate, dust, and water-ice layers measured inthe laboratory (SC15: Schräpler et al. 2015; GU09: Güttler et al. 2009; LO16: Lorek et al. 2016). The experimental results for dust and ice layers have been extrapolated for lower volume filling factors (dashed lines). The derived compression range for the surface contacts of Philae are depicted by the vertical blue area. Measurements from Kofman et al. (2015; K), Pätzold et al. (2016; F), and Fulle et al. (2016; P) have been used to determine the possible range for the volume filling factor.
Current usage metrics show cumulative count of Article Views (full-text article views including HTML views, PDF and ePub downloads, according to the available data) and Abstracts Views on Vision4Press platform.
Data correspond to usage on the plateform after 2015. The current usage metrics is available 48-96 hours after online publication and is updated daily on week days.
Initial download of the metrics may take a while.