Fig. 3
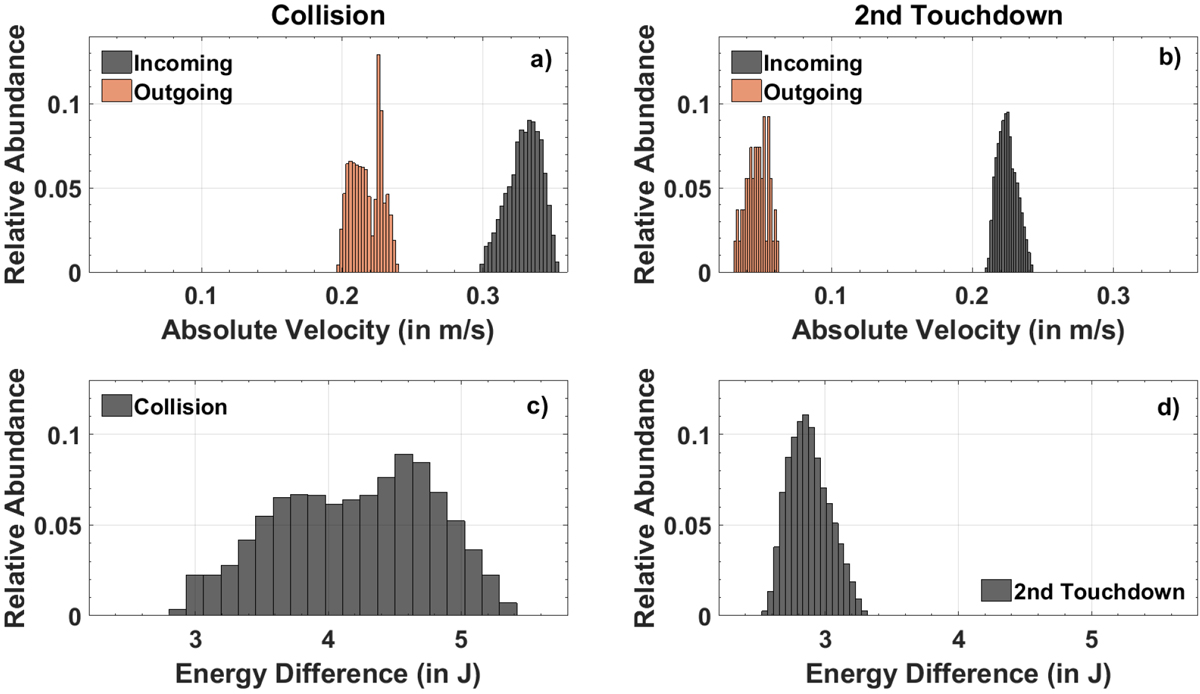
Histogram of the incoming and outgoing total velocities for the collision (panel a) and second touchdown (panel b) calculated based on each possible trajectory using a spatial resolution of 1 m. Panels c and d: difference in energy before and after collision and second touchdown, respectively, which is equal to the work done during theses contacts.
Current usage metrics show cumulative count of Article Views (full-text article views including HTML views, PDF and ePub downloads, according to the available data) and Abstracts Views on Vision4Press platform.
Data correspond to usage on the plateform after 2015. The current usage metrics is available 48-96 hours after online publication and is updated daily on week days.
Initial download of the metrics may take a while.