Fig. 2
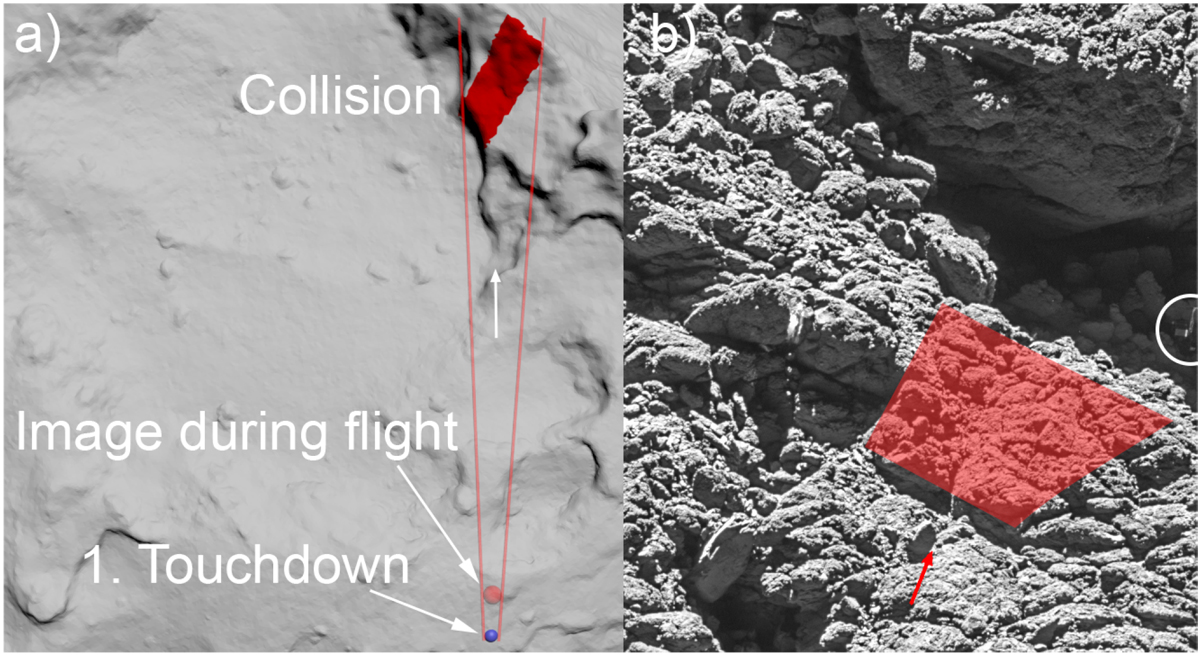
Panela: possible area for the collision event overlaid on the digital terrain model (SHAP7) and the estimated trajectory (constrained by red lines, direction indicated by white arrow) from first touchdown, including the position of Philae in flight as seen in OSIRIS camera images. Panel b: possible area for second touchdown overlaid on an OSIRIS image. The incoming flight direction is indicated by a red arrow. Philae is visible to the right at its final locations (circled).
Current usage metrics show cumulative count of Article Views (full-text article views including HTML views, PDF and ePub downloads, according to the available data) and Abstracts Views on Vision4Press platform.
Data correspond to usage on the plateform after 2015. The current usage metrics is available 48-96 hours after online publication and is updated daily on week days.
Initial download of the metrics may take a while.