| Issue |
A&A
Volume 628, August 2019
|
|
|---|---|---|
| Article Number | A44 | |
| Number of page(s) | 15 | |
| Section | Interstellar and circumstellar matter | |
| DOI | https://doi.org/10.1051/0004-6361/201935484 | |
| Published online | 06 August 2019 | |
Runaways and shells around the CMa OB1 association
1
Institut d’Astrophysique de Paris,
75014
Paris,
France
2
Universidade de São Paulo, IAG, Departamento de Astronomia,
São Paulo
05508-090,
Brazil
e-mail: This email address is being protected from spambots. You need JavaScript enabled to view it.
Received:
18
March
2019
Accepted:
18
May
2019
Abstract
Context. The origin of the arc-shaped Sh 2-296 nebula is still unclear. Mainly due to its morphology, the nebula has been suggested to be a 0.5 Myr old supernova remnant (SNR) that could be inducing star formation in the CMa OB1 association. This means that the region might be an excellent laboratory for investigating the influence of massive stars on their surroundings.
Aims. We aim to show for the first time that the nebula is part of a large shell-like structure, which we have designated the “CMa shell”, enclosing a bubble created by successive supernova (SN) explosions. We identify three runaway stars, associated with bow-shock structures, in the direction of the CMa shell, and we investigate the possibility that they have originated in the center of the shell.
Methods. By analyzing images of the CMa OB1 association at several wavelengths, we clearly saw that the Sh 2-296 nebula is in fact part of a large structure that can be approximated by a large elliptical shell (with a diameter of ~60 pc). Using the recent Gaia DR2 astrometric data, we traced back the path of the three runaway stars, in order to determine their original position in the past, with relation to the CMa shell. We also revised the heating and ionization of the Sh 2-296 nebula by comparing the photon budget provided by the O stars in the region with results from radio observations.
Results. We find that the runaway stars have likely been ejected from a Trapezium-like progenitor cluster on three successive SN explosions that occurred ~6, ~2 and ~1 Myr ago. We also show that the few late-type O stars in the region cannot explain the ionization of the Sh 2-296 nebula, and that other mechanisms need to be at work.
Conclusions. We argue that although we now have evidence for several SNe events in the CMa OB1 association, the SNe probably played a minor role in triggering star formation in these clouds. In contrast, the CMa OB1 association as it is now likely testifies to the last stages of a star-forming region.
Key words: ISM: supernova remnants / ISM: bubbles / ISM: kinematics and dynamics
© ESO 2019
1 Introduction
The stellar association CMa OB1 is composed of over 200 B stars and a few late-type O stars, located at a distance d ~1 kpc from the Sun (Gregorio-Hetem 2008). Its most prominent feature is the extended arc-shaped Sh 2-296 (“Seagull”) nebula, part of the CMa R1 reflection nebulae association, known to be physically related to CMa OB1. It has long been suggested that the nebula is the remnant of an old supernova (SN) that could have triggered the formation of new stars in the region. Our current knowledge of the young stellar population in CMa OB1 indicates a complex star formation history, owing to the presence of young objects that originated in different star-formation events, with a low fraction of circumstellar disks, and a widespread evolved young stellar population of unknown origin. It is therefore a prime laboratory for investigating the influence of massive stars on their surroundings, in the past as well as at present.
Herbst & Assousa (1977) described CMa R1 as a partial emission ring with most association members embedded in an arc-shaped complex of dust clouds that seems to be bound by ionized gas at its inner edge. These authors proposed a scenario in which the star formation in the region would have been induced by a SN explosion about 0.5 Myr ago. They obtained this estimate by assuming that the arc is part of a SN remnant (SNR) in the late “snowplow” phase and expanding in a uniform medium (Chevalier 1974). Later studies offered alternative origins for the nebula, such as the effects of strong stellar winds or an expanding old “fossil” HII region (Reynolds & Ogden 1978). However, the main arguments in favor of a SNR still remain, including the large arc-shaped shell of emission observed in optical images, the near absence of obvious exciting stars, and also the presence of a runaway late O star (HD 54662), which is assumed to have been ejected from a close massive binary system after the explosion of its companion.
Reynolds & Ogden (1978) and Comerón et al. (1998) also noted that the shell-like structure is slowly expanding (with velocities of 13 km s−1 or ≃20−30 km s−1, respectively). However, Comerón et al. (1998) argued that even if a SN explosion took place in CMa OB1, there is strong evidence that star formation was already occurring in pre-existing molecular clouds. Shevchenko et al. (1999) studied the stellar content of Sh 2-296 and found that most stars were much older (5–10 Myr) than the hypothetical time elapsed since the SN explosion, which therefore could not possibly have triggered the formation of these stars.
On the other hand, several sites of recent star formation are found in the nebula, such as the NGC 2327 and BRC 27 clusters, with ages of ~1.5 Myr (Soares & Bica 2002). The wide-field but partial (≃2° × 1°) ROSAT survey of the region by Gregorio-Hetem et al. (2009) identified one hundred stellar X-ray sources, particularly in two young star aggregates around the stars Z CMa and GU CMa, the latter previously unknown and located ~ 30′ away from the Z CMa cluster. Here, the IR characterization of the X-ray sources shows the coexistence of two groups of stars with different ages. Older (ages >10 Myr) and younger (ages <5 Myr) objects are found in both clusters, and the authors proposed a possible mixing of populations in the intercluster region between these two groups of young stars.
As a follow-up of the ROSAT observations, Santos-Silva et al. (2018) studied a sample of 387 X-ray sources detected with XMM-Newton. They found an even larger spread in ages and suggested that two episodes of star formation occurred in Sh 2-296. The first episode was slow and would have been completed over 10 Myr ago. A faster second episode is evidenced by the presence of a large number of objects younger than 5 Myr and disk-bearing T Tauri stars (TTSs) near the edge of the cloud (Fernandes et al. 2015), but these authors found a low fraction of disks among the young stars in Sh 2-296 when compared to star-forming regions of similar ages. Therefore, the spatial segregation of disk-bearing stars at the edge of the nebula suggests that the nebula itself might be responsible for the early disappearance of disks, which might be the result of the mechanical (aerodynamic) dissipation of disks due topast stellar winds or the passage of a shock wave from a SN explosion, or to some other SNR-related process.
Here, we revisit these results in a broader context, in particular, by presenting new evidence showing that Sh 2-296 is an ionized region associated with multiple nested SNRs and part of a closed shell-like structure having an age ~ 6 Myr, as indicated by the expanding proper motions of three runaway massive stars that we find to be associated with the shell. We also discuss several consequences.
The paper is organized as follows. In Sect. 2 we discuss the evidence for a large shell in CMa, and trace back the position of three runaway stars as clues to past supernova explosions spanning several million years. In Sect. 3 the heating and ionization of the Sh 2-296 nebula are revisited, with the conclusion that contrary to previous claims, its ionization can be explained only partially by the well-known existing O stars. In Sect. 4 we place the results in a broader context by discussing the plausibility of the hypothesis that supernovae have triggered several episodes of star formation in the region. In this discussion, we stress that the CMa bubble is interesting. This bubble seems to be rather unique when compared to other known galactic SNR in contact with molecular clouds. A general summary and final conclusions are presented in Sect. 5.
2 Runaway stars and evidence for a large shell
In the wide-field (9° × 9°) DSS RGB image of CMa OB1 shown in Fig. 1 it becomes apparent that the Sh 2-296 nebula is in fact part of a large structure extending far to the east and south, which can be approximated by a closed, roughly elliptical shell (the “CMa shell”, hereafter). This shell may be associated with distinct features: in Fig. 1 the shape of the shell is delineated by the optical emission of the nebula and the molecular clouds distributed in its neighborhood, as recently observed in 13CO emission with the Osaka 1.85 m mm-submm Telescope1. Other structures are also visible in multiple wavelengths, as we show in Appendix A.1, and the SE parts of the shell are detected in the 13 cm radio range (see Fig. 7).
By visual inspection, we fit these features by an ellipse (the yellow dashed ellipse shown in Fig. 1 with a centroid at RA (2000) = 07h 08m 36.82s, Dec (2000) = −12°17′41.26″, semi-major and semi-minor axes a = 1.83° and b = 1.26°, which correspond to ~ 32 pc and ~ 22 pc, respectively, at the adopted distance for the nebula d = 1 kpc. Based on this approximation, the CMa-shell encloses a roughly ellipsoidal volume that reaches ~60 pc.
Three stars associated with bow-shock structures are found in the direction of the CMa shell. Bow shocks can often be the result of the interaction of the winds of massive runaway stars with their local interstellar medium. Two scenarios can explain the high space velocities of runaway stars: the dynamical ejection of the star from a dense cluster (Poveda et al. 1967) or the supernova explosion of a close, more massive, binary companion (Blaauw 1961).
The parallaxes of these stars all agree with the adopted distance of CMa OB1 (d ~ 1 kpc) within 1σ, they appear to be moving away from its center, and are now located inside or even beyond the shell. In the absence of such a dense massive star cluster inside the CMa shell, the most likely scenario to explain the presence of runaways is the SN binary disruption.
The first runaway has been known for some time: it is the fast-moving HD 54662, an O7V star identified by Herbst & Assousa (1977) as a confirmed member of the association (see Fig. 1). The authors noted that the radial velocity of the star differs from the mean value for the association by ~30 km s−1 and proposed that its peculiar velocity could be the result of an ejection resulting from a SN explosion in a binary system at approximately 0.5 Myr ago. As noted by Fierro-Santillián et al. (2018), this is a peculiar object that has been treated as a binary by some authors (Fullerton 1990; Sana et al. 2014; Mossoux et al. 2018) and as a single star by others (Markova et al. 2004; Krticka & Kubát 2010). Fierro-Santillián et al. (2018) find no binarity evidence in the spectra of the star. Here, we also treat it at first as a single runaway star, but discuss the implication of its possible binarity on the ionization of the Sh 2-296 nebula in Sect. 3.
A second high-velocity star is also found further north of the nebula (see Fig. 1), HD 57682. This is a fast proper-motion O9.2IV star (Sota et al. 2014) that has previously been suggested by Comerón et al. (1998) to be a runaway star that might be related to a violent formation of the CMa OB1 complex.
These two runaway stars have created bow shocks, seen in the mid-IR range by the WISE survey (Wright et al. 2010) observations, as a result of their supersonic motion in the ambient interstellar medium (ISM), with a velocity oriented along the vertex of the bow shape (see Figs. 2 and 3).
We found a third star associated with a bow-shaped structure located near the inner edge of the CMa shell, HD 53974. The bow shock was detected in WISE catalog images (see Peri et al. 2015), and is also clearly visible in Hα, in front of the star trajectory (see Fig. 4), which moves toward Sh 2-296. Both HD 53974 and HD 54662 are listed in the bow-shock catalog of Kobulnicky et al. (2016) as isolated bow shocks, which the authors associate with genuine runaway stars. The Herbig Ae/Be star HD 53367 (exciting the IC 2177 HII region, part of CMa OB1) also appearsin this catalog, but it is classified by the authors as an in situ bow shock and not associated with a runaway.
In Table 1 we list the relevant data for HD 53974, HD 54662, and HD 57682 obtained from the literature. We adopted the recent Gaia DR2 proper motions (Gaia Collaboration 2018) for the stars HD 54662 and HD 57682, while for HD 53974, only the less accurate proper motions from HIPPARCOS (van Leeuwen 2007) are available.
To obtain the peculiar velocities of the stars, which indicate their motion with respect to their ambient ISM, we corrected the observed heliocentric velocities for solar motion and galactic rotation (see, e.g., Scheffler et al. 1988; Moffat et al. 1998; Comerón & Pasquali 2007). For the calculations we assumed a flat rotation curve with the solar galactocentric radius R0 = 8 kpc, and velocity V0 = 230 km s−1, and the basic solar motion (U⊙, V⊙, W⊙) = (11.1, 12.24, 7.25) km s−1, as given by Schönrich et al. (2010). We find the peculiar proper motions and velocities listed in Table 2. The orientation (angle θ) is given with respect to the galactic north (counted counterclockwise). In the equatorial coordinates system, as shown in Figs. 2–4, the vector orientation is θ − 23.5°, counted from north to east. Detailed calculations are presented in Appendix B. For the error estimate presented inTable 2, only the errors of the proper motion and the radial velocity measurements were considered. We have checked that large errors on proper motion affect the results more than distance uncertainties. By adopting the parallax error bars measured by Gaia DR2 for HD 54662 and HD 57682, the deviation on θ would be 23°, and 2.2°, respectively.
In the particular case of HD 53974, for which we only have HIPPARCOS data, the direction of the derived peculiar proper motion is not well aligned with the observed vertex of its corresponding bow shock, as illustrated in Fig. 4. Taking into account that the angular uncertainties on the proper motions alone can be very large, as is the case, for instance, for the fast runaway BD+43°3654 studied by Comerón & Pasquali (2007) in the Cyg OB2 association, we chose to make use of the additional information provided by the bow-shock morphology to better constrain the direction of motion. Following the methodology described by Sexton et al. (2015), we defined the vector orientation of the motion for HD 53974 by drawing a straight line from the location of the star to the point of brightest 22 μm emission, taken to be the apex of the bow shock (the same situation holds for the other two runaways). Adopting the same reference as we used for the proper motion vector, the angle θbow-shock (given in Table 2) is the orientation of the bow-shock axis, with respect to galactic north (counted counterclockwise).
Tracing back the positions of the three runaways, as shown in Fig. 5, we find that all three stars would have been nearly at the same location, with their trajectories mutually crossing (near the center of the shell, close to the current positions of HD 543612 and of the LBN1038 nebula) ~1 Myr ago for HD 57682, ~2 Myr ago for HD 53974 (within the large HIPPARCOS velocity vector errors), and ~6 Myr ago for HD 54662. In turn, this finding strongly suggests that the three runaways originally belonged to a compact cluster of massive O stars inside the shell.
Going one step further, we propose a scenario in which three successive SN explosions, having taken place ~1 to ~4 Myr apart, would have disrupted three distinct O-star binary systems belonging to an Orion-like hierarchical cluster. For comparison, it is well known that three runaway stars (μ Col, AE Aur, and 53 Ari), which have similar spectral types (O9.5V, O9.5V, and B1.5V, respectively; compare with CMa, Table 1), and possibly others, likely have a common origin in the Trapezium cluster (Poveda et al. 2005). It is also worth adding that Barnard’s Loop, which is seen as a faint Hα half-circular feature, centered on the Orion Trapezium, has also been interpreted as nested remnants of several SN explosions (see Sect. 4.2). The scenario we suggest is therefore not unique and is in fact quite plausible.
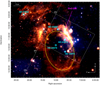 |
Fig. 1 RGB-color DSS image of the region containing the CMa OB1 region and enlarged view of the Sh 2-296 nebula, extracted from the Progressive Sky (HiPS; Fernique et al. 2015) tool from the Aladin Sky Atlas (Bonnarel et al. 2000). The approximate position of three runaway stars (see Sect. 2) and of the other O star members of the association (HD 53975 and HD 54879) are marked and labeled (the italics identify the runaways). The white thin lines trace the 13CO emission obtained with the Osaka 1.85 m mm-submm telescope. This emission is tightly correlated with thedust emission seen by the Planck satellite (LFI instrument; see Fig. A.1, which covers a larger area than this DSS image), so we expect no CO emission outside of the Osaka survey area (dashed box). We also show the coordinates on the galactic plane at b = 0°. The ellipse in yellow marks the approximate shape of the CMa shell, centered at α = 07 08 36.824, δ = −12 17 41.26, with a semi-major axis of ~32 pc at theadopted distance for the nebula of 1 kpc. The faint features visible at the bottom and at the top of the figure (around HD 57682) are also visible in Hα images and detected in the radio range (see Fig. 9 and the discussion in Sect. 3). |
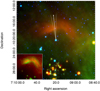 |
Fig. 2 WISE composite-color image of the bow shock associated with HD 54662. Red shows band 4, 22.2 μm. Green showsband 3, 12.1 μm. Blue shows band 1, 3.4 μm (north is up, east to the left). The white vector (not to scale) represents the direction of the proper motion (Gaia Collaboration 2018), corrected for galactic rotation and basic solar motion, and the 1σ errors are represented by dashed lines. A WISE 22 μm image of the bow shock is inset at the bottom left of the figure, overlaid with linearly scaled contours of 22 μm emission. The velocity vector is oriented toward the densest region of the bow shock, not toward its apparent apex. |
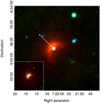 |
Fig. 3 Same as Fig. 2, but for HD 57682. In the inset, the blue vectors indicate the preferential orientation of the bow shock and 1σ errors, as outlined by the contours. The vector lengths are not to scale (north is up, east to the left). |
3 Ionization source of the Seagull nebula
The ionization of the Sh 2-296 nebula and its related components (smaller nebulae, etc.) is clearly observed at many wavelengths. The most detailed information can be extracted from Hα images, and in the radio centimeter range. This information can then be correlated with information about the dense cold material content, such as maps obtained at 21 cm (HI), infrared (dust), and CO (tracing H2).
3.1 Structure and morphology of the ionized gas
Figure 6 shows that the Hα emission is brightest along an approximately linear ridge running NE-SW. A closer look shows that the ridge is structured with locally brighter emission regions, but otherwise has a fairly uniform brightness, until it reaches the small Sh 2-297 nebula in the S. To the N, Fig. 7a shows increasingly extended bright thin filaments, up to ~10 pc long, that appear to be running approximately perpendicular to the ridge, and make up a large-scale diffuse Hα emission component (see also Fig. 6 for more details). The bright nebula IC2177 (Sh 2-292), also called the “Head of the Seagull”, is located to the NW of the ridge.
In Fig. 7a we use the same DSS2-R background image as in Fig. 5, which corresponds to the Hα emission. When the 13CO contours (displayed in Fig. 7b) are superimposed on this optical background, some striking features become apparent. (i) A chain of molecular clouds closely follows the ridge and is dominated by a large elongated cloud that deviates to the W from the ridge toward and including the IC2177 nebula: we refer to it as the west cloud. It has an estimated mass of MW ~ 1.6 × 10⁴ M⊙ (Kim et al. 2004). These molecular clouds are associated with active ongoing star formation and young stars. (ii) To the E of this cloud lies a separate also extended but weaker CO emission that we refer to as the east cloud. Its mass is ME ~ 1.2 × 10⁴ M⊙ (Kim et al. 2004). In contrast to the west cloud, this cloud is not associated with strong Hα emission, but it fills the hole near NGC 2343 very well (visible in the zoom of the nebula, Fig. 6), and even the structure with low surface brightness that extends eastward.
The west and east Clouds are also traced by the visual extinction (AV) map (Fig. 7c) produced by Dobashi (2011) based on data from 2MASS Point Source Catalog (2MASS PSC). The dust closely follows the 13CO distribution, therefore we can infer from the AV contours that the chain of molecular clouds extends to the southeast of the region covered by the 13CO survey, following the approximate shape of the CMa shell. In addition, the dark filaments (seen in Fig. 6) also fit extremely well inside the AV and 13CO contours that we see in Fig. 7. This indicates that the east cloud must be situated in front of the diffuse bright filamentary component. Despite the spatial correspondence, there is no link between this cloud and NGC 2343, which has an estimated age of ~60–100 Myr (Kharchenko et al. 2005). We show below that this cloud plays a crucial role in the interpretation of the ionization structure of the nebula.
As shown in Fig. 7b, the region in between the two CO clouds is also associated with bright Hα emission, but the gas may be too warm there to be visible in 13CO. It could be warmer, less dense HI gas, but the 21 cm data are too coarse to allow a detailed study of the spatial correspondence. Nevertheless, the bright 21 cm emission shown in Appendix A does overlap the intercloud region, which means that material is indeed present despite the absence of 13CO emission.
Another way of studying ionized gas is to look for radio emission, that is, continuum and/or recombination lines. Nakano et al. (1984) have used the Nobeyama 45 m telescope for continuum observations of the nebula at 10.2 GHz (resolution 2.7′). In Fig. 7d we have superimposed the radio contours on the DSS-red image. Given the good spatial resolution, the 10 GHz emission is seen to follow the Hα ridge brightness variations very closely, including the absence of a large-scale gradient along the ridge and part of the diffuse emission at lower levels. In other words, this radio emission is an excellent probe of the ionization front of the nebula and its close vicinity. Other features, such as the IC 2177 and Sh 2-297 nebulae, also have an excellent correspondence in the radio. Quantitatively, Nakano et al. (1984) derived an average electron density for the HII gas ne,i ≃ 10 cm−3, reaching ne,i ~ 50 cm−3 in bright localized sources.
On the other hand, Gaylard & Kemball (1984) have used the Hartebeesthoek 26 m telescope at 13 cm (or 2.3 GHz; HPBW = 20′) to survey a much larger area (~8° × 10°) around the nebula. They also observed the H142α recombination line to extract velocity information. The coarser resolution does not allow a precise matching of morphological details, however. The authors found an average electron density ne,i ≃ 10−20 cm−3, consistent with the result found by Nakano et al. (1984). Coupling their results with other radio results, they were able to find the spectral index, indicating thermal bresstrahlung emission with Te,i = 6900 ± 1300 K. The H142α observations yielded a turbulent velocity vt ~ 10 ± 8 km s−1. This velocity is comparable to the sound velocity cs = (2kTe,i/mp)1/2 ≃ 10 km s−1, which means that there is no evidence for an expansion of the ionized gas.
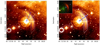 |
Fig. 4 Images of the bow shock associated with HD 53974 from the AAO/UKST SuperCOSMOS Hα survey (Hambly et al. 2001) overlaid with linearly scaled contours of the emission at 22.2 μm that outline the shape of the bow shock. Left: the blue vector represents the direction defined by the HIPPARCOS proper motion corrected for galactic rotation and basic solar motion, within 1σ errors. Right: a WISE color-composite image of the bow shock is inset at the top left corner of the figure. The blue vector indicates the preferential orientation (apex) of the bow shock, which we define by drawing a straight line from the location of the star to the point of highest 22 μm emission. The 1σ uncertainty (thin blue lines) is outlined by the highest level contour from the 22.2 μm emission. The vector lengths are not to scale (north is up, east to the left). |
Data on the runaway stars associated with the CMa shell.
Peculiar proper motions of runaway stars in CMa OB1.
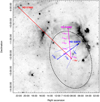 |
Fig. 5 DSS2-R image of the region containing CMa R1 (north is up, east to the left). The ellipse shows the approximate extent of the shell, and the arrows indicate the past positions of the runaway stars going back a few million years (as labeled in the image), according to the derived proper motions of HD 57682 and HD 54662, and the bow-shock orientation of HD 53974. The dashed blue lines represent the 1σ uncertainty on the axis of the bow shock associated with HD 53974, as discussed in the caption of Fig. 4. The stars HD 54662, HD 53974, and HD 57682 would have been at a coinciding position, located close to the center of the CMa shell, ~6, ~2, and ~1 Myr ago, respectively. |
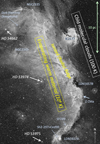 |
Fig. 6 Deep close-up view of the Sh 2-296 nebula in Hα with significant labels added (image courtesy of S. Guisard (sguisard.astrosurf.com) and T. Demange (www.capnature.com)). This view vividly illustrates the ionized evaporation features that flow away from the adjacent molecular clouds: long (up to ~10 pc) filaments, smaller scale eggs and pillars (e.g., near the Herbig Be star Z CMa, or the SFO 29 filament), and bright dense corrugations. Interacting with this flow, the runaway O star HD 53974 has created a conspicuous bow shock (see text, Sect. 2, and Fig. 4). Given the evaporation features, it is plausible that the bubble edge is located behind the Lynds dark nebulae LDN1657A and LDN1657B. |
3.2 Stellar ionization versus Lyman continuum emission
The standard method for explaining the ionization of nebulae such as Sh 2-296 is to establish a census of the ionizing O and B stars present in their vicinity that more or less face the ionization front. The surveys of Claria (1974) and Shevchenko et al. (1999) are complete for stars brighter than V = 9.5 mag within the CMa OB1 association, indicating that there are no other O-type stars than the four that we list in Table 3. The corresponding Lyman continuum flux Q0 (number of ionizing photons per second) depends on the spectra of the hot stars and has been estimated by various authors (e.g., Panagia 1973; Schaerer & de Koter 1997; Martins et al. 2005). Table 3 gives a census of the relevant O and B stars, with revised spectral types and recent estimates of the O-star Lyman continuum fluxes, in particular, taking into account mass loss and line blanketing (Martins et al. 2005). Martins et al. (2005) did not give Q0 for B stars, but the previous study by Schaerer & de Koter (1997) showed that they contribute in a negligible way to the total Lyman continuum flux (<1048 s−1). We also note that two nebulae have B0V stars as their own ionization sources (Sh 2-297, Mallick et al. 2012, and IC 2177), so that we can remove them from the total observed Lyman continuum flux.
Considering only the three late O stars close to Sh 2-296, from Table 3, we see that together, they contribute with Q0 = 1.05 × 1049 s−1. We can compare this value with the estimate from the radio observations of Nakano et al. (1984), who derived a Lyman continuum flux NLyc ≃ 1.3 × 1049 s−1, integrated over the ridge (see Figs. 7a,d), and NLyc ≃ 1.8 × 1049 s−1, in total, integrated over distinct sources such as IC 2177 and Sh 2-297. Gaylard & Kemball (1984) also gave a consistent estimate of the total Lyman continuum flux NLyc = 1.6 (+1.4∕−0.8) × 1049 s−1. However, if HD 54662 is really a (spectroscopic) binary (Sota et al. 2014), the total ionizing flux rises to Q0 = 1.2−1.7 × 1049 s−1. Given this uncertainly, the estimated range of Q0 is strictly speaking indeed compatible with if lower than the values of NLyc deduced from the radio observations of both Nakano et al. (1984) and Gaylard & Kemball (1984).
Nevertheless, the largest contributor of Lyman continuum photons, the runaway HD 54662, deserves further discussion. The line of sight to this star happens to be grazing the east cloud, but no ionization is found in or around the cloud. Because the east and west clouds have the same radial velocities, there is little doubt that they are part of the same complex, associated with CMa OB1, and we would expect both clouds to display comparable ionization features (Hα emission, radio emission, etc.). In reality, however, we see that while the west cloud and its HI extension to the N have a sharp ionization front. The east cloud (and more specifically, its dense dust filaments) simply absorbs the associated background diffuse HI emission coming from the west cloud. In addition, we have already mentioned that there is no evidence for a gradient of ionization along the ridge, in other words, no 1∕r2 distance effect from HD 54662 (or its proposed companion) on the ionization of the west cloud, which would be expected if it were the ionization source. As it turns out, the Gaia DR2 proper motions (Table 2) indicate that the star would now be ~ 200 pc farther away from its original location 6 Myr ago, meaning that the star would currently be isolated in a distant low-density region of the ISM, too far to significantly ionize the east cloud. By the same token, it lies too far away from the west cloud (and its associated intercloud HI component). Therefore, HD 54662 (and/or its possible binary companion) cannot be considered an ionizing source for the nebula. We recall that the other O star HD 57682 is also far from the nebula (Table 3). This means that we are excluding the two runaway O stars from the nebula ionization budget.
As for the other two O stars, in projection (see Fig. 1) and by decreasing order of Lyman continuum flux, HD 53975 lies very close to the small but bright Sh 2-297 nebula and may be its main ionization source, but like HD 54662, on geometrical grounds it does not seem to contribute at the large scale to the ionization of Sh 2-296. On the other hand, HD 54879 is definitely better located (it lies close to the centroid of the apparent arc associated with Sh 2-296), but it is the weakest of the four O stars, with a Lyman continuum flux at least ten times lower than that of HD 54662.
We conclude that contrary to previous claims, the ionization of the Seagull nebula cannot be attributed entirely to the OB stars known in the area, but only to a certain fraction η⋆ of their total Lyman continuum flux. On the basis of the above discussion, we consider that at most two Ostars (HD 53975 and HD 54879) really contribute to this ionization, with a total of NLyc = 4.8 × 1048s−1, that is, ~30% of the measured flux NLyc. In other words, we estimate η⋆ ~ 0.3 or lower. Consequently, another energy source is needed to sustain the remaining (≳ 70%) ionization of the nebula.
Computed Lyman continuum flux of the hot stars of the CMa OB1 association.
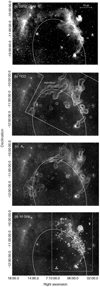 |
Fig. 7 (a) DSS2-R image of the Sh 2-296 nebula (pixel size 1.7 arcsec). The ellipse outlines the proposed shape of the CMa R1 shell. The contours in each panel trace (b) the 13CO emission (courtesy of the Osaka group, see Onishi et al. 2013). The angular resolution (beam size) is 2.7 arcmin in HPBW; (c) the extinction (AV) from the 2MASS maps of Dobashi (2011), resolution of 1 arcmin; (d) the continuum radio emission at 10 GHz extracted from Nakano et al. (1984), beam size (HPBW) of 2.7 arcmin. |
3.3 X-ray heating as an ionization source?
As argued above, the CMa shell we see now is likely associated with nested SNRs (like Barnard’s Loop), which means that it is itself an SNR resulting from three successive explosions a few million years apart. Then, the prime consequence of the existence of an SNR that is a few million years old, which at this age slowly expands in the ambient ISM in the course of a late radiative phase and is visible in the form of a shell, is the X-ray emission from a bubble of cooling plasma that was previously heated by shock waves during the Sedov phase and is now bounded by this shell.
For the CMa shell, a possible scenario would then be as follows. The age τ of the shell would a priori correspond to the time elapsed since the first explosion, that is, the traceback time of the first runaway, HD 54662 (τ = trunaway,1 ~ 6 Myr). However, for the X-ray emission the cooling time τcool of the plasma would have to be at least comparable to the time elapsed since the last explosion, that is, the traceback time of the third fast runaway, HD 57682 (τcool ≳ trunaway,3 ~ 1 Myr). Although each explosion reheats the previous SNRs, the youngest SNR dominates the energetics (as shown by the recent theoretical models by Krause & et al. (2014); Krause et al. (2014) and Yadav & Glatzel (2017); see discussion in Sect. 6.4), thus essentially giving the CMa shell its current shape. This is the main reason why it is reasonable to stop the traceback trajectory of HD 57682 near the center of the shell, that is, at ~1 Myr.
This scenario suggests an alternative (additional) energy source for the Sh 2-296 nebula, in terms of heating by X-rays from a ~1 Myr hot bubble enclosed by the CMa shell, in contact with the nebula. This development is, however, beyond the scope of this paper and will be presented in a forthcoming work where we will use the constraints provided by the stellar runaway timescales and observed bubble parameters to test this hypothesis and compare with X-ray observations.
4 Discussion
4.1 Star formation triggered by SN explosions?
As mentioned above, the young stellar population of the CMa OB1 association contains a few (late) O stars, dozens of B stars, and hundreds of low-mass young star candidates detected by X-ray observations (Gregorio-Hetem et al. 2009; Santos-Silva et al. 2018). Because we argue that the CMa shell is the result of at least three nested SNRs formed between ~1, 2, and ~6 Myr ago, it is worth discussing whether this young star population has any relationship with them.
Recently, Fischer et al. (2016) conducted a search for YSOs in a 100 deg2 area around the CMa OB1 region, using data from the Wide-Field Infrared Survey Explorer (WISE). The authors were able to identify several groups of YSOs that are spatially distributed in a circular area, which approximately coincides with the ring of optical and radio emission reported by Herbst & Assousa (1977), and which are in majority projected onto Sh 2-296. In Fig. 8 we show that the distribution of these groups (see the yellow circles) also coincides with our proposed elliptical shape of the CMa shell. Two groups, in particular, are projected onto the eastern border of the shell where no emission is seen in the images at any wavelength.
Even though the determination of ages in star-forming regions is a complicated matter, several authors have reported an age spread of the young stellar population in CMa R1 (Shevchenko et al. 1999; Gregorio-Hetem et al. 2009; Fischer et al. 2016; Santos-Silva et al. 2018), containing groups of stars as old as ~20 Myr (e.g., Santos-Silva et al. 2018) and as young as ~2 Myr, as can be inferred by the predominance of Class I sources in some the groups identified by Fischer et al. (2016).
In addition to the shell structure and the apparent age mixing, other signatures of triggered star-formation are present in Sh 2-296, such as pillars and bright-rimmed clouds (Rebull et al. 2013), which are clearly visible in the Hα image shown in Fig. 6. If the SN explosions that we inferred from the study of runaway stars occurred between ~1 and 6 Myr ago, they could not be responsible for the formation of the oldest stars in the region, but might have enhanced the most recent star-formation activity. For example, it is possible that the most recent SNR played a role locally in the formation of the youngest clusters of the association, such as the young stars in Sh 2-297 with an estimated age of 1 Myr (Mallick et al. 2012).
Therefore, CMa OB1 appears to be the relic of a spatially extended active star-forming region that has experienced the influence of its former massive star population (in particular at least three SN explosions), but with only a few O stars remaining at the center of the shell, is now in the last stages of star formation activity. The CMa bubble itself could be considered as extinct because it is no longer powered by massive stars, but is quietly cooling by X-ray emission, while a fraction of this emission may go into heating and ionizing the Sh 2-296 nebula.
4.2 Million-years-old supernova remnants in the Galaxy: the CMa shell in context
In the preceding sections, we have presented evidence that a large shell with a diameter of ~60 pc exists. It is therefore useful to place the CMa shell in context, that is, to compare its properties with those of other large shell-like or bubble-like structures known in our Galaxy.
The closest case of a million-years SNR is undoubtedly the SNR surrounding the Sun. There is evidence for a nearby (d ~ 100–200 pc) SN explosion ~2 Myr ago, from excess short-lived radionuclides like 60Fe (half-life ~2.6 Myr) in the Earth’s ocean crust (Fry et al. 2015) and from the anomalous  ratio in cosmic rays (Kachelrieß et al. 2015). This SNR is likely part of a local complex of interlaced bubbles (the so-called Local Bubble, e.g., Lallement et al. 2003), and may be connected with the recently discovered ~2 Myr old Antlia SNR (Tetzlaff et al. 2013, and references therein). We note that the possible tracers of this SN explosion include the pulsar PSR J0630-2834 and, analogous to the CMa shell, a runaway (A-type) star: HIP 47155.
On a galactic scale, 61 HI supershells (D > 100 pc), first discovered by Heiles (1984), are now known (McClure-Griffiths et al. 2002). As shown by McClure-Griffiths and collaborators, some of them are found to lie at very large distances from the Sun (up to ~20 kpc) and may have extremely large sizes (D ~ 700 pc) that were reached in a low-density interstellar medium after several 10 Myr, with expansion energies of ~ 1051−1053 erg3.
Their exact origin is not clear and likely is a combination of many SN explosions and galactic-arm structure. One of them, GSH 138-01-94, has been found to be “the largest and oldest SNR”, with a diameter of D = 360 pc (at a distance d = 16.6 kpc), and an estimated age ~4.3 Myr (Stil & Irwin 2001). By contrast, smaller supershells of the same age do exist closer to the Sun, such as GSH 90-28-17 (D = 132 pc, d = 400 pc, age ~ 4.5 Myr; Xiao & Zhu 2014).
Very large filled structures known as superbubbles are also known, such as the famous X-ray emitting Orion-Eridanus bubble (D = 320 pc for a distance d = 400 pc). This is likely a complex of nested SNRs including Barnard’s Loop, with an estimated age ≃ 8 Myr (Ochsendorf et al. 2015; Pon et al. 2016).
We must therefore add another criterion for comparison with the CMa shell: to be bordered by molecular clouds (at least in part). A first example is the Carina region, in which two colliding supershells have accumulated interstellar material so as to form a giant molecular cloud in between (Dawson et al. 2015). One of the supershells, GSH 287+04-17, is seen in HI; it is located 2.6 ± 0.4 kpc from the Sun, and had a size 150 × 230 pc, which means that it reached high galactic latitudes. The other is associated with the Carina OB2 association; its distance is 2.9 ± 0.9 kpc (i.e., it is compatible with that of the HI supershell), and has a size 80 × 30 pc. Both supershells have estimated input energies E ~ 5 × 1051 ergs, and ages less than ≈ a few Myr. To compare with the CMa situation, we point out that Gregorio-Hetem et al. (2009) analyzed the spatial spread of the stellar population associated with the CMa molecular clouds, finding that young stars (ages <5 Myr) were present at the east and west sides of the clouds (see above, Sect. 1). This result led them to suggest that these stars might have been formed as a result of SN explosions that squeezed the molecular clouds. However, the inspection of SHASSA or DSS R maps do not reveal evidence for a shell on the west side of the CMa molecular clouds, therefore the CMa shell (to the east) appears single compared to the Carina pair of supershells.
Another case is the G349.7+0.2 SNR, discovered in radio continuum with the VLA because of its nonthermal spectrum. According to Reynoso & Mangum (2001), this SNR is in contact with several molecular clouds, as testified by the detection of 1617 MHz OH masers; furthermore, it seems to have triggered star formation in the form of an ultra-compact HII region. It has a diameter D ≃ 100 pc and an age ~4 Myr, which makes it appear more similar to the CMa shell. It lies very far away, however, at d = 23 kpc from the Sun.
Altogether, the CMa shell appears at least observationally as somewhat unique among large galactic SNR that are millions of years old and are in contact with molecular clouds.4 It is quite close to the Sun (d ~ 1 kpc), and in addition, its association with the local stellar population is well studied (see Sect. 4.1).
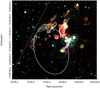 |
Fig. 8 WISE composite-color image of the CMa R1 region. Red shows band 4, 22.2 μm. Green showsband 3, 12.1 μm. Blue shows band 1, 3.4 μm. The yellow circles delimit the area of the YSO groups identified by Fischer et al. (2016). The circles in cyan show the position of XMM-Newton fields observed by Santos-Silva et al. (2018); 387 young stars are found in these fields. The majority have counterparts in the X-ray sources previously detected with ROSAT by Gregorio-Hetem et al. (2009), although they indicate an extended distribution of young stars west of the nebula. The white contours trace the 13CO emission. The dashed thin line shows the galactic longitude at b = 0°, and the white dashed ellipse represents the CMa shell (see Fig. 1). |
4.3 The CMa superbubble
In the large-scale Hα image shown in Appendix A we note a diffuse faint supershell of emission (larger dotted elliptical ring) that has no counterpart at other wavelengths, except perhaps in the radio range (21cm and 408 MHz). These features are brought up in Fig. 9. Beyond the shell we have discussed up to now (and which is then overexposed), there clearly exists a much larger diffuse structure of Hα emission, that is, a supershell of ~140 pc. These features are also apparent in the DSS image shown in Fig. 1.
We have an approximate elliptical fit to the supershell not only in Fig. 9, but also in our multi-wavelength gallery (Fig. A.1): in contrast to the CMa shell, this supershell is not observed, so that the properties of the ISM in which it must be embedded cannot be known.
We are led to suggest that these features must be the dim remnants of SN explosions that occurred before the three that we have associated with the CMa shell, and that the Hα supershell might similarly enclose a hot superbubble. It is interesting to note that the western border of this supershell coincides with the location of the older (10 Myr) group of X-ray sources detected by ROSAT around GU CMa (Gregorio-Hetem et al. 2009).
As discussed in the preceding section, other structures, comparable in size to the CMa shell (although usually larger, with D ~ 100 pc) that are referred to as superbubbles, have been detected in X-rays long ago and thus may be targets to search for their heating effects on the surrounding gas. However, these superbubbles are associated with clusters of O stars, and are pressure driven, that is, they are now expanding under the influence of stellar winds and/or recent SN explosions, in contrast to the CMa bubble. In other words, their X-ray pressure is found to exceed the HII gas pressure by a significant factor, and/or they are characterized by high expansion velocities (vexp ~ several 10 km s−1).
Perhapsthe most famous known concentration of superbubbles lies in the LMC, as shown by observations dating back to the late 1970s, although at the time they were simply called SNRs (e.g., Lasker 1977). Early Einstein observations revealed many previously unknown X-ray emitting superbubbles with diameters of ~ 100 pc or more, and X-ray luminosities LX ~ 1−10 × 1035 erg s−1 (e.g., Chu & Mac Low 1990), which is in the same range as the predicted X-ray luminosity of the CMa shell alone.
Deeper observations of the LMC were obtained with ROSAT and revealed new superbubbles (e.g., Dunne et al. 2001). Their sizes are D ~ 100−200 pc and their expansion velocities vexp ~ 20−70 km s−1. The X-ray spectral fittings reveal soft X-ray emission (kT ~ 0.2−0.9 keV, or T ~ 2−9 MK; nH ~ 0.01−0.1 cm−3), confirming X-ray luminosities LX ~ 1035−36 erg s−1. Based on their sample of 13 superbubbles, Dunne et al. (2001) found a correlation with the richness and age of the exciting OB associations. They interpreted this to mean that the origin of X-rays was stellar winds that are enhanced by SNRs, resulting in pressure-driven superbubbles. The link with the young massive stellar population suggested an age on the order of a few million years.
More detailed observations were obtained by XMM-Newton on the N158 (Sasaki et al. 2011) and N206 (Kavanagh et al. 2012) HII regions. N156 appears as a somewhat extreme superbubble, with a harder spectrum (kT ~ 1 keV) and high pressure (P∕k ~ 106 cm−3 K), and a corresponding high X-ray luminosity (LX = 2.3 × 1038 erg s−1), that is, two orders of magnitude higher than for typical LMC superbubbles. This region is similar to the 30 Dor star-forming region, with a large population of very massive stars. The age estimate is very young (~ 1 Myr), but the high LX implies that two to three supernovae may have already exploded. By comparison, N206 appears more typical but still hot (kT ~ 1 keV), with P∕k ≃ 5 × 105 cm−3 K. The energy content is E ~ 3 × 1051 erg. The stellar population is poorly known, but again, massive stars are likely to explain the formation of the superbubble, with a correspondingly young age.
Of relevance to our work, the conclusion emerging from these studies is that as a rule, superbubbles in the LMC expand and are sustained by winds and SN explosions of massive stars that are currently present in OB associations. As we have argued, this is not the case of the CMa shell, which is not expanding, and contains only a few late-type O stars with weak winds and insufficient UV radiation for ionizing the Sh 2-296 nebula. In this sense, the CMa case may also be unique among superbubbles.
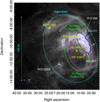 |
Fig. 9 Large-scale Hα environmentof the CMa shell from the SHASSA survey. The faint emission is enhanced down to a surface brightness of ~150 dR. Conspicuous Hα filaments are visible, which are well correlated with the radio map of Gaylard & Kemball (1984) (their Fig. 1), in particular, with features that we outline in green in this figure, called Northern Arc and Southern Loop (which is well correlated with the southern half of the CMa shell). We suggest that this faint Hα emission is associated with a superbubble ~140 pc in diameter (here outlined in the form of the dashed cyan ellipse), analogously to Barnard’s Loop around the Orion nebula. |
5 Summary and concluding remarks
We have found strong evidence in favor of connections between the Sh 2-296 nebula and a complex of nested ~1–6 Myr old SN remnants. First, a large (D ~ 60 pc) shell (the CMa shell) is visible at various wavelengths (optical, HI, CO, etc.) but has apparently escaped detection until now because of its large angular size (over 80 sq. deg.). Second, three runaway stars are found in association with the nebula: using proper motions measured by Gaia and HIPPARCOS and radial velocities, we traced back the position of these stars, and we found that they have likely been ejected from approximately the same location inside the shell in (at least) three successive SN explosions ~6 Myr, 2 Myr, and 1 Myr ago.
On the other hand, after discussing the Lyman continuum flux and the spatial distribution of the O stars in the region, we conclude that they cannot fully account for the ionization the nebula derived from radio and Hα observations. In accordance with our multiple SN explosion scenario, we suggest that the Sh 2-296 nebula may be heated by X-rays from a hot bubble bound by the CMa shell.
The region may have had a more complex history because we also find evidence that the CMa bubble is itself nested in a larger ionized structure that is visible in Hα surveys and bounds a superbubble of ~140 pc. While the three SN successive explosions advocated in this paper may have played a role in inducing recent star formation in CMa at least locally, the older population of low-mass stars (>10 Myr) found by Gregorio-Hetem et al. (2009) and Santos-Silva et al. (2018) cannot be explained by them. However, the membership and age of a significant part of these objects have been confirmed by the parallaxes from Gaia DR2, as discussed in Appendix C, leading us to suggest that they may be causally related to the existence of the Hα supershell as a relic of previous SN explosions. In other words, at least in a global sense, several localized episodes of star formation inthe CMa OB1 association would echo the successive supernova explosions that occurred in the region in the past over several million years. Then, the fact that there are only a few massive stars left (with a lifetime of only several million years) implies that the CMa OB1 association that we are witnessing now is the swan song of the history of a formerly very active ~ 10 Myr old star-forming region.
Acknowledgements
B.F. acknowledges financial support from CNPq (projects: 205243/2014-2/PDE and 150281/2017-0). J.G.H. thanks CAPES/Cofecub (712/2011), CNPq (305590/2014-6), and FAPESP (2014/18100-4). TSS thanks CAPES (Proj: PNPD20132533). We thank T. Onishi (Osaka University) for providing his CO data in advance of publication. T.M. thanks S. Guisard for generously providing the wide-field Hα picture of the Seagull nebula used in this paper. The authors would also like to thank S. Federman, P. Boissé, J.R.D. Lépine and P.A.B. Galli for many productive discussions and feedback on this manuscript. This work has made use of the VizieR, SIMBAD, and Aladin databases operated at CDS, Strasbourg, France. This work has made use of data from the European Space Agency (ESA) mission Gaia (https://www.cosmos.esa.int/gaia), processed by the Gaia Data Processing and Analysis Consortium (DPAC, https://www.cosmos.esa.int/web/ gaia/dpac/consortium). Funding for the DPAC has been provided by national institutions, in particular the institutions participating in the Gaia Multilateral Agreement.
Appendix A Multiwavelength view of the CMa shell
In this appendix, we present a gallery of the CMa R1 region in different wavelengths. For comparison with Fig. 9, the position of the four O-type stars associated with the region is marked by crosses. These images demonstrate, as mentioned in Sect. 2, that Sh 2-296 is part of a large elliptical ring that extends beyond the familiar bright arc-shaped nebula seen in the optical images. This ring, or shell-like structure, is specially clear in the Hα image of theregion that we present here again (see also Fig. 9) for comparison with other wavelengths. These images (Fig. A.1) can help us better constrain the shape of the shell by tracing the eastern and southern parts of the structure. It is interesting to note that no emission at these wavelengths is detected within the region surrounded by the shell, which also seems to be mostly devoid of young stars (see Fig. 8). Even considering the changes in resolution, it can be also noted that the large structure of the shell remains roughly traced. Comparing, for instance, the lower resolution found in the images from Planck LFI and Haslam 408 MHz with the better defined Hα image, we see the same overall distribution traced by the emission at these different wavelengths.
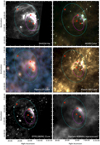 |
Fig. A.1 Images of CMa R1 at different wavelengths obtained with Aladin Progressive Sky (HiPs). The positions of the O stars HD 57682, HD 54662, HD 54879, and HD 53974 are marked as red crosses. The small dotted magenta ellipse represents the CMa shell, and the large dotted cyan ellipse encloses the superbubble suggested by us. From top left to bottom right: Hα image from the SHASSA Survey (see also Fig. 9); Akari (Murakami et al. 2007) color-composition at 140 μm (red), 90 μm (green), and 65 μm (blue); Planck Release 2 (Planck Collaboration I 2016) HFI color-composition at 353 GHz (red), 545 GHz (green), 857 GHz (blue); Planck Release 2 LFI color-composition at 30 GHz (red), 44 GHz (green) and 70 GHz (blue); image from the Effelsberg telescope at 21 cm (Reich et al. 1990); and from the reprocessed Haslam survey at 408 MHz (Remazeilles et al. 2015). Note the correspondence between the Planck LFI emission (cold dust) and the 13CO emission shown in Fig. 1. |
Appendix B Proper motion of runaway stars
To derive the peculiar, or local, proper motion of the stars, that is the proper motion of the star corrected for solar motion and galactic rotation, it is convenient to first convert the observed proper motion components from the equatorial (μα cos δ and μδ) into the galactic (μl cosb and μb) coordinate system. To achieve this, we followed the transformation derived by Poleski (2013), see also Johnson & Soderblom (1987):
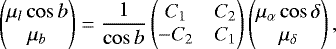 (B.1)
(B.1)
where (l, b) and (α, δ) are the galactic and equatorial coordinates of the star, respectively. The coefficients C1 and C2 are given by
 (B.2)
(B.2)
 (B.3)
(B.3)
and αG = 192°.85948 and δG = 27°.12825 are the equatorial coordinates of the north galactic pole.
In this appendix, we determine the resulting proper motion and velocities of the runaway star HD 53974 as an example. Using Eq. (B.1) with the coefficients given by Eqs. (B.2) and (B.3), we have that the corresponding values of the proper motion of HD 53974, expressed in galactic coordinates, are μl cosb = (−4.37 ± 0.4) mas yr−1 and μb = (−1.26 ± 0.9) mas yr−1.
The proper motion components of the peculiar motion of the star can then be written as the observed proper motion minus the components due to the basic solar motion (  ) and galactic rotation (
  ), as describedin Scheffler et al. (1988) and Moffat et al. (1998).
 (B.4)
(B.4)
 (B.5)
(B.5)
where the terms due to the basic solar motion can be written as
 (B.6)
(B.6)
 (B.7)
(B.7)
where U⊙, V⊙, W⊙, are the components of the solar peculiar motion in the direction toward the galactic center, the direction of the galactic rotation, and the north galactic pole, respectively. For proper motions given in (mas yr−1), K = 4.74047 km yr s−1 is the ratio between the astronomical unit in kilometers and the number of seconds in a year.
We adopt a model where the stars move on the galactic plane in circular orbits with radius R around the galactic center in a flat rotation curve. If Ro is the solar galactocentric distance and r is the distance from the star to the Sun, then the galactocentric radius R of the star can be expressed in terms of r by means of the cosine rule (see Scheffler et al. 1988),
 (B.8)
(B.8)
The angular velocity of the orbital motion is then denoted by
 (B.9)
(B.9)
The proper motion terms due to the galactic rotation are given as
![Mathematical equation: \begin{equation*} {(\mu_b)}_{\textrm{rot}} = -\frac{1}{K}\left[\frac{R_o}{r} (\omega - \omega_{o}) \sin l \sin b \right]\end{equation*}](/articles/aa/full_html/2019/08/aa35484-19/aa35484-19-eq14.png) (B.10)
(B.10)
![Mathematical equation: \begin{equation*} {(\mu_l)}_{\textrm{rot}} = \frac{1}{K} \left[\frac{R_o}{r \cos b} (\omega - \omega_{o}) \cos l - \omega \right] .\end{equation*}](/articles/aa/full_html/2019/08/aa35484-19/aa35484-19-eq15.png) (B.11)
(B.11)
Assuming that HD 53974 is at the same distance as CMa OB1 (r = 1 kpc), we find R = 8.74. Using this value in Eq. (B.9), we have ω = 26.32. We adopt (U⊙, V⊙, W⊙) = (11.1, 12.24, 7.25) km s−1 (Schönrich et al. 2010) and a flat rotation curve with R0 = 8 kpc and V0 = 230 km s−1. From Eqs. (B.10) and (B.11), we obtain  = −2.63 mas yr−1 and
  = 0.09 mas yr−1, and from Eqs. (B.6) and (B.7), we obtain
  = 0.19 mas yr−1 and
  = −1.43 mas yr−1.
The resulting peculiar proper motion components are then
 (B.12)
 mas yr−1
 (B.13)
The position angle θ of the peculiar proper motion with respect to the north galactic pole, counted as positive in the direction of increasing galactic latitude, is
 (B.14)
Correcting the heliocentric radial velocity for basic solar motion and galactic rotation, the components of the peculiar radial velocity of the star can be written as
 (B.15)
where RV isthe heliocentric radial velocity,
 (B.16)
and
 (B.17)
The velocity on the plane of the sky is given by the corrected peculiar proper motion:
 (B.18)
and the total space velocity of the star in relation to the local interstellar medium is then
 (B.19)
In Table 2 we give the peculiar proper motions estimated by us for the three runaway stars found in CMa OB1. Comparison with the literature was only possible for HD 54662 (HIP 34536), which was studied by Tetzlaff et al. (2011), who found a total peculiar velocity v⋆ = 33.7 km s−1, which agrees well with our result v⋆ = 36.3 ± 2.6 km s−1. Our other two runaways, HD 53974 and HD 57682, are not present in the catalog of Tetzlaff et al. (2011).
Appendix C Ages of the CMa stellar populations according to Gaia DR2
The CMa young star candidates that were revealed by analyzing the near-IR counterparts of X-ray sources associated with the Sh2-296 nebula (Gregorio-Hetem et al. 2009; Santos-Silvaet al. 2018) can now have a more accurate estimate of their age and mass. The membership confirmation of these sources is an ongoing study that our team is currently performing based on parallaxes provided by Gaia DR2, which will be discussed in a forthcoming paper. As mentioned in the concluding remarks (Sect. 5), the preliminary results of particular interest for this work are those for sources older than 10 Myr in the catalog of Santos-Silva et al. (2018). Several are background or foreground objects. Almost half of them can be confirmed as CMa members, however. It is interesting to note that there is a trend of these objects (25/31) at distances in the range 1100–1250 pc that means that the absolute magnitude (~ 0.2−0.5 mag) is underestimated. This difference would give a younger age for these sources, but not too different of the 10 Myr range. A more detailed analysis (considering individual values of AV, e.g.) is required to improve the age estimate for all the confirmed members that are associated with this star-forming region. Nevertheless, these preliminary results confirm the concluding remarks concerning the presence of an older (~ 10 Myr) population in CMa that may have been triggered by early SN explosions that generated the Hα supershell we have found.
References
- Blaauw, A. 1961, Bull. Astron. Inst. Netherlands, 15, 265 [NASA ADS] [Google Scholar]
- Bonnarel, F., Fernique, P., Bienaymé, O., et al. 2000, A&AS, 143, 33 [NASA ADS] [CrossRef] [EDP Sciences] [Google Scholar]
- Chevalier, R. A. 1974, ApJ, 188, 501 [NASA ADS] [CrossRef] [Google Scholar]
- Chu, Y.-H., & Mac Low, M.-M. 1990, ApJ, 365, 510 [NASA ADS] [CrossRef] [Google Scholar]
- Claria, J. J. 1974, AJ, 79, 1022 [NASA ADS] [CrossRef] [Google Scholar]
- Comerón, F., & Pasquali, A. 2007, A&A, 467, L23 [NASA ADS] [CrossRef] [EDP Sciences] [Google Scholar]
- Comerón, F., Torra, J., & Gomez, A. E. 1998, A&A, 330, 975 [Google Scholar]
- Dawson, J. R., Ntormousi, E., Fukui, Y., Hayakawa, T., & Fierlinger, K. 2015, ApJ, 799, 64 [NASA ADS] [CrossRef] [Google Scholar]
- Dobashi, K. 2011, PASJ, 63, S1 [NASA ADS] [CrossRef] [Google Scholar]
- Dunne, B. C., Points, S. D., & Chu, Y.-H. 2001, ApJS, 136, 119 [NASA ADS] [CrossRef] [Google Scholar]
- Fernandes, B., Gregorio-Hetem, J., Montmerle, T., & Rojas, G. 2015, MNRAS, 448, 119 [NASA ADS] [CrossRef] [Google Scholar]
- Fernique, P., Allen, M. G., Boch, T., et al. 2015, A&A, 578, A114 [NASA ADS] [CrossRef] [EDP Sciences] [Google Scholar]
- Fierro-Santillán, C. G., Zsargó, J., Klapp, J., et al. 2018, ApJS, 236, 38 [CrossRef] [Google Scholar]
- Fischer, W. J., Padgett, D. L., Stapelfeldt, K. L., & Sewiło, M. 2016, ApJ, 827, 96 [NASA ADS] [CrossRef] [Google Scholar]
- Fry, B. J., Fields, B. D., & Ellis, J. R. 2015, ApJ, 800, 71 [NASA ADS] [CrossRef] [Google Scholar]
- Fullerton, A. W. 1990, PhD Thesis, University of Toronto, Canada [Google Scholar]
- Gabici, S., & Montmerle, T. 2015, Proc. 34th ICRC, Proceedings of Science, 29 [Google Scholar]
- Gaia Collaboration (Brown, A. G. A., et al.) 2018, A&A, 616, A1 [NASA ADS] [CrossRef] [EDP Sciences] [Google Scholar]
- Gaylard, M. J., & Kemball, A. J. 1984, MNRAS, 211, 155 [CrossRef] [Google Scholar]
- Gontcharov, G. A. 2006, Astron. Lett., 32, 759 [NASA ADS] [CrossRef] [Google Scholar]
- Gregorio-Hetem, J. 2008, Handbook of Star Forming Regions, Volume II, ed. B. Reipurth (San Francisco, CA: ASP Monograph Publications), 1 [Google Scholar]
- Gregorio-Hetem, J., Montmerle, T., Rodrigues, C. V., et al. 2009, A&A, 506, 711 [NASA ADS] [CrossRef] [EDP Sciences] [Google Scholar]
- Hambly, N. C., MacGillivray, H. T., Read, M. A., et al. 2001, MNRAS, 326, 1279 [NASA ADS] [CrossRef] [Google Scholar]
- Heiles, C. 1984, ApJS, 55, 585 [NASA ADS] [CrossRef] [Google Scholar]
- Herbst, W., & Assousa, G. 1977, ApJ, 217, 473 [NASA ADS] [CrossRef] [Google Scholar]
- Houk, N., & Smith-Moore, M. 1988, Michigan Catalogue of Two-dimensional Spectral Types for the HD Stars (Ann Arbor, MI: University of Michigan), 4 [Google Scholar]
- Houk, N., & Swift, C. 1999, Michigan Spectral Survey (Ann Arbor: University of Michigan), 5 [Google Scholar]
- Johnson, D. R. H., & Soderblom, D. R. 1987, AJ, 93, 864 [NASA ADS] [CrossRef] [Google Scholar]
- Kachelrieß, M., Neronov, A., & Semikoz, D. V. 2015, Phys. Rev. Lett., 115, 181103 [NASA ADS] [CrossRef] [Google Scholar]
- Kavanagh, P. J., Sasaki, M., & Points, S. D. 2012, A&A, 547, A19 [NASA ADS] [CrossRef] [EDP Sciences] [Google Scholar]
- Kharchenko, N. V., Piskunov, A. E., Röser, S., Schilbach, E., & Scholz, R.-D. 2005, A&A, 438, 1163 [NASA ADS] [CrossRef] [EDP Sciences] [MathSciNet] [Google Scholar]
- Kim, B. G., Kawamura, A., Yonekura, Y., & Fukui, Y. 2004, PASJ, 56, 313 [NASA ADS] [Google Scholar]
- Kobulnicky, H. A., Chick, W. T., Schurhammer, D. P., et al. 2016, ApJS, 227, 18 [NASA ADS] [CrossRef] [Google Scholar]
- Krause, M. G. H., & Diehl, R. 2014, ApJ, 794, L21 [NASA ADS] [CrossRef] [Google Scholar]
- Krause, M., Diehl, R., Böhringer, H., Freyberg, M., & Lubos, D. 2014, A&A, 566, A94 [NASA ADS] [CrossRef] [EDP Sciences] [Google Scholar]
- Krticka, J., & Kubát, J. 2010, A&A, 519, A50 [NASA ADS] [CrossRef] [EDP Sciences] [Google Scholar]
- Lallement, R., Welsh, B. Y., Vergely, J. L., Crifo, F., & Sfeir, D. 2003, A&A, 411, 447 [EDP Sciences] [Google Scholar]
- Lasker, B. M. 1977, PASP, 89, 474 [CrossRef] [Google Scholar]
- Mallick, K. K., Ojha, D. K., Samal, M. R., et al. 2012, ApJ, 759, 48 [NASA ADS] [CrossRef] [Google Scholar]
- Markova, N., Puls, J. Repolust, T., Markov, H. 2004, A&A, 413, 693 [NASA ADS] [CrossRef] [EDP Sciences] [Google Scholar]
- Martins, F., Schaerer, D., & Hillier, D. J. 2005, A&A, 436, 1049 [NASA ADS] [CrossRef] [EDP Sciences] [Google Scholar]
- McClure-Griffiths, N. M., Dickey, J. M., Gaensler, B. M., & Green, A. J. 2002, ApJ, 578, 176 [NASA ADS] [CrossRef] [Google Scholar]
- Moffat, A. F. J., Marchenko, S. V., Seggewiss, W., et al. 1998, A&A, 331, 949 [NASA ADS] [Google Scholar]
- Mossoux, E., Mahy, L., Rauw, G. 2018, A&A, 615, A19 [NASA ADS] [CrossRef] [EDP Sciences] [Google Scholar]
- Murakami, H., Baba, H., Barthel, P., et al. 2007, PASJ, 59, S369 [NASA ADS] [CrossRef] [MathSciNet] [Google Scholar]
- Nakano, M., Yoshida, S., & Kogure, T. 1984, PASJ, 36, 517 [Google Scholar]
- Ochsendorf, B. B., Brown, A. G. A., Bally, J., & Tielens, A. G. G. M. 2015, ApJ, 808, 111 [NASA ADS] [CrossRef] [Google Scholar]
- Onishi, T., Nishimura, A., Ota, Y., et al. 2013, PASJ, 65, 78 [NASA ADS] [CrossRef] [Google Scholar]
- Panagia, N. 1973, AJ, 78, 929 [NASA ADS] [CrossRef] [Google Scholar]
- Peri, C. S., Benaglia, P., & Isequilla, N. L. 2015, A&A, 578, A45 [NASA ADS] [CrossRef] [EDP Sciences] [Google Scholar]
- Planck Collaboration I. 2016, A&A, 594, A1 [NASA ADS] [CrossRef] [EDP Sciences] [Google Scholar]
- Poleski, R. 2013, ArXiv e-prints [arXiv:1306.2945] [Google Scholar]
- Pon, A., Ochsendorf, B. B., Alves, J., et al. 2016, ApJ, 827, 42 [NASA ADS] [CrossRef] [Google Scholar]
- Poveda, A., Ruiz, J., & Allen, C. 1967, Boletin de los Observatorios Tonantzintla y Tacubaya, 4, 86 [Google Scholar]
- Poveda, A., Allen, C., & Hernández-Alcántara, A. 2005, ApJ, 627, L61 [NASA ADS] [CrossRef] [Google Scholar]
- Rebull, L. M., Johnson, C. H., Gibbs, J. C., et al. 2013, AJ, 145, 15 [NASA ADS] [CrossRef] [Google Scholar]
- Reich, W., Reich, P., & Fuerst, E. 1990, A&AS, 83, 539 [Google Scholar]
- Remazeilles, M., Dickinson, C., Banday, A. J., Bigot-Sazy, M.-A., & Ghosh, T. 2015, MNRAS, 451, 4311 [NASA ADS] [CrossRef] [Google Scholar]
- Reynolds, R. J., & Ogden, P. M. 1978, ApJ, 224, 94 [CrossRef] [Google Scholar]
- Reynoso, E. M., & Mangum, J. G. 2001, AJ, 121, 347 [NASA ADS] [CrossRef] [Google Scholar]
- Sana, H., Le Bouquin, J.-B., Lacour, S., et al. 2014, ApJS, 215, 15 [NASA ADS] [CrossRef] [Google Scholar]
- Santos-Silva, T., Gregorio-Hetem, J., Montmerle, T., Fernandes, B., & Stelzer, B. 2018, A&A, 609, A127 [CrossRef] [EDP Sciences] [Google Scholar]
- Sasaki, M., Breitschwerdt, D., Baumgartner, V., & Haberl, F. 2011, A&A, 528, A136 [NASA ADS] [CrossRef] [EDP Sciences] [Google Scholar]
- Schaerer, D., & de Koter A. 1997, A&A, 322, 598 [Google Scholar]
- Scheffler, H., Armstrong, A., & Elsässer, H. 1988, Physics of the Galaxy and Interstellar Matter, Astronomy and Astrophysics Library (Berlin: Springer) [Google Scholar]
- Schönrich, R., Binney, J., & Dehnen, W. 2010, MNRAS, 403, 1829 [NASA ADS] [CrossRef] [Google Scholar]
- Sexton, R. O., Povich, M. S., Smith, N., et al. 2015, MNRAS, 446, 1047 [NASA ADS] [CrossRef] [Google Scholar]
- Shevchenko, V. S., Ezhkova, O. V., Ibrahimov, M. a., van den Ancker, M. E., & Tjin A Djie, H. R. E. 1999, MNRAS, 310, 210 [NASA ADS] [CrossRef] [Google Scholar]
- Soares, J. B., & Bica, E. 2002, A&A, 388, 172 [NASA ADS] [CrossRef] [EDP Sciences] [Google Scholar]
- Sota, A., Maíz Apellániz, J., Walborn, N. R., et al. 2011, ApJS, 193, 24 [NASA ADS] [CrossRef] [Google Scholar]
- Sota, A., Maíz Apellániz, J., Morrell, N. I., et al. 2014, ApJS, 211, 10 [NASA ADS] [CrossRef] [Google Scholar]
- Stil, J. M., & Irwin, J. A. 2001, ApJ, 563, 816 [NASA ADS] [CrossRef] [Google Scholar]
- Suad, L. A., Caiafa, C. F., Arnal, E. M., & Cichowolski, S. 2014, A&A, 564, A116 [NASA ADS] [CrossRef] [EDP Sciences] [Google Scholar]
- Suad, L. A., Caiafa, C. F., Cichowolski, S., & Arnal, E. M. 2019, A&A, 624, A43 [CrossRef] [EDP Sciences] [Google Scholar]
- Tetzlaff, N., Neuhäuser, R., & Hohle, M. M. 2011, MNRAS, 410, 190 [NASA ADS] [CrossRef] [Google Scholar]
- Tetzlaff, N., Torres, G., Neuhäuser, R., & Hohle, M. M. 2013, MNRAS, 435, 879 [NASA ADS] [CrossRef] [Google Scholar]
- Tjin A. Djie, H. R. E., van den Ancker, M. E., et al. 2001, MNRAS, 325, 1441 [NASA ADS] [CrossRef] [Google Scholar]
- van Leeuwen, F. 2007, A&A, 474, 653 [NASA ADS] [CrossRef] [EDP Sciences] [Google Scholar]
- Vaupré, S., Hily-Blant, P., Ceccarelli, C., et al. 2014, A&A, 568, A50 [NASA ADS] [CrossRef] [EDP Sciences] [Google Scholar]
- Wright, E. L., Eisenhardt, P. R. M., Mainzer, A. K., et al. 2010, AJ, 140, 1868 [NASA ADS] [CrossRef] [Google Scholar]
- Xiao, L., & Zhu, M. 2014, MNRAS, 438, 1081 [CrossRef] [Google Scholar]
- Yadav, A. P., & Glatzel, W. 2017, MNRAS, 471, 3245 [CrossRef] [Google Scholar]
Kindly provided by T. Onishi and K. Tokuda (priv. comm.; see also Onishi et al. 2013 for a description of the telescope and the observational program.).
HD 54361 (W CMa) is a massive carbon AGB star for which the parallax (p′′ = 1.805 mas) and proper motion (μα = −6.5 mas yr−1; μδ = + 2.3 mas yr−1) have recently been reported by Gaia DR2. These data, combined with the estimated radial velocity (~19–23 km s−1) for HD 54361, are evidence that its position at the center of the shell may be just a coincidence.
However, as shown recently by Suad et al. (2014, 2019), a much larger population of ~ 500 galactic supershells exists, but with lower or far lower kinetic energies (1047 to ~ 1051 erg).
Many other cases of interactions between SNRs and molecular clouds are known in the Galaxy, but they concern much younger (≈ 104 −105 yr old) SNRs, in particular, those that are linked with GeV-TeV γ-ray sources (e.g., Gabici & Montmerle 2015; Vaupré et al. 2014, and references therein).
All Tables
All Figures
|
Fig. 1 RGB-color DSS image of the region containing the CMa OB1 region and enlarged view of the Sh 2-296 nebula, extracted from the Progressive Sky (HiPS; Fernique et al. 2015) tool from the Aladin Sky Atlas (Bonnarel et al. 2000). The approximate position of three runaway stars (see Sect. 2) and of the other O star members of the association (HD 53975 and HD 54879) are marked and labeled (the italics identify the runaways). The white thin lines trace the 13CO emission obtained with the Osaka 1.85 m mm-submm telescope. This emission is tightly correlated with thedust emission seen by the Planck satellite (LFI instrument; see Fig. A.1, which covers a larger area than this DSS image), so we expect no CO emission outside of the Osaka survey area (dashed box). We also show the coordinates on the galactic plane at b = 0°. The ellipse in yellow marks the approximate shape of the CMa shell, centered at α = 07 08 36.824, δ = −12 17 41.26, with a semi-major axis of ~32 pc at theadopted distance for the nebula of 1 kpc. The faint features visible at the bottom and at the top of the figure (around HD 57682) are also visible in Hα images and detected in the radio range (see Fig. 9 and the discussion in Sect. 3). |
| In the text | |
|
Fig. 2 WISE composite-color image of the bow shock associated with HD 54662. Red shows band 4, 22.2 μm. Green showsband 3, 12.1 μm. Blue shows band 1, 3.4 μm (north is up, east to the left). The white vector (not to scale) represents the direction of the proper motion (Gaia Collaboration 2018), corrected for galactic rotation and basic solar motion, and the 1σ errors are represented by dashed lines. A WISE 22 μm image of the bow shock is inset at the bottom left of the figure, overlaid with linearly scaled contours of 22 μm emission. The velocity vector is oriented toward the densest region of the bow shock, not toward its apparent apex. |
| In the text | |
|
Fig. 3 Same as Fig. 2, but for HD 57682. In the inset, the blue vectors indicate the preferential orientation of the bow shock and 1σ errors, as outlined by the contours. The vector lengths are not to scale (north is up, east to the left). |
| In the text | |
|
Fig. 4 Images of the bow shock associated with HD 53974 from the AAO/UKST SuperCOSMOS Hα survey (Hambly et al. 2001) overlaid with linearly scaled contours of the emission at 22.2 μm that outline the shape of the bow shock. Left: the blue vector represents the direction defined by the HIPPARCOS proper motion corrected for galactic rotation and basic solar motion, within 1σ errors. Right: a WISE color-composite image of the bow shock is inset at the top left corner of the figure. The blue vector indicates the preferential orientation (apex) of the bow shock, which we define by drawing a straight line from the location of the star to the point of highest 22 μm emission. The 1σ uncertainty (thin blue lines) is outlined by the highest level contour from the 22.2 μm emission. The vector lengths are not to scale (north is up, east to the left). |
| In the text | |
|
Fig. 5 DSS2-R image of the region containing CMa R1 (north is up, east to the left). The ellipse shows the approximate extent of the shell, and the arrows indicate the past positions of the runaway stars going back a few million years (as labeled in the image), according to the derived proper motions of HD 57682 and HD 54662, and the bow-shock orientation of HD 53974. The dashed blue lines represent the 1σ uncertainty on the axis of the bow shock associated with HD 53974, as discussed in the caption of Fig. 4. The stars HD 54662, HD 53974, and HD 57682 would have been at a coinciding position, located close to the center of the CMa shell, ~6, ~2, and ~1 Myr ago, respectively. |
| In the text | |
|
Fig. 6 Deep close-up view of the Sh 2-296 nebula in Hα with significant labels added (image courtesy of S. Guisard (sguisard.astrosurf.com) and T. Demange (www.capnature.com)). This view vividly illustrates the ionized evaporation features that flow away from the adjacent molecular clouds: long (up to ~10 pc) filaments, smaller scale eggs and pillars (e.g., near the Herbig Be star Z CMa, or the SFO 29 filament), and bright dense corrugations. Interacting with this flow, the runaway O star HD 53974 has created a conspicuous bow shock (see text, Sect. 2, and Fig. 4). Given the evaporation features, it is plausible that the bubble edge is located behind the Lynds dark nebulae LDN1657A and LDN1657B. |
| In the text | |
|
Fig. 7 (a) DSS2-R image of the Sh 2-296 nebula (pixel size 1.7 arcsec). The ellipse outlines the proposed shape of the CMa R1 shell. The contours in each panel trace (b) the 13CO emission (courtesy of the Osaka group, see Onishi et al. 2013). The angular resolution (beam size) is 2.7 arcmin in HPBW; (c) the extinction (AV) from the 2MASS maps of Dobashi (2011), resolution of 1 arcmin; (d) the continuum radio emission at 10 GHz extracted from Nakano et al. (1984), beam size (HPBW) of 2.7 arcmin. |
| In the text | |
|
Fig. 8 WISE composite-color image of the CMa R1 region. Red shows band 4, 22.2 μm. Green showsband 3, 12.1 μm. Blue shows band 1, 3.4 μm. The yellow circles delimit the area of the YSO groups identified by Fischer et al. (2016). The circles in cyan show the position of XMM-Newton fields observed by Santos-Silva et al. (2018); 387 young stars are found in these fields. The majority have counterparts in the X-ray sources previously detected with ROSAT by Gregorio-Hetem et al. (2009), although they indicate an extended distribution of young stars west of the nebula. The white contours trace the 13CO emission. The dashed thin line shows the galactic longitude at b = 0°, and the white dashed ellipse represents the CMa shell (see Fig. 1). |
| In the text | |
|
Fig. 9 Large-scale Hα environmentof the CMa shell from the SHASSA survey. The faint emission is enhanced down to a surface brightness of ~150 dR. Conspicuous Hα filaments are visible, which are well correlated with the radio map of Gaylard & Kemball (1984) (their Fig. 1), in particular, with features that we outline in green in this figure, called Northern Arc and Southern Loop (which is well correlated with the southern half of the CMa shell). We suggest that this faint Hα emission is associated with a superbubble ~140 pc in diameter (here outlined in the form of the dashed cyan ellipse), analogously to Barnard’s Loop around the Orion nebula. |
| In the text | |
|
Fig. A.1 Images of CMa R1 at different wavelengths obtained with Aladin Progressive Sky (HiPs). The positions of the O stars HD 57682, HD 54662, HD 54879, and HD 53974 are marked as red crosses. The small dotted magenta ellipse represents the CMa shell, and the large dotted cyan ellipse encloses the superbubble suggested by us. From top left to bottom right: Hα image from the SHASSA Survey (see also Fig. 9); Akari (Murakami et al. 2007) color-composition at 140 μm (red), 90 μm (green), and 65 μm (blue); Planck Release 2 (Planck Collaboration I 2016) HFI color-composition at 353 GHz (red), 545 GHz (green), 857 GHz (blue); Planck Release 2 LFI color-composition at 30 GHz (red), 44 GHz (green) and 70 GHz (blue); image from the Effelsberg telescope at 21 cm (Reich et al. 1990); and from the reprocessed Haslam survey at 408 MHz (Remazeilles et al. 2015). Note the correspondence between the Planck LFI emission (cold dust) and the 13CO emission shown in Fig. 1. |
| In the text | |
Current usage metrics show cumulative count of Article Views (full-text article views including HTML views, PDF and ePub downloads, according to the available data) and Abstracts Views on Vision4Press platform.
Data correspond to usage on the plateform after 2015. The current usage metrics is available 48-96 hours after online publication and is updated daily on week days.
Initial download of the metrics may take a while.