Fig. A.1
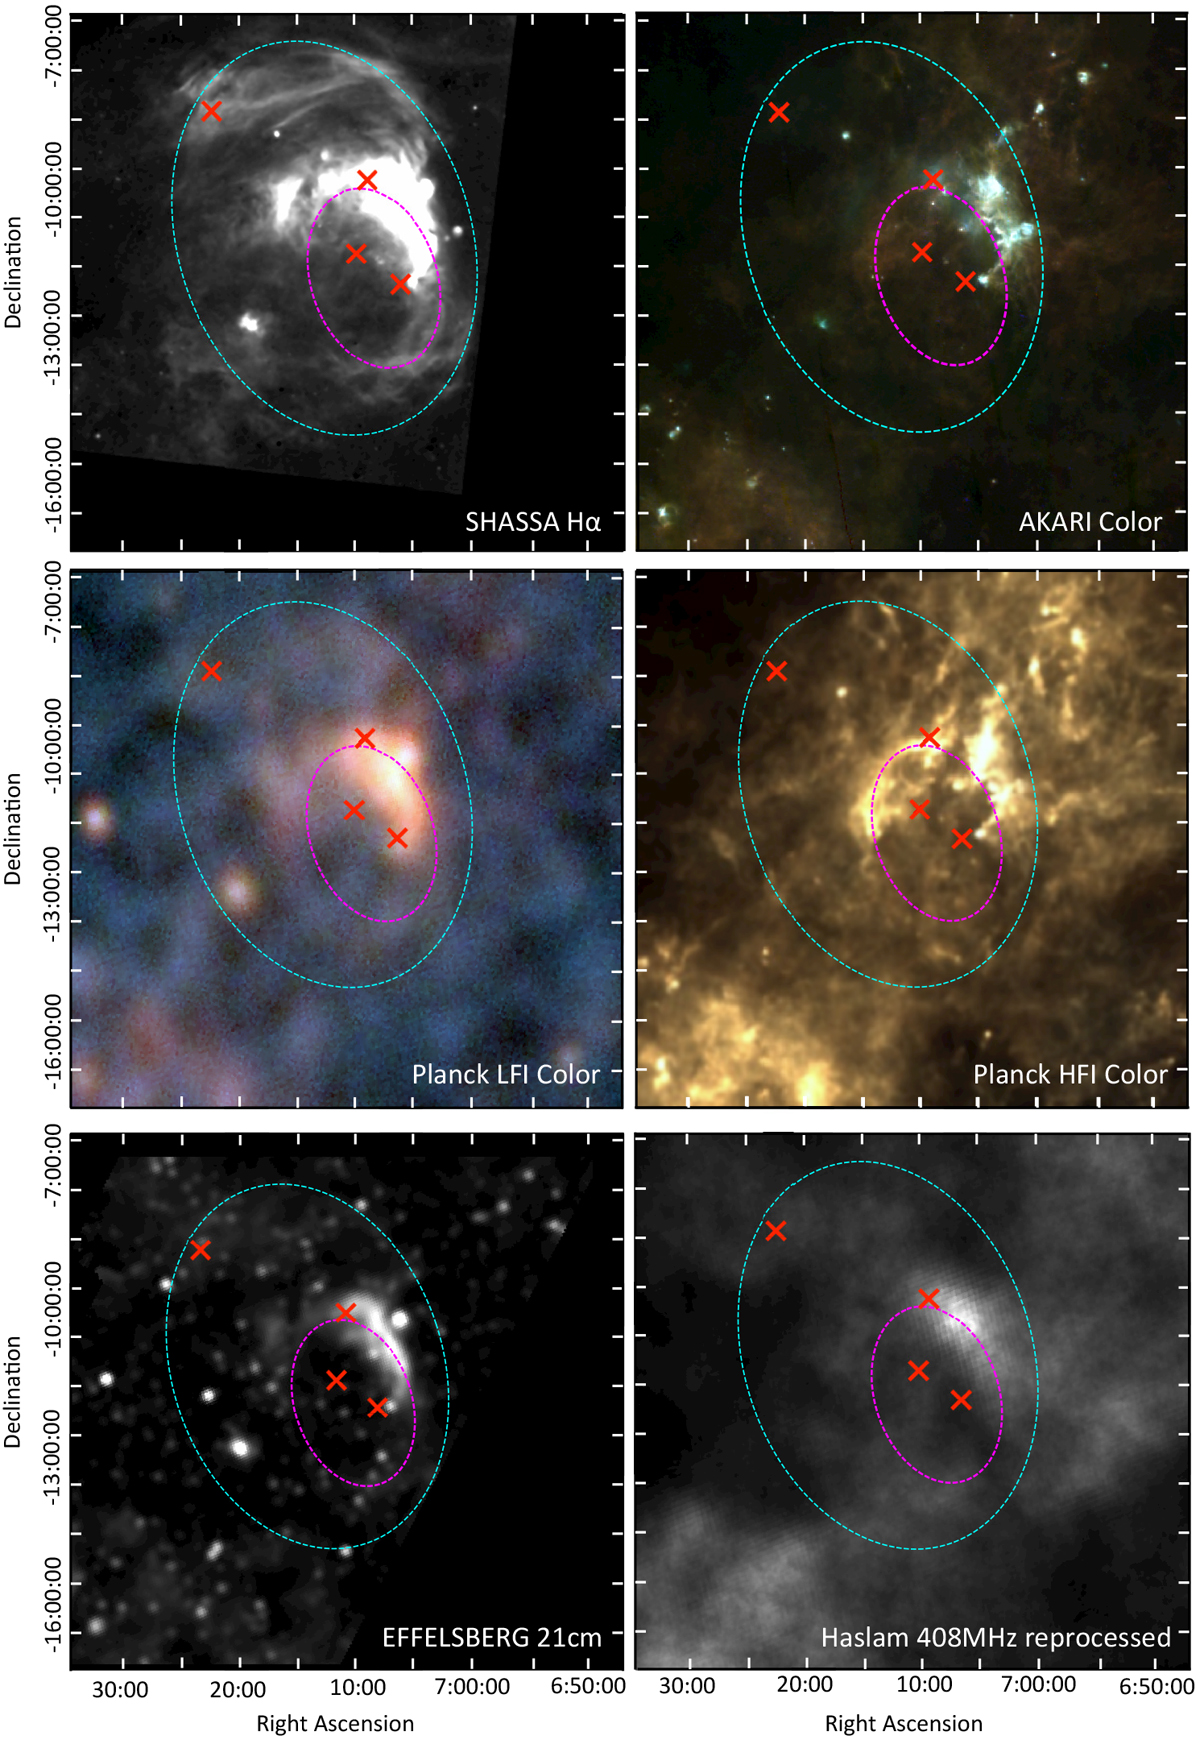
Images of CMa R1 at different wavelengths obtained with Aladin Progressive Sky (HiPs). The positions of the O stars HD 57682, HD 54662, HD 54879, and HD 53974 are marked as red crosses. The small dotted magenta ellipse represents the CMa shell, and the large dotted cyan ellipse encloses the superbubble suggested by us. From top left to bottom right: Hα image from the SHASSA Survey (see also Fig. 9); Akari (Murakami et al. 2007) color-composition at 140 μm (red), 90 μm (green), and 65 μm (blue); Planck Release 2 (Planck Collaboration I 2016) HFI color-composition at 353 GHz (red), 545 GHz (green), 857 GHz (blue); Planck Release 2 LFI color-composition at 30 GHz (red), 44 GHz (green) and 70 GHz (blue); image from the Effelsberg telescope at 21 cm (Reich et al. 1990); and from the reprocessed Haslam survey at 408 MHz (Remazeilles et al. 2015). Note the correspondence between the Planck LFI emission (cold dust) and the 13CO emission shown in Fig. 1.
Current usage metrics show cumulative count of Article Views (full-text article views including HTML views, PDF and ePub downloads, according to the available data) and Abstracts Views on Vision4Press platform.
Data correspond to usage on the plateform after 2015. The current usage metrics is available 48-96 hours after online publication and is updated daily on week days.
Initial download of the metrics may take a while.