Fig. 9
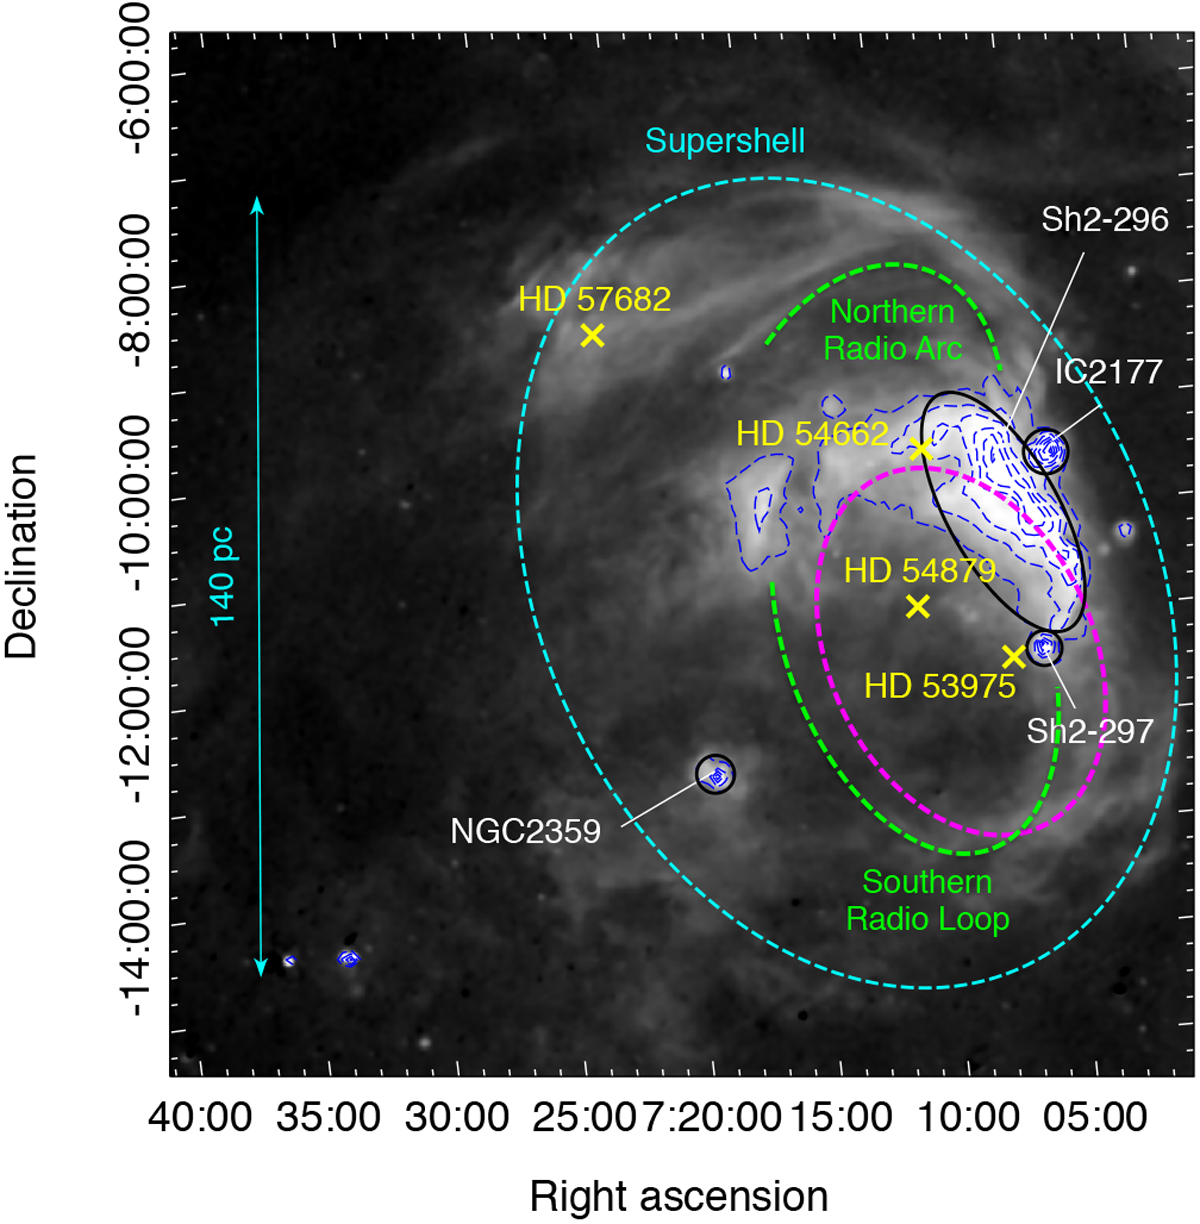
Large-scale Hα environmentof the CMa shell from the SHASSA survey. The faint emission is enhanced down to a surface brightness of ~150 dR. Conspicuous Hα filaments are visible, which are well correlated with the radio map of Gaylard & Kemball (1984) (their Fig. 1), in particular, with features that we outline in green in this figure, called Northern Arc and Southern Loop (which is well correlated with the southern half of the CMa shell). We suggest that this faint Hα emission is associated with a superbubble ~140 pc in diameter (here outlined in the form of the dashed cyan ellipse), analogously to Barnard’s Loop around the Orion nebula.
Current usage metrics show cumulative count of Article Views (full-text article views including HTML views, PDF and ePub downloads, according to the available data) and Abstracts Views on Vision4Press platform.
Data correspond to usage on the plateform after 2015. The current usage metrics is available 48-96 hours after online publication and is updated daily on week days.
Initial download of the metrics may take a while.