Fig. 1
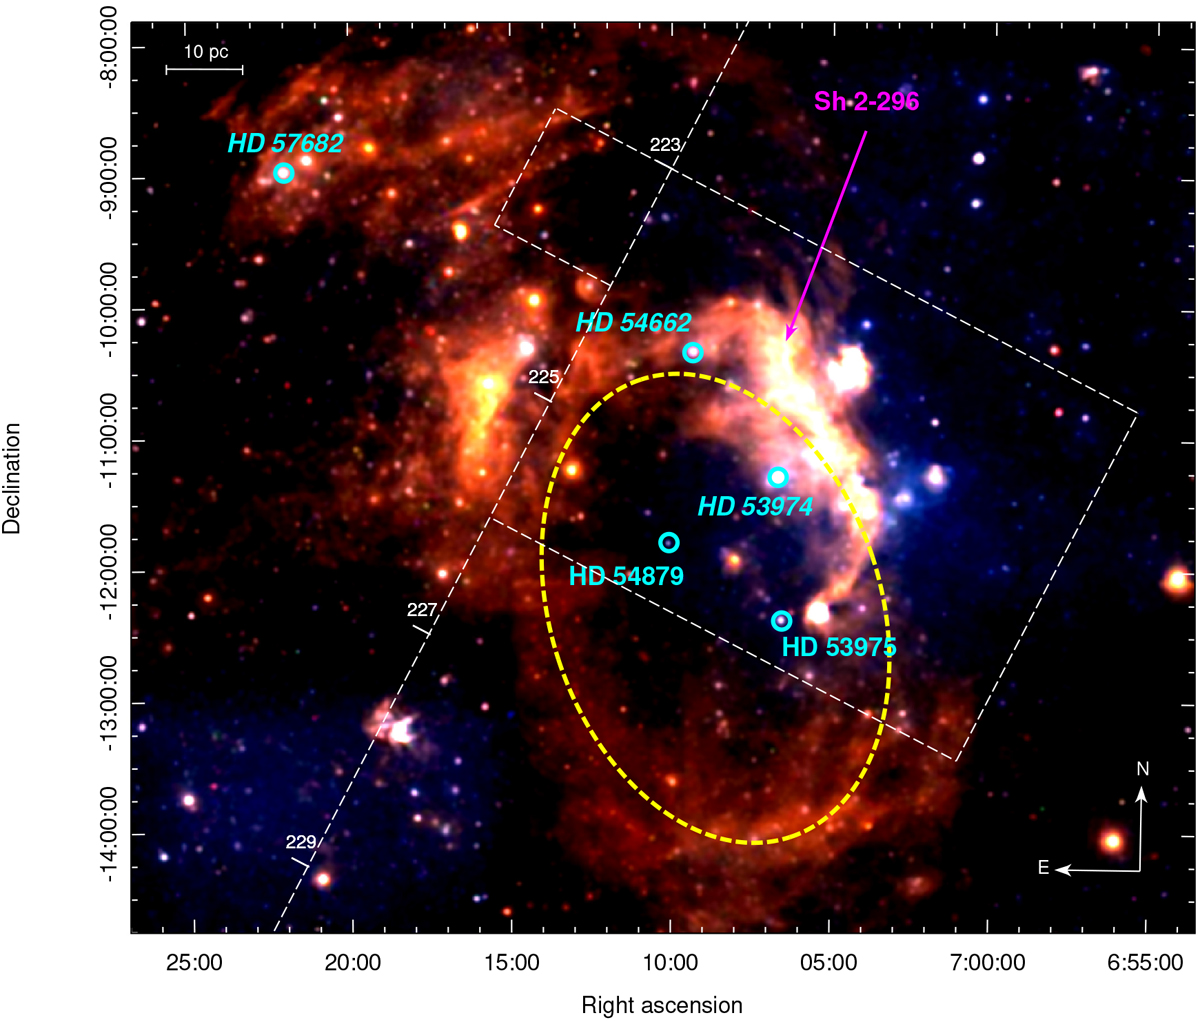
RGB-color DSS image of the region containing the CMa OB1 region and enlarged view of the Sh 2-296 nebula, extracted from the Progressive Sky (HiPS; Fernique et al. 2015) tool from the Aladin Sky Atlas (Bonnarel et al. 2000). The approximate position of three runaway stars (see Sect. 2) and of the other O star members of the association (HD 53975 and HD 54879) are marked and labeled (the italics identify the runaways). The white thin lines trace the 13CO emission obtained with the Osaka 1.85 m mm-submm telescope. This emission is tightly correlated with thedust emission seen by the Planck satellite (LFI instrument; see Fig. A.1, which covers a larger area than this DSS image), so we expect no CO emission outside of the Osaka survey area (dashed box). We also show the coordinates on the galactic plane at b = 0°. The ellipse in yellow marks the approximate shape of the CMa shell, centered at α = 07 08 36.824, δ = −12 17 41.26, with a semi-major axis of ~32 pc at theadopted distance for the nebula of 1 kpc. The faint features visible at the bottom and at the top of the figure (around HD 57682) are also visible in Hα images and detected in the radio range (see Fig. 9 and the discussion in Sect. 3).
Current usage metrics show cumulative count of Article Views (full-text article views including HTML views, PDF and ePub downloads, according to the available data) and Abstracts Views on Vision4Press platform.
Data correspond to usage on the plateform after 2015. The current usage metrics is available 48-96 hours after online publication and is updated daily on week days.
Initial download of the metrics may take a while.