| Issue |
A&A
Volume 628, August 2019
|
|
|---|---|---|
| Article Number | A93 | |
| Number of page(s) | 16 | |
| Section | Stellar structure and evolution | |
| DOI | https://doi.org/10.1051/0004-6361/201935420 | |
| Published online | 13 August 2019 | |
A luminous stellar outburst during a long-lasting eruptive phase first, and then SN IIn 2018cnf
1
INAF – Osservatorio Astronomico di Padova, Vicolo dell’Osservatorio 5, 35122 Padova, Italy
e-mail: This email address is being protected from spambots. You need JavaScript enabled to view it.
2
Department of Applied Physics, University of Cádiz, Campus of Puerto Real, 11510 Cádiz, Spain
3
Instituto de Astrofísica de Andalucía (IAA-CSIC), Glorieta de la Astronomía s/n, 18008 Granada, Spain
4
Berkshire College of Agriculture, Hall Place, Burchetts Green Rd, Burchett’s Green, Maidenhead, UK
5
Astrophysics Research Centre, School of Mathematics and Physics, Queen’s University Belfast, Belfast BT7 1NN, UK
6
Department of Physics, University of California, Santa Barbara, CA 93106-9530, USA
7
Las Cumbres Observatory, 6740 Cortona Drive, Suite 102, Goleta, CA 93117-5575, USA
8
Department of Physics and Astronomy, University of Turku, 20014 Turku, Finland
9
Kavli Institute for Astronomy and Astrophysics, Peking University, Yi He Yuan Road 5, Hai Dian District, Beijing 100871, PR China
10
Dipartimento di Fisica e Astronomia, Università di Padova, Vicolo dell’Osservatorio 3, 35122 Padova, Italy
11
INAF – Osservatorio Astronomico di Brera, Via E. Bianchi 46, 23807 Merate, LC, Italy
12
Las Campanas Observatory – Carnagie Institution of Washington, Colina el Pino, Casilla 601, La Serena, Chile
13
Gran Telescopio Canarias (GRANTECAN), Cuesta de San José s/n, 38712 Breña Baja, La Palma, Spain
14
Instituto de Astrofísica de Canarias, Vía Láctea s/n, 38200 La Laguna, Tenerife, Spain
15
Warsaw University Astronomical Observatory, Al. Ujazdowskie 4, 00-478 Warszawa, Poland
16
Department of Physics, Florida State University, Tallahassee, FL 32306, USA
17
Departamento de Ciencias Físicas, Universidad Andrés Bello, Santiago, Chile
18
Millennium Institute of Astrophysics, Santiago, Chile
19
National Astronomical Observatories, Chinese Academy of Sciences, Beijing 100101, PR China
20
Chinese Academy of Sciences South America Center for Astronomy, China-Chile Joint Center for Astronomy, Camino El Observatorio 1515, Las Condes, Santiago, Chile
21
The School of Physics and Astronomy, Tel Aviv University, Tel Aviv 69978, Israel
22
School of Physics, O’Brien Centre for Science North, University College Dublin, Belfield Dublin 4, Ireland
23
Dark Cosmology Centre, Niels Bohr Institute, Juliane Maries Vej 30, Copenhagen Ø 2100, Denmark
24
Center for Astrophysics | Harvard & Smithsonian, 60 Garden Street, Cambridge, MA 02138-1516, USA
25
School of Physics & Astronomy, Cardiff University, Queens Buildings, The Parade, Cardiff CF24 3AA, UK
26
INAF – Osservatorio Astronomico di Trieste, Via G.B. Tiepolo 11, 34143 Trieste, Italy
27
Astrophysics Research Institute, Liverpool John Moores University, 146 Brownlow Hill, Liverpool L3 5RF, UK
28
Max-Planck Institut für Astrophysik, Karl-Schwarzschild-Str. 1, 85748 Garching, Germany
29
The Oskar Klein Centre, Department of Astronomy, Stockholm University, AlbaNova 10691, Stockholm, Sweden
30
Institute of Astronomy, Madingley Road, Cambridge CB3 0HA, UK
31
Dipartimento di Fisica e Astronomia, Università degli Studi di Catania, Via S. Sofia 64, 95123 Catania, Italy
32
Institute for Astronomy, University of Hawaii, 2680 Woodlawn Drive, Honolulu, HI 96822, USA
33
School of Physics and Astronomy, University of Minnesota, 116 Church Street SE, Minneapolis, Minnesota 55455-0149, USA
Received:
6
March
2019
Accepted:
8
July
2019
Abstract
We present the results of the monitoring campaign of the Type IIn supernova (SN) 2018cnf (a.k.a. ASASSN-18mr). It was discovered about ten days before the maximum light (on MJD = 58 293.4 ± 5.7 in the V band, with MV = −18.13 ± 0.15 mag). The multiband light curves show an immediate post-peak decline with some minor luminosity fluctuations, followed by a flattening starting about 40 days after maximum. The early spectra are relatively blue and show narrow Balmer lines with P Cygni profiles. Additionally, Fe II, O I, He I, and Ca II are detected. The spectra show little evolution with time and with intermediate-width features becoming progressively more prominent, indicating stronger interaction of the SN ejecta with the circumstellar medium. The inspection of archival images from the Panoramic Survey Telescope and Rapid Response System (Pan-STARRS) survey has revealed a variable source at the SN position with a brightest detection in December 2015 at Mr = −14.66 ± 0.17 mag. This was likely an eruptive phase from the massive progenitor star that started from at least mid-2011, and that produced the circumstellar environment within which the star exploded as a Type IIn SN. The overall properties of SN 2018cnf closely resemble those of transients such as SN 2009ip. This similarity favours a massive hypergiant, perhaps a luminous blue variable, as progenitor for SN 2018cnf.
Key words: supernovae: general / supernovae: individual: SN 2018cnf / supernovae: individual: SN 2009ip / stars: winds / outflows
© ESO 2019
1. Introduction
The very late evolutionary stages of massive stars can be investigated by analysing and modelling the supernova (SN) data (i.e. the spectral evolution and the multi-band light curves), or by studying the photometric behaviour of the progenitor star in archival images. The latter method has become very popular thanks to the public availability of extensive image databases and has allowed the detection of the quiescent progenitors of a number of core-collapse supernovae (CC SNe, Smartt 2009, and references therein), as well as the discovery of extreme photometric variability experienced by very massive stars before exploding as SNe (e.g. Pastorello et al. 2007, 2013; Mauerhan et al. 2013; Fraser et al. 2013a; Ofek et al. 2013, 2014; Nyholm et al. 2017).
The CC SNe that experience major variability in the years before the explosion show unequivocal signatures of interaction with circumstellar material (CSM) gathered in the late stages of stellar evolution through to the detection of luminous emission in the X-ray, ultra-violet, and radio domains. These CC SNe also display a very high optical luminosity, accompanied by a slow-evolving light curve, and prominent narrow to intermediate-width (102–103 km s−1) spectral lines in emission (e.g. Aretxaga et al. 1999; Fransson et al. 2002; Stritzinger et al. 2012; Kiewe et al. 2012; Chandra et al. 2012; Fox et al. 2013; De la Rosa et al. 2016; Taddia et al. 2013; Smith et al. 2017). The lines are produced in the photo-ionised CSM. When the CSM is H-rich, the spectrum is that of a type IIn SN (Schlegel 1990; Filippenko 1997), while when the CSM is H-poor and He-rich, the spectrum is that of a Type Ibn SN (Matheson et al. 2000; Pastorello et al. 2008a, 2016; Hosseinzadeh et al. 2017). However, SNe showing somewhat transitional narrow-lined spectra (named Type Ibn/IIn) have also been discovered (Pastorello et al. 2008b, 2015; Smith et al. 2012).
Although several progenitor scenarios can be proposed to explain the variability of Type IIn SN observables (see e.g. Dwarkadas 2011; Leloudas et al. 2013; Moriya et al. 2013), a connection between Type IIn SNe and massive luminous blue variables (LBVs) has been suggested by Kotak & Vink (2006) and Gal-Yam & Leonard (2009), and a number of observations seem to support this claim (Smith 2017, and references therein). In particular, multiple outbursts resembling the long-lasting 19th century Giant Eruption of η Car have been discovered in a number of cases before the explosion of a Type IIn SN, supporting the existence of a tight link between LBVs and SNe IIn.
A recent case is that of SN 2018cnf, which was discovered at a magnitude g ≈ 17.7 by the All-Sky Automated Survey for Supernovae (ASAS-SN; Brimacombe et al. 2018) on 2018 June 14.34 UT. This object is also known by the survey name ASASSN-18mr1. The SN is located at  and
and  (J2000.0), in the outskirts of its host galaxy LEDA 196096. Prentice et al. (2018) classify the transient as a Type IIn SN, and noticed that it was spatially coincident with PS15dkt, a source with w = 20.72 mag detected by the Pan-STARRS Survey for Transients (PSST, Huber et al. 2015; Chambers et al. 2016) on 2015 December 9. It is important to note that pre-SN outbursts are occasionally detected before the explosion of Type IIn SNe (e.g. Ofek et al. 2014), but the number of well-monitored objects with pre-SN outbursts is still limited. This motivated us to trigger an extensive monitoring campaign. Spectroscopic and photometric follow-up was initiated soon after the classification announcement (Prentice et al. 2018), making use of the facilities available to wide international collaborations, including the extended-Public ESO Spectroscopic Survey for Transient Objects (ePESSTO, Smartt et al. 2015) and the NOT Unbiased Transient Survey (NUTS, Mattila et al. 2016). We also made use of some public data from ATLAS (Tonry 2011; Tonry et al. 2018) and the ASAS-SN survey (Shappee et al. 2014). The observational campaign continued for about four months until the object became too faint to be comfortably detected with mid-size telescopes.
2. Host galaxy and reddening
The host galaxy is an early spiral and the spectrum of its core from Heath et al. (2009) shows H lines in emission, along with prominent [N II] λλ6548, 6583 lines, and a weak [S II] λλ 6717, 6731 doublet, while [O III] λλ4959, 5007 lines are not detected. Classical absorption features like Ca II H & K, Mg I λ5175, Na ID, and the G-band are also detected.
The redshift of LEDA 196096 is z = 0.02376 ± 0.000152. By adopting a recessional velocity corrected for Virgo Infall of 7127 ± 48 km s−1 (Mould et al. 2000) and a standard cosmology with H0 = 73 km s−1 Mpc−1, we infer a luminosity distance of 99.5 ± 7.0 Mpc, hence a distance modulus μ = 34.99 ± 0.15 mag. The Milky Way contribution to the total line-of-sight extinction towards LEDA 196096 is E(B − V) = 0.038 mag, from Schlafly & Finkbeiner (2011) and by adopting the Cardelli et al. (1989) extinction law. Additional host galaxy reddening is inferred from an early, high resolution spectrum of SN 2018cnf. Accounting for this contribution, we adopt a total reddening E(B − V) = 0.12 ± 0.03 mag in this paper (see Sect. 4).
3. Spectral evolution
Following the classification of SN 2018cnf as a Type IIn event, several spectra were collected spanning a period from one week before maximum to about three months past maximum. We made use of multiple instruments, including the 10.4 m Gran Telescopio Canarias (GTC) equipped with OSIRIS, the 2.0 Liverpool Telescope with SPRAT, the 2.56 m Nordic Optical Telescope (NOT) with ALFOSC, the 1.82 m Asiago Copernico Telescope with AFOSC, the 2.0 m Faulkes North and South Telescopes with the FLOYDS spectrographs of the Las Cumbres Observatory as part of the Global Supernova Project, the 3.58 m New Technology Telescope (NTT) with EFOSC2, and the 6.5 m Magellan Telescope with FIRE. The spectra were reduced following standard prescriptions in IRAF, including bias, flat-field, and overscan correction. Then we performed optimal extraction of the 1D spectra. Wavelength calibration was done using arc lamp spectra and then was checked using night skylines. Flux calibration was performed with instrumental sensitivity functions obtained from spectro-photometric standards obtained the same night as the SN observation. The spectra of the standards were also used to remove telluric absorption bands. Finally, the accuracy of the flux calibration was controlled with coeval photometry (Sect. 5), and a constant factor was applied to the flux in case of a discrepancy. The FIRE NIR spectrum was reduced and telluric-corrected with the procedures described by Hsiao et al. (2019). All spectra were finally corrected for a total reddening E(B − V) = 0.12 mag, and for a redshift z = 0.023458, as obtained from the position of the narrow Na I λλ5890, 5896 (Na ID) lines of the host galaxy in the high-resolution UVES spectrum of SN 2018cnf (see Sect. 4). We note that this redshift value is slightly smaller than that reported by the NED. This can be due to the peripheral location of SN 2018cnf and hence to the host galaxy rotation curve.
The comprehensive information on the dataset is presented in Table 1, and the spectral sequence is shown in Fig. 1. The phases are from the V-band maximum light (MJD = 58 293.4 ± 5.7, see Sect. 5).
Basic information on spectra collected for SN 2018cnf.
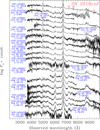 |
Fig. 1. Spectral evolution of SN 2018cnf, spanning approximately 115 day period, from one week before peak to over 100 days after maximum. The phases are from the V-band maximum. Only spectra with good signal to noise are shown. |
The evolution of the following individual lines is shown in detail in Fig. 2: Hα, Hβ, and the He I plus Na I D feature (right, centre, and left panels, respectively). The evolution of the Fe II lines (triplet 42) is also shown in the central panel of Fig. 2.
Early low-resolution spectra, from one week before to about one week after the maximum light, show a relatively blue continuum (with a black-body temperature of 8300 ± 600 K), and superposed strong Balmer and Fe II lines with P Cygni profiles with the minimum blue-shifted by about 400 km s−1. The H lines have two main components: a narrow P Cygni profile with a minimum blue-shifted by ∼420 km s−1, and an intermediate-width Lorentzian component with a full width at half maximum velocity (vFWHM) of about 1700 km s−1. A similar line profile is also visible in the feature centred at rest wavelength ∼5890 Å. This feature is very likely Na I λλ5890, 5896 (Na ID). While the low resolution spectra show a narrow P Cygni component superposed on the broad base with a minimum blue-shifted by about 370−400 km s−1, the higher resolution of the GTC spectrum at −5.2 d reveals that this narrow P Cygni has a double-component absorption with one component centred at ∼5883 Å (rest frame), and another one centred at ∼5888 Å. These features will be discussed in detail in Sect. 4. Here, we only remark that none of the two absorptions is compatible with He I. A number of P Cygni metal lines, clearly detected in the early spectra, originate from very strong Fe II multiplets (Fig. 3, top panel). Furthermore, Ca II is also identified with the H&K doublet in absorption and the near-infrared (NIR) triplet lines, mostly as narrow emission features. The O I features at 7772−7775 Å and 8446 Å show a strong, narrow component in absorption with a minimum blue-shifted by about 400 km s−1. The presence of O I λ8446 may be the consequence of Lyβ pumping due to the Bowen fluorescence mechanism (Grandi 1980; Fransson et al. 2015), as observed in the Type IIn SN 1995G, for instance (Pastorello et al. 2002). However, the simultaneous presence of O I λλ7772, 7775 favours collisional excitation and recombination. Alternatively, the presence of these lines can be due to an abundance effect. However, while enhanced abundance of CNO in the stellar envelope would require optically thin conditions and accurate verification through synthetic spectral models and/or precise intensity line ratio measurements (in particular using the high-ionisation CNO UV lines; e.g. Fransson et al. 2005), we note that in the early spectra of SN 2018cnf, the line intensity ratio Hβ/O I λ8446 ≈40 ± 10. This is much larger than that observed for SN 1995N, another Type IIn event that showed strong evidence of CNO-burning products (Fransson et al. 2002), which is in line with expectations for nearly solar metallicity.
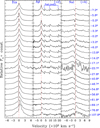 |
Fig. 2. Evolution of profiles of Hα (left), Hβ plus Fe II multiplet 42 region (centre), and Na I doublet plus He I λ5876 (right) in best-quality spectra of SN 2018cnf. The red dashed lines mark the zero velocity, corresponding to the rest wavelength of the transition. |
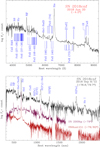 |
Fig. 3. Top: line identification in pre-maximum spectrum of SN 2018cnf. A forest of Fe II lines determines the excess of flux at wavelengths shorter than 5400 Å. Bottom: line identification in the optical plus near-infrared spectra of SN 2018cnf obtained about 80 days after maximum. For comparison, also optical plus near-IR spectra of SN 2009ip and SNHunt151 obtained at a similar phase are shown. |
In the following spectra, two to three weeks after maximum, the continuum becomes slightly redder and deviates from a blackbody shape. It rather resembles the blue pseudo-continuum produced by blends of Fe II lines, as observed in a number of ejecta-CSM interacting SNe (Smith et al. 2009). These spectra show broader features becoming stronger with time. In particular, the broad 5 890Å feature now has a Gaussian profile, with vFWHM ≈ 5350 km s−1 at phase ∼15 d, and increases to 5850 km s−1 at about one month after luminosity peak. We also see a broad He I λ7065 line, vFWHM = 5620 km s−1, that does not show a narrow P Cygni component superposed to it. For this reason, the broad 5890 Å feature at this phase is likely a blend of Na ID with He I λ5876. The Balmer lines are still dominated by a narrow to intermediate-width emission3 centred at the rest wavelength of the transition; a narrow absorption component is still detectable. However, a much broader component with the peak slightly shifted towards redder wavelengths becomes stronger with time.
The GTC spectrum obtained at phase +40.8 d from maximum still shows a broad component for the 5890 Å feature with vFWHM = 5380 km s−1. Superposed to it, we still see a narrow P Cygni feature with the strong minimum centred at ∼5883 Å and the much weaker redder absorption shoulder centred at ∼5888 Å. The moderate resolution of this spectrum reveals a more complex profile for the Hα line. In fact, we resolve a narrow P Cygni component (vmin = 450 km s−1 and vFWHM = 350 km s−1), an intermediate-width emission with vFWHM = 1850 km s−1, and a broad component centred at 6572 Å with vFWHM = 7800 km s−1. The latter component is very likely a direct signature of fast-expanding SN ejecta.
In our spectra obtained from about two months past-maximum, Hα shows a narrow Gaussian emission (vFWHM ≈ 700−800 km s−1, with a residual P Cygni absorption) superposed on a broader (vFWHM ≈ 5900 km s−1) Gaussian component. The flux contribution of the intermediate-width component is about one order of magnitude larger than that of the narrow component. While a narrow P Cygni profile is still clearly visible in the 5890 Å feature; this is possibly a blend of He I λ5876, but is primarily due to Na ID. Furthermore, a much broader base is well fitted by a single Gaussian profile with vFWHM ≈ 6600 km s−1, which decreases to about 5400 km s−1 one month later. The velocity of the broad component is consistent with that inferred from the He I λ7065 line. We also note that a broad emission component is now revealed below the narrow Ca II NIR triplet, and that both narrow and broad [Ca II] λλ7291, 7324 are now identified in these spectra.
In the latest available spectra, phases +76.8 and +107.8 d, Hα can be fitted with two Gaussian components in emission as the absorption component has almost disappeared. The narrow emission is still quite strong at vFWHM ≈ 700−800 km s−1, while the broad component has FWHM that decreases from vFWHM ∼ 4800 to ∼4500 km s−1 in the two epochs.
Line identification has been performed in our optical and NIR spectra obtained at around 80 days after the peak (see Fig. 3, bottom). At that phase, along with the optical lines described above, we identified a few H lines of the Paschen series in the NIR spectrum, as well as the following two prominent He I features: λ10830 (blended with H Pγ), and λ20581 (with vFWHM ≈ 5450 km s−1), consistent with being due to fast-expanding, He-rich SN ejecta. The relatively broad wings of the Paschen lines seem to be best reproduced with a lower-velocity (≈3500 km s−1) Lorentzian profile, which is in agreement with what is observed in the optical spectra. Past-maximum (approximately +80 d) optical and NIR spectra of two comparison objects, SN 2009ip (Fraser et al. 2013b) and SNHunt151 (Elias-Rosa et al. 2018), are also shown; both objects show major pre-SN photometric variability signatures (see Sect. 5). Their spectra at that phase are quite different from those of SN 2018cnf, both in terms of spectral continuum and line profiles. This suggests line-of-view effects in an asymmetric gas distribution or some heterogeneity in the CSM geometry and density profile for this SN type. Thus, there are different mass-loss histories and, most likely, progenitor parameters.
4. High-resolution spectroscopy
We obtained a high resolution spectrum at the Very Large Telescope (VLT-UT2) with UVES, at phase =−5.0 d. The narrow absorption components of the Na ID doublet visible in the UVES spectrum were used to precisely estimate the redshift at the SN location. Individual spectral regions are shown in Fig. 4. The blue wavelengths (top left panel) are dominated by a forest of P Cygni lines of Fe II (from multiplets 26, 27, 28, 37, 38). The velocity, as measured from the minimum of several Fe II features, is vFe = 210 ± 5 km s−1. It is interesting to note that the Balmer lines and Ca II H&K are also prominent, the latter with an average velocity vCa = 270 ± 6 km s−1. However, the red part of Hβ is not covered by the blue arm. Additionally, Sr II (multiplets 1 and 3) lines are tentatively identified with velocity vSr = 185 ± 8 km s−1.
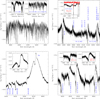 |
Fig. 4. High resolution UVES spectrum at −5 d. Top left: blue region (3700−4670 Å) dominated by Fe II lines. The insets show blow-ups of the Ca II H&K region (centred at λ3933.66) and the Fe II (multiplets 37 and 38; centred on the λ4534.17 line). Top right: region between 5840 Å and 6270 Å with Na ID and Fe II lines (multiplets 46 and 74). The inset shows the narrow Na ID interstellar doublet centred on the λ5889.95 line; the upper red line is the Milky Way component; the lower black line one is the host galaxy ones). Bottom left: Hα region, including also some Fe II lines. The blow-up shows a detail of the narrow Hα P Cygni. Bottom right: 8420−8690 Å region with insets showing a detail of O I λ8446.46 (left) and Ca II λ8662.14. |
As mentioned in Sect. 3, Na ID has a rather complex profile. The resolution of the UVES spectrum (top right panel in Fig. 4) is sufficient to allow us to resolve the different line components. In particular, the two broad absorptions visible in the inset are the two deblended Na I lines intrinsic to the transient and the velocity, which is inferred from the wavelength of the minimun, is vNa = 207 ± 7 km s−1, consistent with that obtained for the Fe II lines. We also note that the blue wing of the absorption dip extends up to about 500 km s−1. The inset also shows the narrow Na ID components due to interstellar medium inside LEDA 196096 (black line), as well as that visible in the spectrum at z = 0 due to the Milky Way (MW; red line). The equivalent width (EW) of the Na I λ5889.95 and λ5895.92 host components are 0.37 and 0.34 Å, respectively. In the same way, we measured the EW of the two Galactic components and obtained 0.24 and 0.18 Å, respectively. The latter are on average over a factor 1.7 smaller than those of the host galaxy. As the Galactic reddening is E(B − V)MW = 0.038 mag (Schlafly & Finkbeiner 2011), we obtained a host galaxy contribution of E(B − V)hg = 0.065 mag. Another approach for estimating the host galaxy reddening is through the empirical relations between the EW of individual Na I host galaxy lines and E(B − V) from Poznanski et al. (2012, see their Eqs. (1)–(3)). These provide a slightly higher mean reddening, E(B − V)hg = 0.098 mag. The average of the two methods mentioned above gives Ehg(B − V) = 0.082 mag, hence the total line-of-sight extinction towards SN 2018cnf is Etot(B − V) = 0.12 ± 0.03 mag.
The bottom left panel of Fig. 4 shows the two-component profile of Hα with the narrow P Cygni features sitting on a broad Lorentzian base with vFWHM = 1570 ± 80 km s−1. The narrow Hα absorption has two dips, one centred at −220 km s−1, and the second at −330 km s−1 with a blue wing extending to ∼500 km s−1. A similar double absorption was first seen in the Type IIn SN 2005gj (Trundle et al. 2008).
The bottom right panel shows the 8400−8700 Å region, including O I λ8446.46 and the NIR Ca II triplet. For both of these species, just as for Hα and the Na ID, we find a minimum blue-shifted by 200−220 km s−1, and a more structured broader absorption with wings extending to about 500 km s−1. The inspection of the UVES spectrum suggests a pre-SN outflow of gas in expansion towards the observer with a core velocity of 330 km s−1, with a high velocity tail at 500 km s−1, plus a circum-stellar shell expanding at lower velocity (200−220 km s−1). The SN ejecta likely interact with the faster (330−500 km s−1) inner CSM, producing the broader Lorentzian component in emission.
5. Photometric evolution
As the SN was classified about one week before maximum light, we missed the very early SN evolution. The multi-filter photometric campaign was triggered soon after the SN classification. To improve the early-time coverage, we used the information available from the ASAS-SN and ATLAS surveys. Accounting that the earliest detection of the SN from ASAS-SN, which is dated 2018 June 14 (MJD = 58 283.34), the closest but not stringent ASAS-SN pre-SN limit (g > 17.8 mag) is dated 2018 June 5 (MJD = 58 274.08), and a relatively deep detection limit (ATLAS-orange > 19.67 mag) was obtained on 2018 May 28 (MJD = 58 266.61). We tentatively assume that SN 2018cnf exploded on MJD = 58 275.0 ± 8.4 (i.e. the middle epoch between the deep non-detection on May 28, and the earliest SN detection).
The SN photometric measurements were carried out using the SNOoPY pipeline4, that allowed us to perform the simultaneous PSF-fitting photometry on the SN and a number of stellar sources of the field. The data in the SDSS bands were then calibrated using the Sloan catalogue, while B and V photometric data were calibrated using a catalogue of SDSS reference stars and then converted to Johnson-Bessell using the transformation relations of Chronis & Gaskell (2008). Furthermore, NIR photometry was calibrated with reference to the 2MASS catalogue.
The calibrated photometry of SN 2018cnf in the Johnson-Bessell B and V bands (Vega system), the Sloan u, g, r, i, z, and Pan-STARRS y (AB system) bands is reported in the Appendix (Table A.1), while the NIR (JHK) data are in Table 2. The final optical and NIR light curves are shown in Fig. 5.
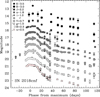 |
Fig. 5. Optical and NIR light curves of SN 2018cnf. |
Near-infrared JHK (Vega mag) photometry of SN 2018cnf.
The object was monitored for only a few days before maximum, which was reached on MJD = 58 293.4 ± 5.7 in the V band. After maximum, the light curves start their declines. The early decline (from two to four weeks after maximum) is relatively fast, although non-monotonic behaviour is observed with a shoulder detected at 20−30 days past maximum in all bands, but not in the Sloan-u band. Fluctuations in the post-peak light curve were observed in SN 2009ip (Martin et al. 2015). They are consistent with the erratic variability displayed during the pre-SN phase, indicating a rather complex CSM density profile. In this specific case, this is possibly due to the collision of SN ejecta with higher-density CSM (see Sect. 6) expelled in a short-duration, previous mass-loss event. From about +40 d, the SN declines more slowly, with an average decline time of over 2 mag (100 d)−1 in the bluest bands, while the red optical bands have a slower decline rate of about 1.6 mag (100 d)−1. The r-band light curve, in particular, has a sort of two-phases late-time decline: from 40 to 70 days the decline rate is 1.1 ± 0.1 mag (100 d)−1, and increases to 2.1 ± 0.1 mag (100 d)−1 from 70 to 120 days after the V-band maximum. The particular behaviour of the r-band light curve is probably due to dominant contribution of the Hα emission whose flux declines quite slowly until day 70. It is interesting to note that the Hα flux weakens faster at very late phases (Sect. 3).
We have also collected a number of observations in the NIR bands, and the general light curve trend is similar to those observed in the optical bands with an initially fast post-peak decline, which is then followed by a slower photometric decline at phases later than about 40 days. Unfortunately, NIR observations are not available from about 20 to 40 d, hence we cannot detect post-peak light-curve fluctuations as observed in the optical bands.
In agreement with what is observed in other SNe IIn, the colour evolution of SN 2018cnf is very slow. This agrees with its modest spectral energy distribution (SED; see Sect. 7) evolution. In particular, the V − K colour shows a slow, almost linear increase from about 0.9 mag soon after the V band maximum to about 1.5 mag three months later. This, and a lack of evidence for a blue-shift of the spectral emission lines argue against any dust formation in the early months of the SN evolution. The B − V colour evolution is interesting since it rises from 0.2 to 0.5 mag during the first ∼3−4 weeks after maximum, but then it becomes slightly bluer (B − V ≈ 0.15 mag) at about 40 days after peak. We note that this blueward trend is observed at roughly the same epoch as the post-peak light curve shoulder. All of this is consistent with an enhanced ejecta-CSM interaction event, as suggested above. After the local minimum, the B − V colour rises again, reaching 0.5 mag at 108 d.
6. Pre-explosion variability
We have conducted an in-depth analysis of pre-SN PS1 images following the brightening detection of a stellar source at the position of SN 2018cnf in December 2015 (Prentice et al. 2018, and Fig. 6, bottom left panel). We inspected a number of PS1 images taken with different filters between August 2009 and September 2017. Along with more classical griz images, the SN field was also observed in the Pan-STARRS y and the broad w bands. Images obtained from 2009 to mid-2011 showed no source at the position of SN 2018cnf. This was also confirmed by combining the best seeing images of that period to construct a deep 2009 to mid-2011 stack frame, which revealed no source at the SN location down to a limiting magnitude r ∼ 22.1 mag. We thus used the Sloan Digital Sky Survey images obtained on 2009 September 16 as templates to remove the host galaxy contamination from the u, g, r, i, z PS1 images at later epochs (from July 2011 to September 2017). Also, pre-SN photometry was obtained with SNOoPY, using the PSF-fitting technique on the template-subtracted PS1 images, and the magnitudes were calibrated using reference stars of the Sloan catalogue. Since good quality templates were not available for PS1 y− and w-band images, we performed PSF-fitting photometry on those images without subtracting the host galaxy contamination. Furthermore, Pan-STARRS w magnitudes were converted to Sloan-r applying a zero-point shift calculated using reference stars from the Sloan catalogue. This did not account for any colour correction and y-band magnitudes were obtained applying zero point values computed using reference stars of the Pan-STARRS catalogue.
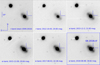 |
Fig. 6. PS1 images of location of SN 2018cnf in Pan-STARRS r and w filters. Top left panel: stacked image (limiting magnitude r > 22.1 mag) obtained by combining several r-band images obtained in 2009−2010 when no sources were visible at the position of SN 2018cnf. Other panels show single-epoch images obtained in October 2012 (top centre), November 2015 (top right), December 2015 (at the time of the brightest outburst; bottom left), August 2017 (bottom centre), and August 2018 (when the SN had already exploded; bottom right). We note the remarkable variability of the progenitor star started at least about six years before the explosion of SN 2018cnf. |
The earliest marginal detections of a SN precursor were in July and September 2011, although the first robust evidence of a source at the SN position was in October 2012 (see, Fig. 6), at r ∼ 20.8−20.9 mag, and r − i ≈ 0.3 mag. We detected the source again in June to July 2013 at z ≈ 20.7 mag, and in October 2013 at i ≈ 21.5 mag. A new brightening was detected in September 2014, reaching i = 20.44 mag, then the luminosity of the source settled to r ∼ 22 mag and i ∼ 21 mag for one year. From late November to late December 2015 (hence over 900 d before the SN light curve maximum) the object experienced a major brightening, reaching apparent magnitudes r = 20.64 and i = 20.23 mag. The former corresponds to a peak absolute magnitude Mr = −14.66 ± 0.17 mag. This value is rather similar to those observed in other SN impostors (e.g. Van Dyk et al. 2000; Pastorello et al. 2010; Smith et al. 2010, 2011; Tartaglia et al. 2015, 2016a, and Fig. 6, bottom left panel).
Later, from October 2016 to January 2017 (from about 500 to 600 d before the V-band peak) the source became fainter with i > 21 mag. Our latest pre-SN detections showed the progenitor star being even fainter at i = 21.8 mag in July 2017 (phase approximately one year before maximum), and r possibly varying from ≈22.3 to 22 mag from August to September 2017 (about 9 months before the SN light curve maximum). Then, the field became unobservable because of the seasonal gap. It was re-observed only on 2018 May 28 with an initial non-detection down to r > 19.7 mag, and finally the first SN detection was on 2018 June 14.
A remarkable feature in the SN light curve is the shoulder observed during the post-peak decline (see Sect. 5). Fluctuations in the post-maximum light curve decline were also detected in SN 2009ip, and were proposed to be correlated with pre-SN stellar activity (e.g. Graham et al. 2014; Martin et al. 2015). Although in SN 2018cnf signs of ejecta-CSM interaction are observed from very early phases, a clear flattening is visible between 2018 July 12 and July 22 (hence approximately on MJD = 58 311 and 58 321, respectively), with a middle point on MJD 58 316 (∼41 d after the adopted explosion epoch). This feature is possibly produced by shock-interaction of the SN ejecta with a shell expelled during a pre-SN stellar outburst. By adopting vej = 7800 km s−1 (the maximum velocity measured for the broad spectral lines) for the SN ejecta, they reached the innermost CSM layers at a distance of 2.8 × 10¹⁰ km. In assuming CSM velocities in the range between 200 and 450 km s−1 (see Sect. 4), this material was likely ejected from two to about 4.5 years before the collision, which is in agreement with the timescale of the observed pre-SN eruptive phase (see Fig. 7).
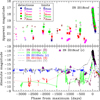 |
Fig. 7. Top: historical light curve of SN 2018cnf in u, g, r, i, z, y bands. Filled symbols represent real source detections, open symbols are detection limits. Most of the limits reported here, especially those after 2014, were computed from images obtained with relatively poor seeing conditions and/or non-ideal sky transparency. Occasionally, the number of co-added images also affected the limiting magnitude in the resulting stacked frame. The error-bars on the photometric points account for uncertainties on the PSF-fit measurements (estimated via artificial star experiments), and those on the nightly zero points and colour terms. Bottom: comparison of the r-band light curve of SN 2018cnf with those of similar type IIn SNe: SN 2013gc (Reguitti et al. 2019), SN 2009ip (Pastorello et al. 2013; Prieto et al. 2013; Fraser et al. 2013b, 2015; Margutti et al. 2014; Graham et al. 2014, 2017), SN 2016bdu (Pastorello et al. 2018), SN 2015bh (Elias-Rosa et al. 2016; Thöne et al. 2017), and SNhunt151 (Elias-Rosa et al. 2018). For SN 2018cnf, only real detections are shown. |
Our analysis on pre-SN images provided numerous detections of a faint, variable source at the SN position starting from at least six years before the SN explosion. The precursor of SN 2018cnf showed an erratic variability spanning about 2 mag (Fig. 6, top panel). This long-lasting pre-SN variability is similar to those observed before the explosion of other peculiar Type IIn SNe (Reguitti et al. 2019, and references therein), which are usually interpreted as giant eruptions of massive LBVs (e.g. Smith et al. 2010).
7. Discussion and conclusions
The long-term, pre-SN monitoring of the SN 2018cnf host galaxy reveals that the progenitor star experienced a long-lasting eruptive phase before the SN explosion. This lasted at least a few years, with the source ranging from Mr ≈ −12.8 to −14.7 mag. During the pre-SN monitoring, a few short-duration outbursts were detected with the most luminous being observed in late 2015, during which the stellar brightness increased by ∼1.2 mag in about one month. This behaviour resembles firstly the strong erratic variability we currently see for the impostor SN 2000ch in NGC 3432 (Wagner et al. 2004; Pastorello et al. 2010), and secondly one of the major brightenings observed during the pre-SN evolution of SN 2009ip (Pastorello et al. 2013) or SN 2015bh (Ofek et al. 2016; Elias-Rosa et al. 2016; Thöne et al. 2017). In both cases, the progenitors are thought to be LBVs (e.g. Smith et al. 2010; Foley et al. 2011), although the former experienced a much more dramatic evolution. In fact, SN 2009ip is the prototype of a family of transients showing a long-duration variability5 resembling the giant eruption of an LBV. However, this eruptive phase was followed by an SN-like event a short time later. This lasted a few months and showed a composite light curve formed by a first fainter peak at MR ≥ −15 mag (“Event A”, that was only marginally brighter than the peak magnitude of the former outbursts, but lasted approximately two months), and a second much brighter maximum at MR ∼ −18.5 mag (“Event B”; see Fig. 5 in Pastorello et al. 2018). The above double-peaked event is frequently interpreted as the terminal stellar core-collapse signature (Mauerhan et al. 2013; Smith et al. 2014, and references therein).
The recent evolution of SN 2018cnf closely resembles that of several SNe IIn that belong to the SN 2009ip group, although the spectral energy distribution (SED) of SN 2018cnf has a very slow evolution (Fig. 8, top panel). Unfortunately, the light curve of SN 2018cnf has not been sampled during the early rise phase to maximum, hence we possibly missed the Event A observed in other SN 2009ip-like objects. Another difference with most SN 2009ip-like transients is that the spectrum of SN 2018cnf always shows strong signatures of ejecta-CSM interaction and never undergoes a transition towards a more classical broad-lined Type II spectrum, as observed in SN 2009ip (Pastorello et al. 2013; Prieto et al. 2013; Fraser et al. 2013b, 2015; Graham et al. 2014, 2017; Margutti et al. 2014) and similar events, such as LSQ13zm (Tartaglia et al. 2016b), SN 2015bh (Ofek et al. 2016; Elias-Rosa et al. 2016; Thöne et al. 2017), Gaia16cfr (Kilpatrick et al. 2018), and SN 2016bdu (Pastorello et al. 2018). The slow spectral evolution is closely reminiscent of those of iPTF13z (Nyholm et al. 2017) and SNHunt151 (Elias-Rosa et al. 2018). The comparison of the quasi-bolometric light curves of SN 2018cnf with the above Type IIn SN sample is shown in Fig. 8 (bottom panel).
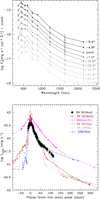 |
Fig. 8. Top: evolution of observed SED of SN 2018cnf at some representative epochs. Bottom: comparison of the quasi-bolometric light curve of SN 2018cnf with those of a sample of SN 2009ip-like transients, obtained accounting for the contribution in the optical and NIR bands. In two cases, SN 2009ip and SN 2015bh, we also considered the available UV contribution, which is relatively strong. This explains the more luminous peaks of these two objects. The phases are with respect to the maximum of the quasi-bolometric light curves. For SN 2018cnf, the peak of the quasi-bolometric light curve is on MJD = 58 294.2 ± 0.9. |
As only very massive stars are known to produce similar long-lasting eruptive phases, a connection with massive LBVs has been proposed for all of the objects mentioned above. While their progenitors were never directly detected in quiescence, repeated outbursts during which the star exceeded −14 mag were observed for most of them. The physical mechanisms that may produce long-duration giant eruptions, during which LBVs lose a large fraction of their envelope mass (up to tens of solar masses), have not been clarified yet (e.g. Humphreys & Davidson 1994). Plausible scenarios for these long-duration giant eruptions are major interactions between the massive members of a binary system (e.g. Smith & Frew 2011; Smith 2011), pulsational pair-instability (Chatzopoulos & Wheeler 2012; Woosley 2017), or a hybrid scheme of the two (see Marchant et al. 2018). While the first mechanism does not necessarily lead to an immediate terminal SN explosion, it may explain the three-decade-long eruptive phase of SN 2000ch (Pastorello et al. 2010). The second mechanism is promising as it may reproduce the sequence of events leading to SN 2009ip and its subsequent evolution (e.g. Graham et al. 2017, and references therein). Alternatively, mass loss, driven by waves generated in the convective core during the late nuclear burnings, has also been proposed for moderate-mass (MZAMS ∼ 20 M⊙) stars and for very massive stars at low-metallicity regime. This would explain the violent mass ejections observed in some SNe IIn from a decade to a few months prior to core-collapse (Quataert & Shiode 2012; Shiode & Quataert 2014).
The modern strategy of SN searches and the availability of big data archives have increased the discoveries of pre-SN outbursts, but the number of events is still of the order of a few tens, and is limited in volume. Future SN searches with big telescopes, in particular the Large Synoptic Survey Telescope (LSST Science Collaboration 2009), will enormously increase the discovery rates, and will provide us with valuable datasets of light curves with coverage of many years.
The source was also detected by the Asteroid Terrestrial-impact Last Alert System (ATLAS), labelled as ATLAS18vyq.
Obtained from the NASA-IPAC Extragalactic Database (NED), https://ned.ipac.caltech.edu
We remark that, in most spectra, a precise discrimination between the two components is limited by the modest spectral resolution.
SNOoPY is a package for SN photometry using PSF fitting and/or template subtraction developed by E. Cappellaro. A package description can be found at http://sngroup.oapd.inaf.it/snoopy.html
SN 2015bh showed significant variability lasting over two decades (Thöne et al. 2017).
Acknowledgments
We thank the anonymous referee for insightful comments that helped to improve the paper. D.A.H, C.M., and G.H. were supported by NSF grant AST-1313484. S.B., P.C., and S.D. acknowledge Project 11573003 supported by NSFC. This research uses data obtained through the Telescope Access Program (TAP), which has been funded by the National Astronomical Observatories of China, the Chinese Academy of Sciences, and the Special Fund for Astronomy from the Ministry of Finance. M.G. is supported by the Polish National Science Centre grant OPUS 2015/17/B/ST9/03167. T.W. is funded in part by European Research Council grant 320360 and by European Commission grant 730980. E.Y.H., C.A., and S.K. acknowledge the support provided by the National Science Foundation under Grant No. AST-1613472. M.F. is supported by a Royal Society – Science Foundation Ireland University Research Fellowship. M.M.P. acknowledges support from the National Science Foundation under grants AST-1008343 and AST-1613426. C.T., A.dU.P., D.A.K., and L.I. acknowledge support from the Spanish research project AYA2017-89384-P. C.T. and A.dU.P. acknowledge support from funding associated to Ramón y Cajal fellowships (RyC-2012-09984 and RyC-2012-09975). D.A.K. and L.I. acknowledge support from funding associated to Juan de la Cierva Incorporación fellowships (IJCI-2015-26153 and IJCI-2016-30940). G.P and O.R. acknowledge support by the Ministry of Economy, Development, and Tourism’s Millennium Science Initiative through grant IC120009, awarded to The Millennium Institute of Astrophysics, MAS. L.W. is sponsored, in part, by the Chinese Academy of Sciences (CAS), through a grant to the CAS South America Center for Astronomy (CASSACA) in Santiago, Chile. The NOT data were obtained through the NOT Unbiased Transient Survey (NUTS; http://csp2.lco.cl/not/), which is supported in part by the Instrument Center for Danish Astrophysics (IDA). This work is based, in part, on observations collected at the European Organisation for Astronomical Research in the Southern Hemisphere, Chile, under ESO programme 0101.D-0202, and as part of PESSTO (the Public ESO Spectroscopic Survey for Transient Objects Survey) ESO program 188.D-3003, 191.D-0935, 197.D-1075. This work also makes use of data from the Las Cumbres Observatory Network as part of the Global Supernova Project; the Nordic Optical Telescope (NOT), operated on the island of La Palma jointly by Denmark, Finland, Iceland, Norway, and Sweden, in the Spanish Observatorio del Roque de los Muchachos of the Instituto de Astrofísica de Canarias; the 1.82 m Copernico Telescope of INAF-Asiago Observatory; the Gran Telescopio Canarias (GTC), installed in the Spanish Observatorio del Roque de los Muchachos of the Instituto de Astrofísica de Canarias, in the Island of La Palma; the 6.5 m Magellan Telescopes located at Las Campanas Observatory, Chile; and the Liverpool Telescope operated on the island of La Palma by Liverpool John Moores University at the Spanish Observatorio del Roque de los Muchachos of the Instituto de Astrofísica de Canarias with financial support from the UK Science and Technology Facilities Council. It is also based in part on observations at Cerro Tololo Inter-American Observatory, National Optical Astronomy Observatory (NOAO), which is operated by the Association of Universities for Research in Astronomy (AURA), Inc. under a cooperative agreement with the National Science Foundation. ASAS-SN is supported by the Gordon and Betty Moore Foundation through grant GBMF5490 to the Ohio State University and NSF grant AST-1515927. Development of ASAS-SN has been supported by NSF grant AST-0908816, the Mt. Cuba Astronomical Foundation, the Center for Cosmology and AstroParticle Physics at the Ohio State University, the Chinese Academy of Sciences South America Center for Astronomy (CAS-SACA), the Villum Foundation, and George Skestos. The Pan-STARRS1 Surveys (PS1) have been made possible through contributions of the Institute for Astronomy, the University of Hawaii, the Pan-STARRS Project Office, the Max-Planck Society and its participating institutes, the Max Planck Institute for Astronomy, Heidelberg, and the Max Planck Institute for Extraterrestrial Physics, Garching, The Johns Hopkins University, Durham University, the University of Edinburgh, Queen’s University Belfast, the Harvard-Smithsonian Center for Astrophysics, the Las Cumbres Observatory Global Telescope Network Incorporated, the National Central University of Taiwan, STScI, NASA under Grant No. NNX08AR22G issued through the Planetary Science Division of the NASA Science Mission Directorate, the US NSF under Grant No. AST-1238877, the University of Maryland, and Eotvos Lorand University (ELTE), the Los Alamos National Laboratory, and the Gordon and Betty Moore Foundation. This research has made use of the NASA-IPAC Extragalactic Database (NED), which is operated by the Jet Propulsion Laboratory, California Institute of Technology, under contract with the National Aeronautics and Space Administration.
References
- Aretxaga, I., Benetti, S., Terlevic, R. J., et al. 1999, MNRAS, 309, 343 [NASA ADS] [CrossRef] [Google Scholar]
- Brimacombe, J., Krannich, G., Wiethoff, W., et al. 2018, ATel, 11730 [Google Scholar]
- Cardelli, J. A., Clayton, G. C., & Mathis, J. S. 1989, ApJ, 345, 245 [NASA ADS] [CrossRef] [Google Scholar]
- Chambers, K. C., Magnier, E. A., Metcalfe, N., et al. 2016, ArXiv e-prints [arXiv:1612.05560] [Google Scholar]
- Chandra, P., Chevalier, R., Irwin, C. M., et al. 2012, ApJ, 750, L2 [NASA ADS] [CrossRef] [Google Scholar]
- Chatzopoulos, E., & Wheeler, J. C. 2012, ApJ, 760, 154 [NASA ADS] [CrossRef] [Google Scholar]
- Chronis, T. S., & Gaskell, C. M. 2008, AJ, 135, 264 [NASA ADS] [CrossRef] [Google Scholar]
- De la Rosa, J., Roming, P., Pritchard, T., & Fryer, C. 2016, ApJ, 820, 74 [NASA ADS] [CrossRef] [Google Scholar]
- Dwarkadas, V. V. 2011, MNRAS, 412, 1639 [NASA ADS] [CrossRef] [Google Scholar]
- Elias-Rosa, N., Pastorello, A., Benetti, S., et al. 2016, MNRAS, 463, 3894 [NASA ADS] [CrossRef] [Google Scholar]
- Elias-Rosa, N., Benetti, S., Cappellaro, E., et al. 2018, MNRAS, 475, 2614 [NASA ADS] [CrossRef] [Google Scholar]
- Filippenko, A. V. 1997, ARA&A, 35, 309 [NASA ADS] [CrossRef] [Google Scholar]
- Foley, R. J., Berger, E., Fox, O., et al. 2011, ApJ, 732, 32 [NASA ADS] [CrossRef] [Google Scholar]
- Fox, O. D., Filippenko, A. V., Skrutskie, M. F., et al. 2013, AJ, 146, 2 [NASA ADS] [CrossRef] [Google Scholar]
- Fransson, C., Chevalier, R. A., Filippenko, A. V., et al. 2002, ApJ, 572, 350 [NASA ADS] [CrossRef] [Google Scholar]
- Fransson, C., Challis, P. M., Chevalier, R. A., et al. 2005, ApJ, 622, 991 [NASA ADS] [CrossRef] [Google Scholar]
- Fransson, C., Ergon, M., Challis, P. J., et al. 2015, ApJ, 797, 118 [Google Scholar]
- Fraser, M., Magee, M., Kotak, R., et al. 2013a, ApJ, 779, L8 [NASA ADS] [CrossRef] [Google Scholar]
- Fraser, M., Inserra, C., Jerkstrand, A., et al. 2013b, MNRAS, 433, 1312 [NASA ADS] [CrossRef] [Google Scholar]
- Fraser, M., Kotak, R., Pstorello, A., et al. 2015, MNRAS, 453, 3886 [NASA ADS] [CrossRef] [Google Scholar]
- Gal-Yam, A., & Leonard, D. C. 2009, Nature, 458, 865 [NASA ADS] [CrossRef] [PubMed] [Google Scholar]
- Graham, M. L., Sand, D. J., Valenti, S., et al. 2014, ApJ, 787, 163 [NASA ADS] [CrossRef] [Google Scholar]
- Graham, M. L., Bigley, A., Mauerhan, J. C., et al. 2017, MNRAS, 469, 1559 [NASA ADS] [CrossRef] [Google Scholar]
- Grandi, S. A. 1980, ApJ, 238, 10 [NASA ADS] [CrossRef] [Google Scholar]
- Heath, J. D., Read, M. A., Sauderst, W., et al. 2009, MNRAS, 399, 683 [NASA ADS] [CrossRef] [Google Scholar]
- Hosseinzadeh, G., Arcavi, I., Valenti, S., et al. 2017, ApJ, 836, 158 [NASA ADS] [CrossRef] [Google Scholar]
- Hsiao, E. Y., Phillips, M. M., Marion, G. H., et al. 2019, PASP, 131, 014002 [NASA ADS] [CrossRef] [Google Scholar]
- Huber, M., Chambers, K. C., Flewelling, H., et al. 2015, ATel, 7153 [Google Scholar]
- Humphreys, R. M., & Davidson, K. 1994, PASP, 106, 1025 [NASA ADS] [CrossRef] [Google Scholar]
- Kiewe, M., Gal-Yam, A., Arcavi, I., et al. 2012, ApJ, 744, 10 [NASA ADS] [CrossRef] [Google Scholar]
- Kilpatrick, C. D., Foley, R. J., Drout, M. R., et al. 2018, MNRAS, 473, 4805 [NASA ADS] [CrossRef] [Google Scholar]
- Kotak, R., & Vink, J. S. 2006, A&A, 460, L5 [NASA ADS] [CrossRef] [EDP Sciences] [Google Scholar]
- Leloudas, G., Hsiao, E. E., Johansson, J., et al. 2013, A&A, 574, A61 [Google Scholar]
- LSST Science Collaboration 2009, ArXiv e-prints [arXiv: 0912.0201] [Google Scholar]
- Marchant, P., Renzo, M., Farmer, R., et al. 2018, ArXiv e-prints [arXiv:1810.13412] [Google Scholar]
- Margutti, R., Milisavljevic, D., Soderberg, A. M., et al. 2014, ApJ, 780, 21 [NASA ADS] [CrossRef] [Google Scholar]
- Martin, J. C., Hambsch, F.-J., Margutti, R., et al. 2015, AJ, 149, 9 [NASA ADS] [CrossRef] [Google Scholar]
- Matheson, T., Filippenko, A. V., Chornock, R., Leonard, D. C., & Li, W. 2000, AJ, 119, 2303 [NASA ADS] [CrossRef] [Google Scholar]
- Mattila, S., Elias-Rosa, N., Lundqvist, P., et al. 2016, ATel, 8892 [Google Scholar]
- Mauerhan, J. C., Smith, N., Filippenko, A. V., et al. 2013, MNRAS, 430, 1801 [NASA ADS] [CrossRef] [Google Scholar]
- Moriya, T. J., Maeda, K., Taddia, F., et al. 2013, MNRAS, 435, 1520 [NASA ADS] [CrossRef] [Google Scholar]
- Mould, J. R., Huchra, J. P., Freedman, W. L., et al. 2000, ApJ, 529, 786 [NASA ADS] [CrossRef] [Google Scholar]
- Nyholm, A., Sollerman, J., Taddia, F., et al. 2017, A&A, 605, A6 [NASA ADS] [CrossRef] [EDP Sciences] [Google Scholar]
- Ofek, E. O., Sullivan, M., Cenko, S. B., et al. 2013, Nature, 494, 65 [NASA ADS] [CrossRef] [Google Scholar]
- Ofek, E. O., Sullivan, M., Shaviv, N. J., et al. 2014, ApJ, 789, 104 [NASA ADS] [CrossRef] [Google Scholar]
- Ofek, E. O., Cenko, S. B., Shaviv, N. J., et al. 2016, ApJ, 824, 6 [NASA ADS] [CrossRef] [Google Scholar]
- Pastorello, A., Turatto, M., Benetti, S., et al. 2002, MNRAS, 333, 27 [NASA ADS] [CrossRef] [Google Scholar]
- Pastorello, A., Smartt, S. J., Mattila, S., et al. 2007, Nature, 447, 829 [NASA ADS] [CrossRef] [PubMed] [Google Scholar]
- Pastorello, A., Mattila, S., Zampieri, L., et al. 2008a, MNRAS, 389, 113 [NASA ADS] [CrossRef] [Google Scholar]
- Pastorello, A., Quimby, R. M., Smartt, S. J., et al. 2008b, MNRAS, 389, 131 [NASA ADS] [CrossRef] [Google Scholar]
- Pastorello, A., Botticella, M. T., Trundle, C., et al. 2010, MNRAS, 408, 181 [NASA ADS] [CrossRef] [Google Scholar]
- Pastorello, A., Cappellaro, E., Inserra, C., et al. 2013, ApJ, 767, 1 [NASA ADS] [CrossRef] [Google Scholar]
- Pastorello, A., Benetti, S., Brown, P. J., et al. 2015, MNRAS, 449, 1921 [NASA ADS] [CrossRef] [Google Scholar]
- Pastorello, A., Wang, X.-F., Ciabattari, F., et al. 2016, MNRAS, 456, 853 [NASA ADS] [CrossRef] [Google Scholar]
- Pastorello, A., Kochanek, C. S., Fraser, M., et al. 2018, MNRAS, 474, 197 [NASA ADS] [CrossRef] [Google Scholar]
- Poznanski, D., Prochaska, J. X., Bloom, J. S., et al. 2012, MNRAS, 426, 1465 [NASA ADS] [CrossRef] [Google Scholar]
- Prentice, S. J., Maguire, K., Pastorello, A., et al. 2018, ATel, 11726 [Google Scholar]
- Prieto, J. L., Brimacombe, J., Drake, A. J., & Howerton, S. 2013, ApJ, 763, L27 [NASA ADS] [CrossRef] [Google Scholar]
- Quataert, E., & Shiode, J. H. 2012, MNRAS, 423, L92 [NASA ADS] [CrossRef] [Google Scholar]
- Reguitti, A., Pastorello, A., Pignata, G., et al. 2019, MNRAS, 482, 2750 [NASA ADS] [Google Scholar]
- Schlafly, E. F., & Finkbeiner, D. P. 2011, ApJ, 737, 103 [NASA ADS] [CrossRef] [Google Scholar]
- Schlegel, E. M. 1990, MNRAS, 244, 269 [NASA ADS] [Google Scholar]
- Shappee, B. J., Prieto, J. L., Grupe, D., et al. 2014, ApJ, 788, 48 [NASA ADS] [CrossRef] [Google Scholar]
- Shiode, J. H., & Quataert, E. 2014, ApJ, 780, 96 [NASA ADS] [CrossRef] [Google Scholar]
- Smartt, S. J. 2009, ARA&A, 47, 63 [NASA ADS] [CrossRef] [Google Scholar]
- Smartt, S. J., Valenti, S., Fraser, M., et al. 2015, A&A, 579, A40 [NASA ADS] [CrossRef] [EDP Sciences] [Google Scholar]
- Smith, N. 2011, MNRAS, 415, 2020 [NASA ADS] [CrossRef] [Google Scholar]
- Smith, N. 2017, Handbook of Supernovae (Springer International Publishing AG), 403 [CrossRef] [Google Scholar]
- Smith, N., & Frew, D. J. 2011, MNRAS, 415, 2009 [NASA ADS] [CrossRef] [Google Scholar]
- Smith, N., Silverman, J. M., Chornock, R., et al. 2009, ApJ, 695, 1334 [NASA ADS] [CrossRef] [Google Scholar]
- Smith, N., Miller, A., Li, W., et al. 2010, AJ, 139, 1451 [NASA ADS] [CrossRef] [Google Scholar]
- Smith, N., Li, W., Silverman, J. M., et al. 2011, MNRAS, 415, 773 [NASA ADS] [CrossRef] [Google Scholar]
- Smith, N., Mauerhan, J. C., Silverman, J. M., et al. 2012, MNRAS, 426, 1905 [NASA ADS] [CrossRef] [Google Scholar]
- Smith, N., Mauerhan, J. C., & Prieto, J. L. 2014, MNRAS, 438, 1191 [NASA ADS] [CrossRef] [Google Scholar]
- Smith, N., Kilpatrick, C. D., Mauerhan, J. C., et al. 2017, MNRAS, 466, 3021 [NASA ADS] [CrossRef] [Google Scholar]
- Stritzinger, M., Taddia, F., Fransson, C., et al. 2012, ApJ, 756, 173 [NASA ADS] [CrossRef] [Google Scholar]
- Taddia, F., Stritzinger, M. D., Sollerman, J., et al. 2013, A&A, 555, A10 [NASA ADS] [CrossRef] [EDP Sciences] [Google Scholar]
- Tartaglia, L., Pastorello, A., Taubenberger, S., et al. 2015, MNRAS, 447, 117 [NASA ADS] [CrossRef] [Google Scholar]
- Tartaglia, L., Elias-Rosa, N., Pastorello, A., et al. 2016a, ApJ, 823, L23 [NASA ADS] [CrossRef] [Google Scholar]
- Tartaglia, L., Pastorello, A., Sullivan, M., et al. 2016b, MNRAS, 459, 1039 [NASA ADS] [CrossRef] [Google Scholar]
- Thöne, C. C., de Ugarte Postigo, A., Leloudas, G., et al. 2017, A&A, 599, A129 [NASA ADS] [CrossRef] [EDP Sciences] [Google Scholar]
- Tonry, J. L. 2011, PASP, 123, 899 [Google Scholar]
- Tonry, J. L., Denneau, L., Heinze, A. N., et al. 2018, PASP, 130, 988 [Google Scholar]
- Trundle, C., Kotak, R., Vink, J. S., & Meikle, W. P. S. 2008, A&A, 483, L47 [NASA ADS] [CrossRef] [EDP Sciences] [Google Scholar]
- Van Dyk, S. D., Peng, C. Y., King, J. Y., et al. 2000, PASP, 112, 1532 [NASA ADS] [CrossRef] [Google Scholar]
- Wagner, R. M., Vrba, F. J., Henden, A. A., et al. 2004, PASP, 116, 326 [NASA ADS] [CrossRef] [Google Scholar]
- Woosley, S. E. 2017, ApJ, 836, 244 [NASA ADS] [CrossRef] [Google Scholar]
Appendix A: Optical photometry of SN 2018cnf
Optical photometry of SN 2018cnf: Johnson-Bessell B, V (Vega mag), Sloan u, g, r, i, z and PanSTARRS y (AB mag).
All Tables
Optical photometry of SN 2018cnf: Johnson-Bessell B, V (Vega mag), Sloan u, g, r, i, z and PanSTARRS y (AB mag).
All Figures
|
Fig. 1. Spectral evolution of SN 2018cnf, spanning approximately 115 day period, from one week before peak to over 100 days after maximum. The phases are from the V-band maximum. Only spectra with good signal to noise are shown. |
| In the text | |
|
Fig. 2. Evolution of profiles of Hα (left), Hβ plus Fe II multiplet 42 region (centre), and Na I doublet plus He I λ5876 (right) in best-quality spectra of SN 2018cnf. The red dashed lines mark the zero velocity, corresponding to the rest wavelength of the transition. |
| In the text | |
|
Fig. 3. Top: line identification in pre-maximum spectrum of SN 2018cnf. A forest of Fe II lines determines the excess of flux at wavelengths shorter than 5400 Å. Bottom: line identification in the optical plus near-infrared spectra of SN 2018cnf obtained about 80 days after maximum. For comparison, also optical plus near-IR spectra of SN 2009ip and SNHunt151 obtained at a similar phase are shown. |
| In the text | |
|
Fig. 4. High resolution UVES spectrum at −5 d. Top left: blue region (3700−4670 Å) dominated by Fe II lines. The insets show blow-ups of the Ca II H&K region (centred at λ3933.66) and the Fe II (multiplets 37 and 38; centred on the λ4534.17 line). Top right: region between 5840 Å and 6270 Å with Na ID and Fe II lines (multiplets 46 and 74). The inset shows the narrow Na ID interstellar doublet centred on the λ5889.95 line; the upper red line is the Milky Way component; the lower black line one is the host galaxy ones). Bottom left: Hα region, including also some Fe II lines. The blow-up shows a detail of the narrow Hα P Cygni. Bottom right: 8420−8690 Å region with insets showing a detail of O I λ8446.46 (left) and Ca II λ8662.14. |
| In the text | |
|
Fig. 5. Optical and NIR light curves of SN 2018cnf. |
| In the text | |
|
Fig. 6. PS1 images of location of SN 2018cnf in Pan-STARRS r and w filters. Top left panel: stacked image (limiting magnitude r > 22.1 mag) obtained by combining several r-band images obtained in 2009−2010 when no sources were visible at the position of SN 2018cnf. Other panels show single-epoch images obtained in October 2012 (top centre), November 2015 (top right), December 2015 (at the time of the brightest outburst; bottom left), August 2017 (bottom centre), and August 2018 (when the SN had already exploded; bottom right). We note the remarkable variability of the progenitor star started at least about six years before the explosion of SN 2018cnf. |
| In the text | |
|
Fig. 7. Top: historical light curve of SN 2018cnf in u, g, r, i, z, y bands. Filled symbols represent real source detections, open symbols are detection limits. Most of the limits reported here, especially those after 2014, were computed from images obtained with relatively poor seeing conditions and/or non-ideal sky transparency. Occasionally, the number of co-added images also affected the limiting magnitude in the resulting stacked frame. The error-bars on the photometric points account for uncertainties on the PSF-fit measurements (estimated via artificial star experiments), and those on the nightly zero points and colour terms. Bottom: comparison of the r-band light curve of SN 2018cnf with those of similar type IIn SNe: SN 2013gc (Reguitti et al. 2019), SN 2009ip (Pastorello et al. 2013; Prieto et al. 2013; Fraser et al. 2013b, 2015; Margutti et al. 2014; Graham et al. 2014, 2017), SN 2016bdu (Pastorello et al. 2018), SN 2015bh (Elias-Rosa et al. 2016; Thöne et al. 2017), and SNhunt151 (Elias-Rosa et al. 2018). For SN 2018cnf, only real detections are shown. |
| In the text | |
|
Fig. 8. Top: evolution of observed SED of SN 2018cnf at some representative epochs. Bottom: comparison of the quasi-bolometric light curve of SN 2018cnf with those of a sample of SN 2009ip-like transients, obtained accounting for the contribution in the optical and NIR bands. In two cases, SN 2009ip and SN 2015bh, we also considered the available UV contribution, which is relatively strong. This explains the more luminous peaks of these two objects. The phases are with respect to the maximum of the quasi-bolometric light curves. For SN 2018cnf, the peak of the quasi-bolometric light curve is on MJD = 58 294.2 ± 0.9. |
| In the text | |
Current usage metrics show cumulative count of Article Views (full-text article views including HTML views, PDF and ePub downloads, according to the available data) and Abstracts Views on Vision4Press platform.
Data correspond to usage on the plateform after 2015. The current usage metrics is available 48-96 hours after online publication and is updated daily on week days.
Initial download of the metrics may take a while.