Fig. 8.
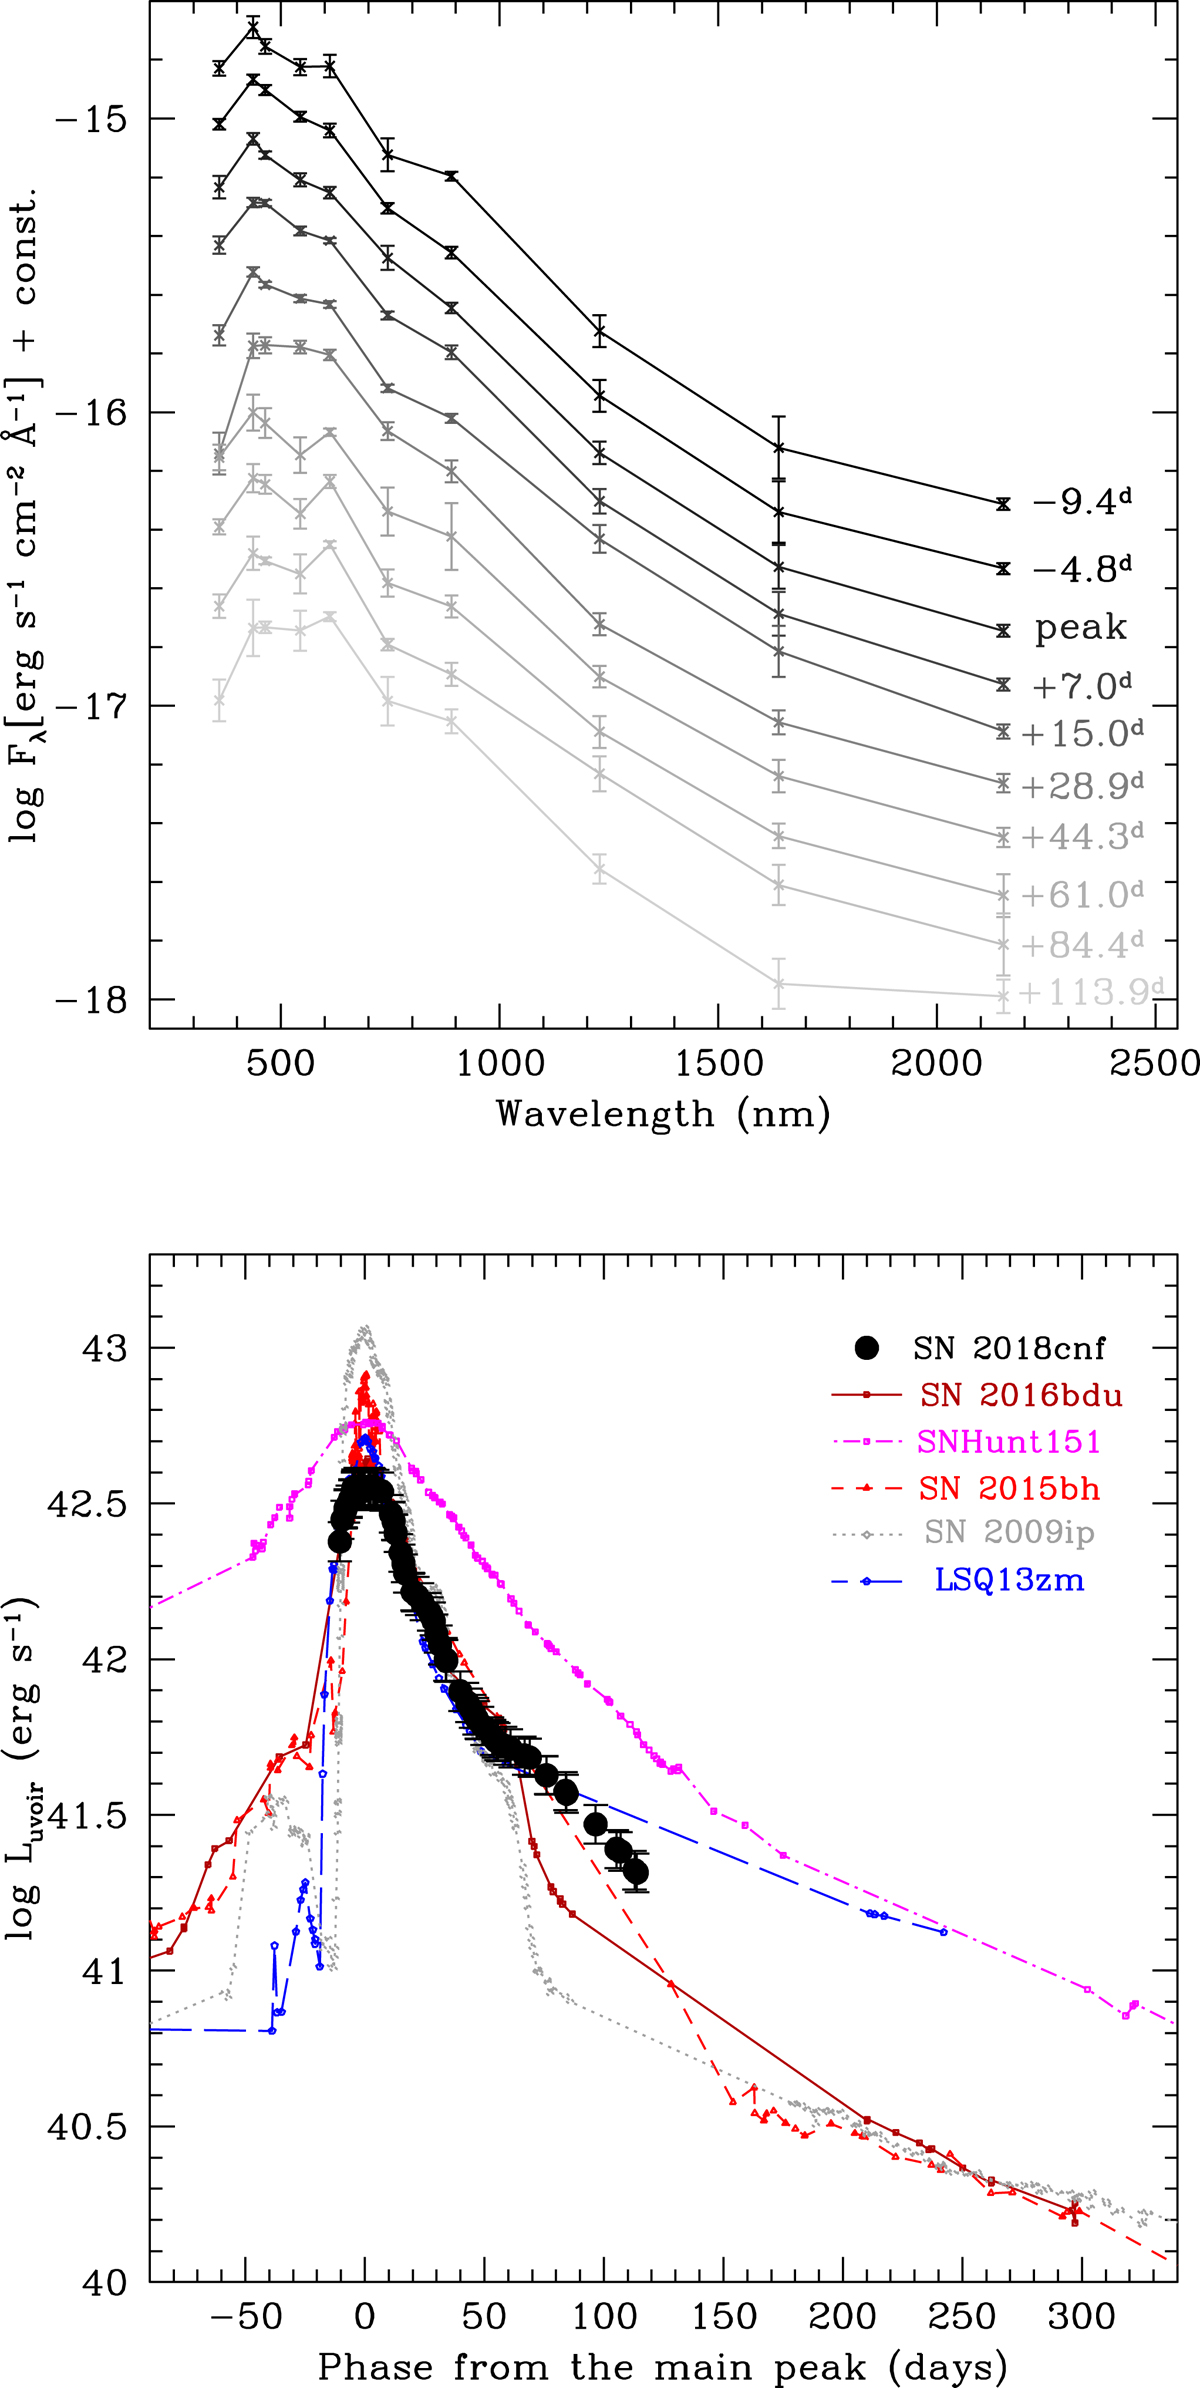
Top: evolution of observed SED of SN 2018cnf at some representative epochs. Bottom: comparison of the quasi-bolometric light curve of SN 2018cnf with those of a sample of SN 2009ip-like transients, obtained accounting for the contribution in the optical and NIR bands. In two cases, SN 2009ip and SN 2015bh, we also considered the available UV contribution, which is relatively strong. This explains the more luminous peaks of these two objects. The phases are with respect to the maximum of the quasi-bolometric light curves. For SN 2018cnf, the peak of the quasi-bolometric light curve is on MJD = 58 294.2 ± 0.9.
Current usage metrics show cumulative count of Article Views (full-text article views including HTML views, PDF and ePub downloads, according to the available data) and Abstracts Views on Vision4Press platform.
Data correspond to usage on the plateform after 2015. The current usage metrics is available 48-96 hours after online publication and is updated daily on week days.
Initial download of the metrics may take a while.