Fig. 7.
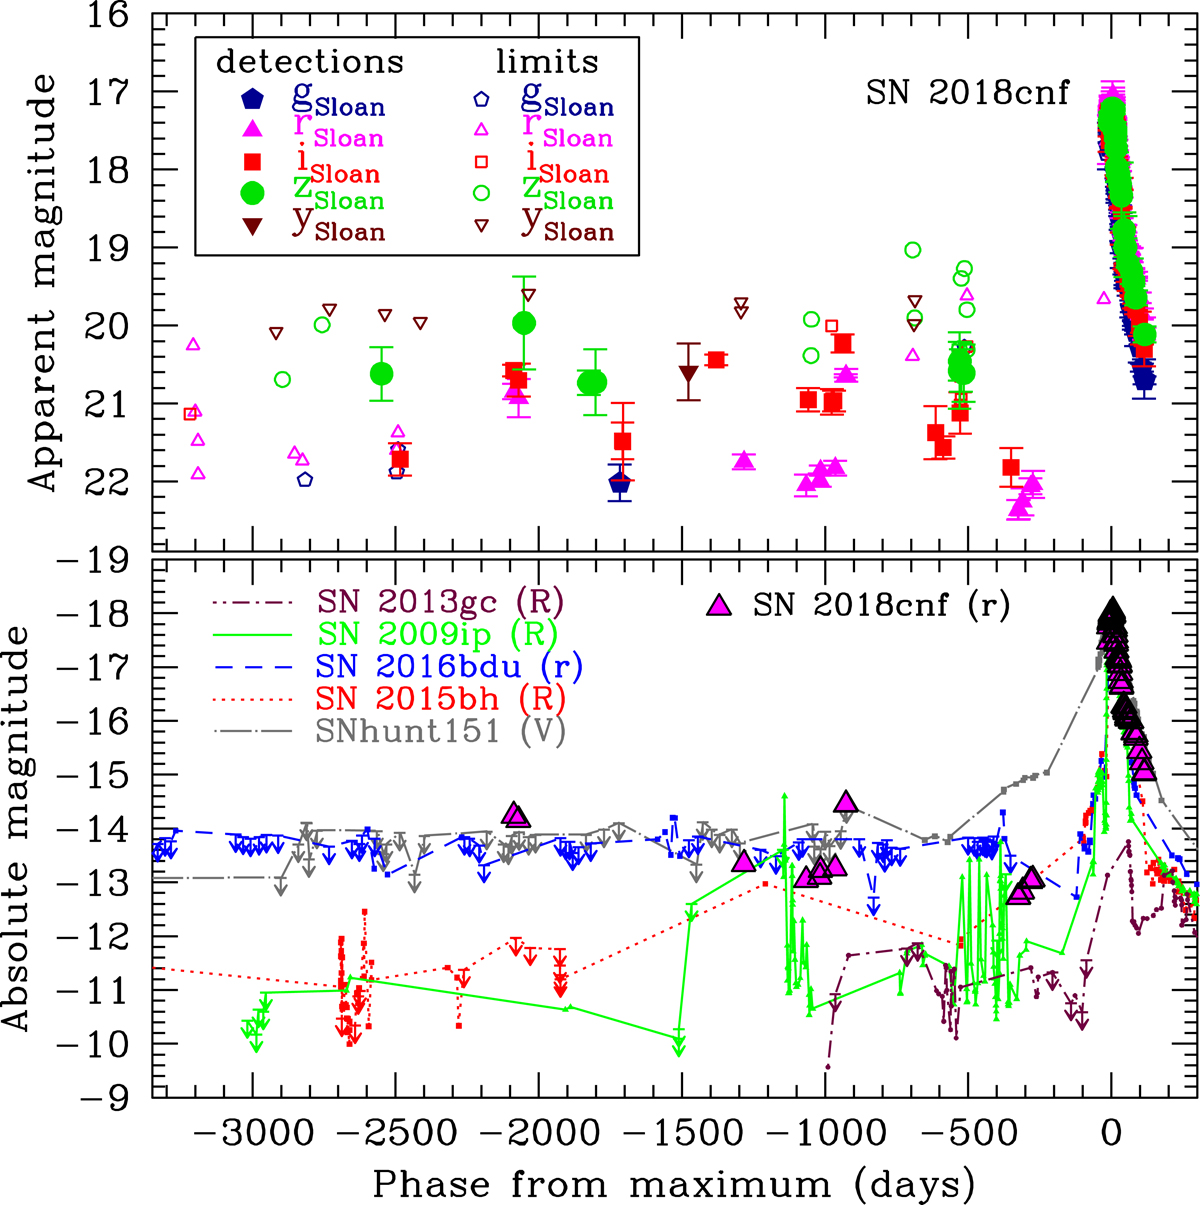
Top: historical light curve of SN 2018cnf in u, g, r, i, z, y bands. Filled symbols represent real source detections, open symbols are detection limits. Most of the limits reported here, especially those after 2014, were computed from images obtained with relatively poor seeing conditions and/or non-ideal sky transparency. Occasionally, the number of co-added images also affected the limiting magnitude in the resulting stacked frame. The error-bars on the photometric points account for uncertainties on the PSF-fit measurements (estimated via artificial star experiments), and those on the nightly zero points and colour terms. Bottom: comparison of the r-band light curve of SN 2018cnf with those of similar type IIn SNe: SN 2013gc (Reguitti et al. 2019), SN 2009ip (Pastorello et al. 2013; Prieto et al. 2013; Fraser et al. 2013b, 2015; Margutti et al. 2014; Graham et al. 2014, 2017), SN 2016bdu (Pastorello et al. 2018), SN 2015bh (Elias-Rosa et al. 2016; Thöne et al. 2017), and SNhunt151 (Elias-Rosa et al. 2018). For SN 2018cnf, only real detections are shown.
Current usage metrics show cumulative count of Article Views (full-text article views including HTML views, PDF and ePub downloads, according to the available data) and Abstracts Views on Vision4Press platform.
Data correspond to usage on the plateform after 2015. The current usage metrics is available 48-96 hours after online publication and is updated daily on week days.
Initial download of the metrics may take a while.