Fig. 6.
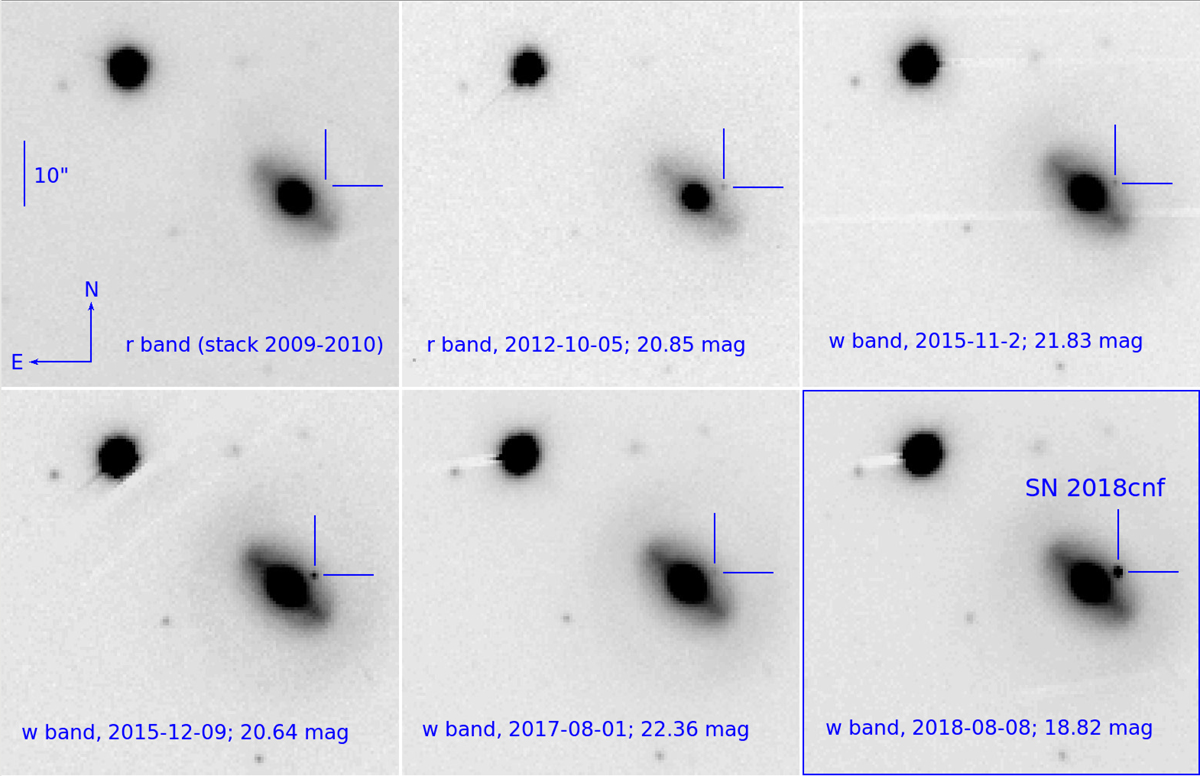
PS1 images of location of SN 2018cnf in Pan-STARRS r and w filters. Top left panel: stacked image (limiting magnitude r > 22.1 mag) obtained by combining several r-band images obtained in 2009−2010 when no sources were visible at the position of SN 2018cnf. Other panels show single-epoch images obtained in October 2012 (top centre), November 2015 (top right), December 2015 (at the time of the brightest outburst; bottom left), August 2017 (bottom centre), and August 2018 (when the SN had already exploded; bottom right). We note the remarkable variability of the progenitor star started at least about six years before the explosion of SN 2018cnf.
Current usage metrics show cumulative count of Article Views (full-text article views including HTML views, PDF and ePub downloads, according to the available data) and Abstracts Views on Vision4Press platform.
Data correspond to usage on the plateform after 2015. The current usage metrics is available 48-96 hours after online publication and is updated daily on week days.
Initial download of the metrics may take a while.