Free Access
Fig. 1.
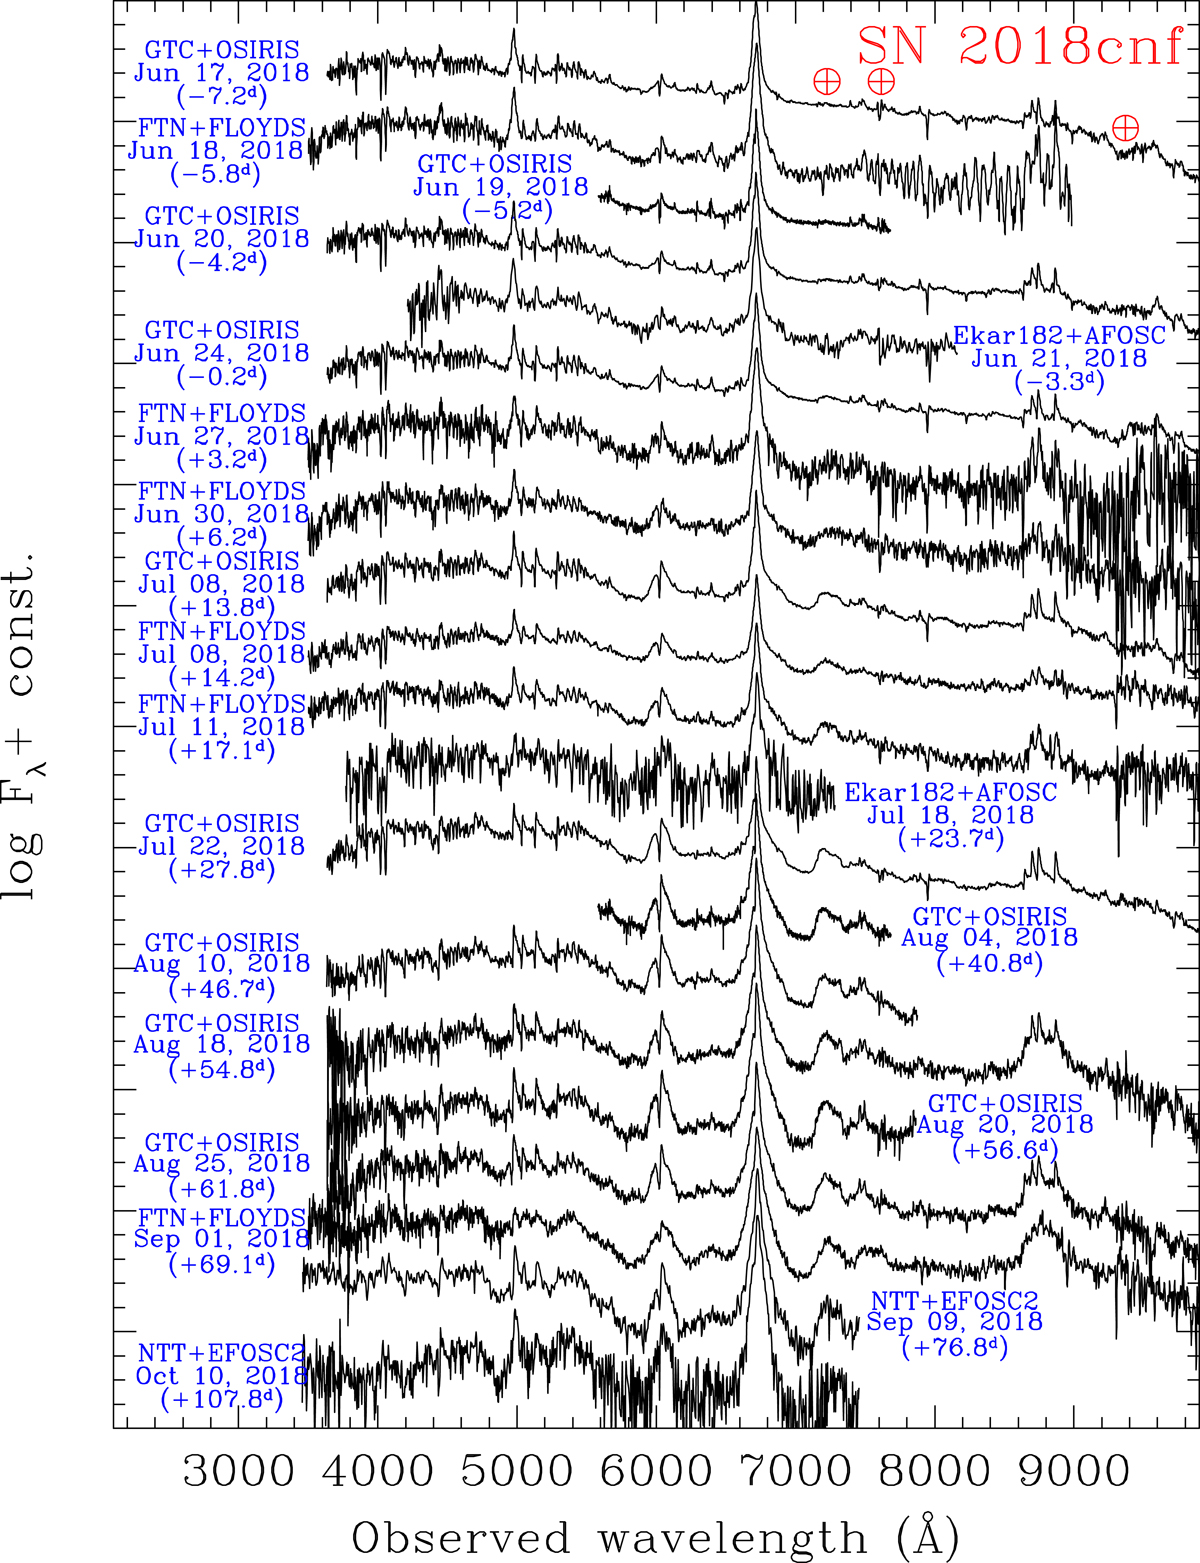
Spectral evolution of SN 2018cnf, spanning approximately 115 day period, from one week before peak to over 100 days after maximum. The phases are from the V-band maximum. Only spectra with good signal to noise are shown.
Current usage metrics show cumulative count of Article Views (full-text article views including HTML views, PDF and ePub downloads, according to the available data) and Abstracts Views on Vision4Press platform.
Data correspond to usage on the plateform after 2015. The current usage metrics is available 48-96 hours after online publication and is updated daily on week days.
Initial download of the metrics may take a while.