| Issue |
A&A
Volume 626, June 2019
|
|
|---|---|---|
| Article Number | A118 | |
| Number of page(s) | 10 | |
| Section | Interstellar and circumstellar matter | |
| DOI | https://doi.org/10.1051/0004-6361/201935068 | |
| Published online | 24 June 2019 | |
Extension of the HCOOH and CO2 solid-state reaction network during the CO freeze-out stage: inclusion of H2CO
1
Sackler Laboratory for Astrophysics, Leiden Observatory, Leiden University,
PO Box 9513,
2300 RA
Leiden,
The Netherlands
e-mail: dqasim@strw.leidenuniv.nl
2
Leiden Institute of Chemistry, Leiden University,
PO Box 9502,
2300 RA
Leiden,
The Netherlands
3
INAF – Osservatorio Astrofisico di Catania,
via Santa Sofia 78,
95123
Catania,
Italy
4
School of Electronic Engineering and Computer Science, Queen Mary University of London,
Mile End Road,
London
E1 4NS,
UK
5
Institute for Astronomy, University of Hawaii at Manoa,
2680 Woodlawn Drive,
Honolulu,
HI
96822–1839,
USA
Received:
16
January
2019
Accepted:
15
May
2019
Context. Formic acid (HCOOH) and carbon dioxide (CO2) are simple species that have been detected in the interstellar medium. The solid-state formation pathways of these species under experimental conditions relevant to prestellar cores are primarily based off of weak infrared transitions of the HOCO complex and usually pertain to the H2O-rich ice phase, and therefore more experimental data are desired.
Aims. Here, we present a new and additional solid-state reaction pathway that can form HCOOH and CO2 ice at 10 K “non-energetically” in the laboratory under conditions related to the “heavy” CO freeze-out stage in dense interstellar clouds, i.e., by the hydrogenation of an H2CO:O2 ice mixture. This pathway is used to piece together the HCOOH and CO2 formation routes when H2CO or CO reacts with H and OH radicals.
Methods. Temperature programmed desorption – quadrupole mass spectrometry (TPD-QMS) is used to confirm the formation and pathways of newly synthesized ice species as well as to provide information on relative molecular abundances. Reflection absorption infrared spectroscopy (RAIRS) is additionally employed to characterize reaction products and determine relative molecular abundances.
Results. We find that for the conditions investigated in conjunction with theoretical results from the literature, H + HOCO and HCO + OH lead to the formation of HCOOH ice in our experiments. Which reaction is more dominant can be determined if the H + HOCO branching ratio is more constrained by computational simulations, as the HCOOH:CO2 abundance ratio is experimentally measured to be around 1.8:1. H + HOCO is more likely than OH + CO (without HOCO formation) to form CO2. Isotope experiments presented here further validate that H + HOCO is the dominant route for HCOOH ice formation in a CO-rich CO:O2 ice mixture that is hydrogenated. These data will help in the search and positive identification of HCOOH ice in prestellar cores.
Key words: astrochemistry / dust, extinction / methods: laboratory: solid state / ISM: molecules / ISM: clouds / ISM: abundances
© ESO 2019
1 Introduction
HCOOH and CO2 have been detected across various environments in space. HCOOH has been confirmed in the gas-phase (Zuckerman et al. 1971; Winnewisser & Churchwell 1975; Irvine et al. 1990; Turner et al. 1999; Liu et al. 2001, 2002; Ikeda et al. 2001; Requena-Torres et al. 2006; Bottinelli et al. 2007; Taquet et al. 2017; Favre et al. 2018), but its identification in the solid-state is uncertain (Boogert et al. 2015). Abundances relative to H2O ice of less than 0.5 to up to 6 percent towards dense clouds, and low and high mass Young Stellar Objects have been derived (Schutte et al. 1999; Gibb et al. 2004; Bisschop et al. 2007a; Öberg et al. 2011; Boogert et al. 2015), providing the identification of HCOOH is indeed correct. CO2 has been detected in the gas-phase (Dartois et al. 1998; van Dishoeck 1998; Boonman et al. 2003) and abundantly in the solid-state (d’Hendecourt & Jourdain de Muizon 1989; Van Dishoeck et al. 1996; De Graauw et al. 1996; Whittet et al. 1998; Gerakines et al. 1999; Pontoppidan et al. 2008; Cook et al. 2011; Kim et al. 2012; Poteet et al. 2013; Ioppolo et al. 2013a; Boogert et al. 2015; Suhasaria et al. 2017, and references therein), and is one of the most ubiquitous ice constituents in the interstellar medium. Here, the observed CO2:H2O ice ratios are 15–35%.
At astrochemically relevant temperatures of ≤20 K, HCOOH ice has been shown to be formed by proton irradiation of H2O and CO (Hudson & Moore 1999), electron irradiation of H2O and CO (Bennett et al. 2010), UV irradiation of H2O and CO (Watanabe et al. 2007), hydrogenation of CO and O2 (Ioppolo et al. 2010), and a combined UV irradiation and hydrogenation of H2O and CO (Watanabe et al. 2007). Upper limit values or tentative identification of HCOOH formation in UV-induced experiments containing CH3OH (Öberg et al. 2009; Paardekooper et al. 2016)and H2CO (Butscher et al. 2016) have also been reported. CO2 ice can also be produced by both, “energetic” and “non-energetic” processes, where “non-energetic” refers to a radical-induced process without the involvement of UV, cosmic rays, and/or other “energetic” particles. For “energetic” processes, CO2 has been observed and formed experimentally by UV-irradiation of CO-containing ices (Gerakines et al. 1996; Ehrenfreund et al. 1997; Cottin et al. 2003; Loeffler et al. 2005), electron-induced radiation (Jamieson et al. 2006; Martin et al. 2008; Bennett et al. 2009a), as well as through ion bombardment (Moore et al. 1996; Palumbo et al. 1998; Satorre et al. 2000; Trottier & Brooks 2004). As relevant to this study, CO2 has also been shown to be formed from the irradiation of CO:O2 ices (Satorre et al. 2000; Strazzulla et al. 1997; Bennett et al. 2009b).
Solid-state laboratory experiments suggest that interstellar HCOOH and CO2 may have an icy origin and with common formation pathways. CO2 is typically formed alongside HCOOH (Hudson & Moore 1999; Ioppolo et al. 2010; Bennett et al. 2010; Butscher et al. 2016) or from HCOOH (Andrade et al. 2013; Bergantini et al. 2013; Ryazantsev & Feldman 2015). It has also been formed without co-detection of HCOOH (Oba et al. 2010a,b; Raut & Baragiola 2011; Ioppolo et al. 2011a, 2013a,b; Raut et al. 2012; Minissale et al. 2015; Suhasaria et al. 2017), although not all the studies explicitly state a non-detection of HCOOH or involve hydrogen. And in the case of the HOCO intermediate, it can dissociate upon hydrogenation to form CO2 rather than hydrogenate to form HCOOH (Ioppolo et al. 2011b; Linnartz et al. 2015).
While the bulk of CO2 and probably HCOOH is formed early in the cloud evolution, alongside with H2O, the aforementioned laboratory experiments indicate that some HCOOH and CO2 formation may occur during the heavy CO freeze-out stage as well. This is additionally supported by observations of CO2 ice in a CO environment (Pontoppidan et al. 2008), where the fraction of CO2 in a CO environment is 15–40%. The authors suggest that a quiescent formation mechanism could be at play for CO2 formation, in addition to cosmic-ray induced chemistry. Such a mechanism may arise from the hydrogenation of a CO:O2 ice mixture, as some O2 is likely mixed with CO at greater cloud depths (Tielens et al. 1982; Vandenbussche et al. 1999; Qasim et al. 2018). Additionally, OH radicals near the top of the H2O-rich ice may interact with incoming CO molecules. During the heavy CO freeze-out stage, a considerable amount of CO freezes out (Pontoppidan 2006; Boogert et al. 2015; Qasim et al. 2018) and can be hydrogenated to form H2CO, CH3OH, and more complex organics (Chuang et al. 2016; Fedoseev et al. 2017). The solid-state chemistry during the CO freeze-out stage is primarily driven by atom addition and abstraction reactions (Linnartz et al. 2015).
The experimentally and/or theoretically investigated “non-energetic” formation pathways for HCOOH and CO2 ice that are reported in the literature are:
Although investigated in detail before, many of the listed routes to HCOOH and CO2 formation are yet to have tight experimental constraints. To our knowledge, only one study showed the formation of HCOOH under “non-energetic” conditions (Ioppolo et al. 2010), and within this study, the reaction pathway involving the HOCO complex was considered. HCO + OH was reported to be unlikely since the HCO derivatives, H2CO and CH3OH, went undetected in the RAIR experiments under their experimental conditions. However, models suggest that HCO + OH is relevant to the solid-state chemistry of the prestellar core phase (Garrod & Herbst 2006). Oba et al. (2010a) also studied the reaction of OH and CO at low temperatures under different experimental conditions than those used by Ioppolo et al. (2010), and did not positively identify HCOOH formation. For the formation routes of CO2, particularly reactions (3)–(5) are of concern as it is uncertain which route dominates within an experiment, and thus which one is expected to be relevant to the interstellar medium (ISM). The reactant HOCO was considered an ingredient for CO2 formation due to the reportedweak IR band(s) of the HOCO complex (Oba et al. 2010a; Ioppolo et al. 2011a). In the work by Noble et al. (2011), formation of CO2 + H by solid-state OH + CO was reported to occur under their experimental conditions.
In this paper, we propose an additional way to form HCOOH and CO2 under conditions relevant to the heavy CO freeze-out stage, and that is through the hydrogenation of an H2CO:O2 ice mixture, where O2 is used as a tool to produce an abundant amount of OH radicals in the ice (Cuppen et al. 2010). It is stressed that the focus of this work is not to mimic a realistic interstellar ice, but to identify potential interstellar ice reaction channels. We use this new experimental finding, deuterated experiments, theoretical results available from the literature, and revisit previous experimentally studied reactions to provide greater constraints on the HCOOH and CO2 “non-energetic” formation pathways. Section 2 overviews the current state of the experimental apparatus and details the experimental parameters and methods used. Section 3 discusses the formation pathways of HCOOH and CO2. Section 4 outlines in particular how this study can contribute to the search for HCOOH ice in dense clouds. Section 5 lists the concluding remarks of this work.
2 Methodology
2.1 Experimental setup
The experiments described here are performed with SURFRESIDE2; an ultrahighvacuum (UHV) system designed to investigate the atom-induced reaction dynamics that take place in interstellar ices found in dark clouds. Within the main chamber, a closed cycle helium cryostat is connected to a gold-plated copper sample, which acts as a platform for solid-state reactions. More details on the design of the setup can be found in Ioppolo et al. (2013b), and recent modifications to the setup are included in Chuang et al. (2018).
To date, atoms including H, D, N, and O can be formed by the combination of two atom beam lines. Each line is placed in its own vacuum chamber and connected to the main chamber through a shutter valve, which has a base pressure of ~ 10−10 mbar. Ample hydrogen and deuterium atoms are formed by a Hydrogen Atom Beam Source (HABS; Tschersich & Von Bonin 1998; Tschersich 2000; Tschersich et al. 2008) and a Microwave Atom Source (MWAS; Oxford Scientific Ltd.). For the HABS, atoms are formed by the thermal cracking of hydrogen molecules. Because the filament within the HABS reaches a temperature of 2065 K in this study, a nose-shaped quartz tube is placed at the end of the HABS in order to collisionally cool the H-atoms. Such a tube is also placed at the end of the MWAS, since the atoms are created by the bombardment of electrons that are stimulated by a 2.45 GHz microwave power supply (Sairem) at 275 W. Both sources are utilized for two series of experiments (see Table 1), where the HABS is exploited for most of the experiments. The MWAS was used when the HABS became unavailable due to maintenance.
Gases, liquids, and solids are used to make the necessary ice mixtures. H2 (Linde 5.0) gas goes through the HABS and MWAS, while D2 (Praxair 99.8%) is only fragmented by the MWAS. O2 (Linde Gas 99.999%) and 18O2 gases (Campro Scientific 97%) flow through the vacuum chamber of the MWAS (microwave source off) and into the main chamber. HCOOH and H2O liquids are connected to turbomolecular-pumped dosing lines and undergo freeze-pump-thaw cycles in order to get rid of volatile impurities. Paraformaldehyde (Sigma-Aldrich 95%) and paraformaldehyde-13C (Sigma-Aldrich 99%) powders are also connected to the pre-pumped dosing lines, and are thermally decomposed by a bath of hot water in order to form H2CO and H213CO vapours, respectively. CO gas (Linde Gas 99.997%) is also introduced through one of the dosing lines. Both dosing lines terminate with manually-operated leak valves. All isotopes are used for the purpose of constraining the newly formed ice species, HCOOH and CO2, and their reaction pathways.
The techniques employed to investigate the ice composition, reaction pathways, and relative chemical abundances are temperatureprogrammed desorption – quadrupole mass spectrometry (TPD-QMS) and reflection absorption infrared spectroscopy (RAIRS). For TPD-QMS, a quadrupole mass spectrometer (Spectra Microvision Plus LM76) is used to probe the mass-to-charge (m/z) values of the sublimated ice reactants and products as a function of temperature. Resistive heating is used to heat the sample, which has a temperature range of 7–450 K. A silicon diode sensor placed at the back of the sample is used to measure the temperature and has an absolute accuracy of 0.5 K. An electron impact ionization energy of 70 eV is set for all experiments, while a TPD-QMS ramp rate of 2 or 5 K min−1 is chosen. It has been found that this small change in the ramp rate does not affect the main conclusions of this study. For RAIRS, a Fourier transform infrared spectrometer (FTIR; Agilent Cary 640/660) with a used wavenumber range of 4000–700 cm−1 and a resolution of 1 cm−1 is utilized to probe solid-state species through their molecular vibrations in the ice.The QMS detection limit is around 0.005 monolayers (equivalent to the amount in the solid-state), and for the FTIR, it is around an order of magnitude less for species with relatively high band strengths.
A detailed list of the experiments described in this study.
2.2 Experimental methods
Details of the experiments used for this study are outlined in Table 1. The H and D-atom fluxes are derived from an absolute D-atom flux that was determined by a QMS (Ioppolo et al. 2013b). All other fluxes are calculated by the Hertz-Knudsen equation. The rationale for the set of experiments is discussed in the following paragraphs.
Experiments 1–11 are, in part, used to show the unequivocal results of HCOOH and CO2 ice formation at 10 K. The OH radicals needed for the formation of HCOOH and CO2 are formed by H + O2 (Cuppen et al. 2010). All experiments involve the co-deposition technique (i.e., reactants are deposited simultaneously). Co-deposition is more representative of interstellar conditions and enhances the possibility of radical recombination reactions. The purpose of the lengthy experiment, 1, is to increase the product abundance in order to probe the formed ice species via RAIRS, which is a less sensitive technique compared to TPD-QMS under our specific experimental settings. The isotopes used in experiments 3–5 are applied to observe the m/z and infrared band shifts in the TPD-QMS and RAIR data, respectively. These shifts are compared to the spectra of experiment 2, which represents the principal reaction of this study. Experiments 6–9 are used to confirm the HCOOH infrared signature in the RAIR data of experiment 1. Experiments 10–11 are used to validate the H + HOCO pathway in CO-rich ices, and thus provide additional insight into the formation of HCOOH and CO2 in the H2CO + H + O2 experiment.
RAIR data are exploited to determine the HCOOH:CO2 relative abundance using a modified Lambert-Beer equation. Band strength values of 5.4 × 10⁻¹⁷ and 7.6 × 10⁻¹⁷ cm molecule−1 are used to determine the column densities of HCOOH and CO2, respectively, and are obtained from Bouilloud et al. (2015). Note that the values are multiplied by a transmission-to-RAIR proportionality factor, and the procedure to obtain this factor is discussed in Qasim et al. (2018). A HCOOH:CO2 ice abundance ratio of 1.9:1 is measured. To check the validity of using RAIR data to measure abundances, the abundances are additionally determined from TPD-QMS data. For the TPD measurements of H13COOH and 13CO2, the peak heights are measured at 157 K for H13COOH desorption (m/z = 47), and 79 and 150 K for 13CO2 desorption (m/z = 45). The formula to determine the column density from TPD data is found in Martín-Doménech et al. (2015) and references therein. The total ionization cross sections used are 5.09 × 10⁻¹⁶ cm2 for H13COOH (Możejko 2007) and 2.74 × 10⁻¹⁶ cm2 for 13CO2 (Orient & Strivastava 1987). The sensitivity values are 0.162 and 0.176 for m/z = 47 and 45, respectively, and are collected from SURFRESIDE2 (Chuang 2018, Univ. Leiden). A H13COOH:13CO2 ice abundance ratio of 1.6:1 is determined. The discrepancy is within range for the uncertainties that are associated with each method. Particularly with RAIRS, the accuracy maybe less than that of TPD-QMS since RAIRS is more sensitive to surface features than by the bulk of the ice.
The relative abundances of other formed products are determined by RAIR data solely, since the TPD-QMS data has overlapping m/z values (e.g., the CO+ signal is completely dominated by the signalof the CO+ fragment of H2CO+). Band strength values of 2.1 × 10⁻¹⁷ cm molecule−1 for H2O2, 7.6 × 10⁻¹⁸ cm molecule−1 for H2O, and 5.2 × 10⁻¹⁷ cm molecule−1 for CO are used to determine the column densities of the three species, where the band strength values for H2O2 and H2O are determined from Loeffler et al. (2006), and the value for CO is from Chuang et al. (2018). An H2O2:H2O:CO abundance ratio of 1:0.7:0.02 is measured.
3 Results and discussion
3.1 Formation of HCOOH ice by H2CO + H + O2
The top panel of Fig. 1 shows the TPD-QMS spectra of newly formed HCOOH obtained after the co-deposition of H2CO + H + O2, as well as pure HCOOH taken after deposition of pure HCOOH. Additional TPD-QMS spectra obtained after the formation of HCOOH isotopologues in correlated isotope-substituted reactions are shown in the bottom panel. Although HCOOH desorbs at 142 K in its pure form (top right panel), the literature shows that HCOOH typically desorbs at a higher temperature when mixed with less volatile compounds (Ioppolo et al. 2010; Bennett et al. 2010), in line with the present experiments. The m/z values displayed in the bottom panel of Fig. 1 clearly represent the formation of HCOOH involving oxygen atoms that originate from two different molecules, H2CO and O2. If the oxygen atoms of newly formed HCOOH were to solely originate from H2CO, then there would be no desorption signals at 157 K for m/z values of 48 and 47 in exp. 4, and for m/z values of 49 and 48 in exp. 5. Instead, the signals for m/z values of 46 and 45 in exp. 4 and 47 and 46 in exp. 5 would rise, which is not the case. Following this, the m/z values presented in the bottom panel of Fig. 1 line-up with the formation of a species that contains an oxygen atom from H2CO and an oxygen atom from O2, with m/z values that are the same as that of the expected HCOOH isotopologues. Additionally, the desorption peak at 157 K is consistently present among the exps. 2, 4 and 5, and the profiles are nearly identical. This indicates that the desorption peaks should represent the same species and are thus assigned to HCOOH. This assignment is further supported by the QMS fragmentation pattern shown in Fig. 2. HCOOH partially fragments to COOH+ upon 70 eV electron impact ionization with a COOH+:HCOOH+ relative intensity of 78:100 in the pure HCOOH experiment (exp. 6). This relative intensity is similar to the values of 79:100, 79:100, and 82:100 found in the H2CO + H + O2, H2CO + H + 18O2, and H213CO + H + 18O2 experiments, respectively.
Constraining the formation of HCOOH at 10 K by RAIR data is discussed below. In Fig. 3, a spectrum of H2CO + H + O2 taken after deposition at 10 K is shown. The products formed in the H2CO + H + O2 experiment are listed in Table 2 along with the corresponding IR signatures that are labeled in Fig. 3. Note that the two peaks around 1000 cm−1 are within the frequency range of the C-O stretch of CH3OH (Dawes et al. 2016). However, these peaks disappear between 195 and 205 K (not shown here), which is a temperature range that is higher than the desorption temperature of CH3OH or any species that are positively identified in this study. Therefore those peaks, although pronounced, are not attributed to a particular species at this time. Yet CH3OH, an expected product, is detected in the TPD-QMS experiments (not shown here). The specific features in Table 2 arise from precursor species, intermediates, and reaction products. Some of these species, although formed abundantly in the experiment, are yet to be observed in space. However, certain conditions in the laboratory are vastly different from the conditions in the ISM, and therefore comparison of even relative product abundances from the laboratory must be taken with caution to the relative abundances found in space. For example, H2O2, which is a side product from the H + O2 reaction, has yet to be detected in interstellar ices. It could be efficiently destroyed by a mechanism that does not take place in our experiments, for example.
Although not straightforward, it is possible to show that HCOOH can be identified spectroscopically. For this, the spectrum is interpreted in a multiple linear regression (MLR) analysis. Figure 4 shows a zoom-in of the spectrum along with spectra of the independent variables. The dependent variable is the original spectrum from Fig. 3. The independent variables represent the expected spectral components of the H2CO + H + O2 experiment.The differences between the components (e.g., HCOOH, H2O, etc.) and the original spectrum (i.e., H2CO + H + O2), as well as the choice of the selected components, are discussed.
It is evident in Fig. 4 that the H2CO C=O stretching feature at 1717 cm−1 in the original spectrum (a) is shifted from that of the MLR spectrum (b), but this is not the case for the C-O stretching feature at 1499 cm−1. This indicates that the 1717 cm−1 band is more sensitive to the ice mixture ratio and content than the 1499 cm−1 band. Therefore, the choice of using H2CO + O2 + H2O (c) versus pure H2CO is to witness how O2 and H2O contribute to broadening and shifting of the C=O peak. The pure H2O component (e) is relatively small, as the majority of H2O is already in the H2CO + O2 + H2O component. The H + O2 component (f) is used to contribute pure H2O2 (i.e., no H2O formed) into the analysis, which is a molecule that is not possible to deposit under our experimental conditions. The contribution of pure H2O2 can probably explain why there is a difference in the profile shapes of the ~1400 cm−1 feature between the H + O2 component and the original spectrum. Finally, the contribution of HCOOH (d) can reproduce the ~1750 cm−1 shoulder of the original spectrum, as shown in Fig. 5. Note that the HCOOH out-of-phase C=O stretching feature is also sensitive to its surrounding environment (Bisschop et al. 2007a), and can range from ~1700 cm−1 (Bisschop et al. 2007a; Bennett et al. 2010) to ~1750 cm−1 (Bisschop et al. 2007b; Ioppolo et al. 2010). The figure provides zoom-in spectra of the original and MLR spectra from Fig. 4, as well as the MLR spectrum that does not include the HCOOH component. The grey box highlights the shoulder of the C=O stretching feature in the H2CO + H + O2 experiment. When HCOOH is not included, the shoulder disappears. This infers that the shoulder is not solely due to intramolecular broadening effects, and that the inclusion of HCOOH allows to reproduce this feature. This shoulder may also be explained by glycolaldehyde (HCOCH2OH), as the molecule has a signature at ~1750 cm−1 and can be formed from the hydrogenation of H2CO (Chuang et al. 2016). Yet, its signal does not appear in the TPD-QMS data and therefore is not expected to appear in the correlating RAIR data. Thus, the RAIR data is fully consistent with the conclusion from the TPD-QMS experiments that HCOOH is formed at 10 K.
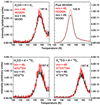 |
Fig. 1 TPD-QMS spectra of H2CO + H + O2 (top left; exp. 2) and HCOOH (top right; exp. 6). TPD-QMS spectra of H2CO + H + 18O2 (bottom left; exp. 4) and H213CO + H + 18O2 (bottom right; exp. 5). All spectra are recorded after ice growth at 10 K. |
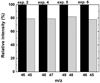 |
Fig. 2 The QMS cracking pattern of the desorption feature peaking at 157 K in the H2CO + H + O2 experiment (exp. 2), H2CO + H + 18O2 experiment (exp. 4), H213CO + H + 18O2 experiment (exp. 5), and deposited HCOOH (exp. 6). The patterns are measured for temperatures at 157 K for exps. 2, 4, and 5, and 142 K for exp. 6. m/z = 46 and 45 are the masses of the HCOOH+ and COOH+ ions, respectively. |
List of assigned species in the H2CO + H + O2 (exp. 1) experiment.
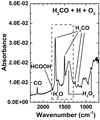 |
Fig. 3 RAIR spectrum of H2CO + H + O2 (exp. 1). Spectra are recorded after deposition at 10 K. The dashed-line box is a zoom-in of the spectrum shown in Fig. 4. |
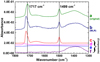 |
Fig. 4 RAIR spectra of H2CO + H + O2 (a; exp. 1), the H2CO + H + O2MLR spectrum (b), and its components multiplied by the coefficients derived from the MLR analysis: H2CO + O2 + H2O (c; exp. 7; 1.2 coefficient), HCOOH (d; exp. 6; 0.3 coefficient), H2O (e; exp. 8; 0.7 coefficient), and H + O2 (f; exp. 9; 9.7 coefficient). Spectra are recorded after deposition at 10 K and are offset for clarity. |
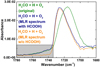 |
Fig. 5 RAIR spectra of H2CO + H + O2 (exp. 1) and H2CO + H + O2 MLR spectra with and without HCOOH inclusion (i.e., component d from Fig. 4). The grey box shows the shoulder found in the RAIR spectrum of exp. 1 that is assigned to the C=O stretching mode of HCOOH. Spectra are recordedafter deposition at 10 K and are offset for clarity. |
3.2 Formation of CO2 ice by H2CO + H + O2
The formation of CO2 ice is confirmed by RAIR and TPD-QMS data presented in Fig. 6. The experiments, H213CO + H + O2 and H213CO + H + 18O2, are purposefully displayed in order to not confuse the newly formed CO2 with residual CO2 that is omnipresentas a background pollutant, even under UHV conditions. The RAIR spectra (left panel) clearly show the asymmetric stretching modes of 13CO2 and 13CO18O at 2276 cm−1 and 2259 cm−1, respectively (Maity et al. 2014). The TPD-QMS data (right panel) also clearly illustrate the desorption of both species at the CO2 desorption temperature of 79 K (Fayolle et al. 2011). We also find that CO2 desorbs at higher temperatures via “volcano” desorption at 150 K (prior to H2O desorption) and co-desorption with H2O2 at 175 K (not shown here).
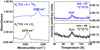 |
Fig. 6 (Left) RAIR and (right) TPD-QMS signals that illustrate the characteristic features of 13COO and 13CO18O found in the H213CO + H + O2 (exp. 3) and H213CO + H + 18O2 (exp. 5) experiments, respectively. Both take place at a substrate temperature of 10 K. RAIR spectra are offset for clarity. |
3.3 Pathways to HCOOH and CO2 that are formed in the experiments
In order to tightly constrain the formation routes of HCOOH and CO2 in our experiments, knowledge of the possible reactions taking place along with the activation barriers and branching ratios are needed. Table 3 lists reactions that are expected to occur in the H2CO + H + O2 experiment. Note that the values in the table are from predominantly theoretical studies, as shown in the footnotes.
3.3.1 HCOOH formation pathway
HCOOH can be formed by reactions 1 and/or 2 in the presented experiments: HCO + OH and/or H + HOCO. The formation of HCO occurs by H-atom addition of CO and H-atom abstraction from H2CO; both which contain activation barriers (Andersson et al. 2011; Song & Kästner 2017). This was demonstrated experimentally by Hidaka et al. (2004) and Chuang et al. (2016). The OH radical is formed by H + HO2, which is a barrierless reaction that occurs early within the H + O2 reaction chain (Lamberts et al. 2013). It is also formed by the H + H2O2 reaction (Lamberts & Kästner 2017), which however involves barriers. The activation energy of HOCO formed by OH + CO is calculatedto be nearly zero (Nguyen et al. 2012; Masunov et al. 2016; Tachikawa & Kawabata 2016), and since H + HOCO is barrierless, one may expect that H + HOCO dominates HCOOH formation. Yet, the pathway also requires two extra steps (i.e., H-abstraction from HCO and formation of HOCO) in comparison to the HCO + OH route. To determine the relevance of the two pathways, experimental and theoretical data are combined and the outcomes are discussed below.
The formation of CO ice is shown in Fig. 3 at 2137 cm−1. This occurs by the hydrogen abstraction from H2CO to produce HCO, and subsequently the hydrogen abstraction from HCO to produce CO. This HCO radical can react with a nearby OH radical barrierlessly to form HCOOH. Next, the contribution from the H + HOCO pathway is discussed. The HOCO intermediate is not observed in the RAIR spectra, as it was in other studies (Oba et al. 2010a; Ioppolo et al. 2010). However, HOCO is anunstable species, and can be stabilized depending on the polarity of the ice matrix (Ioppolo et al. 2011a) and whether HOCO is embedded in the ice (Arasa et al. 2013). Therefore, HOCO can still be relevant to HCOOH formation in the H2CO + H + O2 experiment,even though it is undetected in our RAIR data. According to Ioppolo et al. (2010), in a CO-rich ice, H + HOCO is found to be the dominant pathway to HCOOH formation. Thus, with the sight of CO in our RAIR data as shown in Fig. 3, it cannot be excluded that H + HOCO is a contributingroute for HCOOH formation. As the dominance of the H + HOCO pathway was determined by one weak transition of HOCO in Ioppolo et al. (2010), we performed isotope experiments with CO to further confirm this.
Figure 7 shows TPD-QMS spectra of m/z = 48 (representative of DCOOD) from the CO + D + O2 experiment and m/z = 46 (representative of HCOOH) from the CO + H + O2 experiment. In essence, the relative abundance of DCOOD to HCOOH shows which pathway dominates formic acid formation starting from a CO-rich ice. This can be explained by discussion of the following reactions:

OD/OH + CO is essentially barrierless, and D/H + DOCO/HOCO is barrierless. Thus, the reaction rates of reactions (8) and (9) are similar. However, for the reactions below:

D + CO is more than two orders of magnitude slower than H + CO (Andersson et al. 2011). Thus, if the abundance of HCOOH is much greater than the abundance of DCOOD, then HCO + OH would be considered the more dominant pathway.
The TPD-QMS results from Fig. 7 show that the integrated areas of DCOOD and HCOOH are essentially the same (i.e., they are not different by orders of magnitude). Therefore, it cannot be claimed from the presented results that HCO + OH is dominating in the CO + H + O2 experiment. Rather, H + HOCO dominates a CO-rich ice, which is in agreement with the findings from Ioppolo et al. (2010). However, which pathway contributes more or less to the formation of HCOOH in the H2CO + H + O2 experiment cannot be extracted here. We restrict our conclusion to the finding that both pathways occur and contribute to the formation of HCOOH. This is for the conditions investigated in our setup. To extrapolate these to interstellar ices, it is important to use astrochemical simulations in order to compare the relative contributions of each of the suggested reaction pathways under dark cloud conditions.
List of possible reactions taking place in the H2CO + H + O2 experiment.
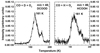 |
Fig. 7 TPD-QMS spectra of CO + D + O2 (exp. 10) and CO + H + O2 (exp. 11) recorded after ice growth at 10 K. |
3.3.2 CO2 formation pathway
The formation of CO2 is also via two pathways, as shown in Table 3. Note that OH + HOCO is not considered, as OH + HOCO should yield carbonic acid (H2CO3) (Oba et al. 2010b; Ioppolo et al. 2010), in addition to CO2 (Yu et al. 2005; Francisco et al. 2010), and H2CO3 is not detected in our experiments. OH + CO → HOCO has an activation barrier of nearly zero, whereas OH + CO → CO2 + H has barriers, making the HOCO product a more likely outcome. HOCO can then react with an H-atom to form H2 + CO2 and HCOOH without a barrier. In Sect. 3.3.1, we discuss that H + HOCO must be a route to HCOOH formation in the H2CO + H + O2 experiment. According to Table 3, CO2 is then also expected to be formed alongside HCOOH via H + HOCO. By combination of the experimental results in Sect. 3.3.1 with the theoretical values from Table 3, we propose that H + HOCO is the dominating pathway to CO2 formation inour experiments. Our experimental condition of co-deposition is also suitable for forming the HOCO complex, as the HOCO complex survives when it is able to dissipate its energy throughout the ice (Arasa et al. 2013). This excess energy is lost to the ice matrix within picoseconds (Arasa et al. 2010; Fredon et al. 2017), making it less likely that there is enough time for OH + CO → CO2 + H to be attempted. Note that the H2CO + O pathway is unlikely in the presented experiments, since H-atoms will actively compete with H2CO to react with O-atoms. CO + O is also not listed, as the barrier of this reaction (Roser et al. 2001) makes it a relatively minor reaction channel (Goumans & Andersson 2010; Ioppolo et al. 2013b). The reaction of H + CO2 has a very high barrier of > ~15 000 K (Bisschop et al. 2007b; McCarthy et al. 2016), which is too high to allow for tunneling to speed up the reaction considerably.
Since CO2 is predominantly formed by H + HOCO, the H + HOCO branching ratio can be used, in combination with the HCOOH:CO2 ice abundance ratio of around 1.8:1, to determine the contributions of HCO + OH and H + HOCO to HCOOH formation in our experiments. Yet, as shown in Table 3, the H + HOCO branching ratio is based off an approximation. Thus, a more well-defined branching ratio is desired in order to perform such a quantitative analysis.
3.3.3 Surface reaction mechanism
The dominating reaction mechanism in our experiments is discussed. Typically, interstellar ice analogues are formed by three mechanisms: Langmuir–Hinshelwood (L–H), Eley–Rideal (E–R), and hot-atom (H-A) (Linnartz et al. 2015; He et al. 2017). At the low temperature of 10 K, H-atoms have a high enough sticking coefficient to diffuse through the ice and react with other ice constituents. However, as the surface temperature increases, the H-atom residence time dramatically decreases. This phenomenon has been demonstrated in a number of laboratory works (Watanabe & Kouchi 2002; Watanabe et al. 2003; Cuppen & Herbst 2007; Fuchs et al. 2009; Chuang et al. 2016; Qasim et al. 2018), where hydrogenation product abundances significantly decrease as the substrate temperature rises beneath the initial desorption point of the reactant molecule(s). These observations show that the product abundance is governed by the substrate temperature, which is in favor of the L–H mechanism as the dominating mechanism in these studies. This then also concludes that the majority of H-atoms are thermally equilibrated to the 10 K surface prior to reaction.
We also find that tunneling is essential to product formation in this study. As shown in Table 3, H + H2CO has high activation barriers that range from 16–47 kJ mol−1. However it is shown here, and also in Chuang et al. (2016), that the H-induced abstraction of two H-atoms from H2CO to form CO occurs. With such high barrier values, the H-atom would not have sufficient energy to hop over the barrier, and therefore must undergo tunneling. The importance of tunneling in these type of reactions is discussed in more detail in Lamberts et al. (2017).
4 Astrophysical implications
Grain surface chemistry is a strong function of cloud depth, as the increasing density into the cloud enhances the gas-grain interaction. With the interstellar radiation field decreasing at larger extinctions (AV) by dust particles, photo-induced processes become less relevant in comparison to “non-energetic” processes, such as hydrogenation (Chuang et al. 2017). Thus, we expect the “non-energetic’ solid-state HCOOH formation route(s) investigated in our experiments, as well as their efficiencies, to depend strongly on cloud depth. The processes involved arecomplex and require detailed models in order to quantify their contribution to HCOOH and CO2 ice formation in the CO freeze-out stage. However, such processes are roughly expected to take place as follows.
Following Cuppen et al. (2009) and Tielens et al. (1982), the gas-phase CO:H and O:H ratios are critical parameters in grain surface chemistry. Initially, at cloud depths corresponding to AV values of less than a few magnitudes, the O-rich gas rapidly becomes hydrogenated on grain surfaces. Subsequently, a polar ice that is rich in H2O is formed, andthe abundantly formed intermediate product, OH, will also react with CO. Our study points to the conclusion that in this environment, this reaction is more likely to form the intermediate HOCO than directly CO2. Competition by the reaction of CO with H is low at this stage because of the high abundance of OH on the grains and the relatively high gas-phase CO:H ratio, as CO is not yet frozen out. With the presence of HOCO, both CO2 and HCOOH are then expected to be formed. Indeed, the observed CO2 abundance is very high (~20% of H2O Bergin et al. 2005). The identification of HCOOH at low extinctions is tentative at best (<5%; Boogert et al. 2011), because its strongest mode (~6.0 μm) overlaps with that of the H2O bending mode.
At visual extinctions above ~3 magnitude, the gas-phase CO:H ratio decreases as more CO freezes out. Also, most of the O is locked up in H2O, reducing the OH abundance on the grain surface. This promotes CO hydrogenation (H + CO). The formation of HOCO becomes less relevant, as the barrierless HCO + OH reaction will contribute to the formation of HCOOH. The formation of CO2 is then expected to be less important, although our experiments show that CO2 is formed in the ice. At ever increasing extinctions and densities into the cloud, HCO preferably hydrogenates to H2CO. H2CO ice has indeed likely been detected towards Young Stellar Objects at the 2–7% level with respect to H2O ice (Keane et al. 2001; Boogert et al. 2015). The observations are currently of insufficient quality to determine if H2CO is present in the polar (H2O-rich) or apolar (CO-rich) ice phases, but the latter is most likely (Cuppen et al. 2009). H-abstraction reactions will maintain an HCO reservoir and thus the HCO + OH route to HCOOH will continue. From the presented experiments, it is also observed that H + HOCO takes place in the H2CO + H + O2 experiment to form HCOOH. With two formation routes involving H2CO to form HCOOH, it is expected that the HCOOH:CO2 ratio is highest at AV > 3. Nevertheless, due to the low OH abundance, the absolute HCOOH abundance (with respect to dust) in the CO-rich layer is probably still less than that at lower extinctions in the H2O-rich layer. An illustration of the relevance of these reactions to the H2O-rich and heavy CO freeze-out stages are schematically shown in Fig. 8. Note that the figure only includes the formation mechanisms found in this work and does not provide an overview of all expected/studied mechanisms. Observations have shown that at AV > 9, where the “catastrophic” CO freeze-out takes place, CH3OH becomes dominant (Boogert et al. 2011), and this is expected to be a less favorable environment for HCOOH formation due to the lack of HCO radicals. An important caveat is that the CH3OH formation threshold of 9 mag is very uncertain. In fact, in some molecular cores, no CH3OH ice is observed well above this threshold (Boogert et al. 2011). Following the discussion above, this could enhance HCOOH abundances.
A search for HCOOH at extinctions across the entire extinction range is warranted. The best band to detect HCOOH is at 7.25 μm (Schutte et al. 1999) and has been seen only toward a few YSO envelopes (Öberg et al. 2011; Boogert et al. 2015). In a few years, however sensitive searches in prestellar sightlines across a wide AV range will be possible with the James Webb Space Telescope (JWST). Studies of the absorption band profiles (peak positions and widths) for a range of sightlines are needed to secure the identification of HCOOH in H2O and CO-richsightlines.
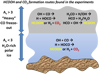 |
Fig. 8 Illustration of the formation pathways of HCOOH (highlighted in yellow) and CO2 (highlighted in red) ice in the H2O-rich and heavy CO freeze-out stages, as proposed only from the findings from this study (i.e., not all possible reactions are included). Note that an extra pathway to HCOOH formation is found in the heavy CO freeze-out stage due to the presence of H2CO. |
5 Conclusions
The primary findings of this study are listed below:
-
The hydrogenation of an H2CO:O2 ice mixture to study the H2CO + OH reaction at 10 K adds another “non-energetic” formation route to the solid-state formation of HCOOH and CO2 in cold and dark interstellar clouds. Astrochemical modeling is desired to know to what extent the new reactions added here contribute.
-
The formation of HCOOH in the H2CO + H + O2 experiment occurs by both, H + HOCO and HCO + OH. The exact value of their relative contributions can be determined once a more well-defined branching ratio of H + HOCO becomes available.
-
The formation of HCOOH in the CO + H + O2 experiment occurs predominantly by H + HOCO, as shown here and in Ioppolo et al. (2010).
-
The formation of CO2 in both, H2CO + H + O2 and CO + H + O2 experiments, is predominantly through H + HOCO rather than OH + CO for the conditions studied here.
-
A search for HCOOH ice in the ISM is expected to be promising at extinctions where HCO and H2CO are formed, but before H2CO is sufficiently hydrogenated to form CH3OH, which albeit has an uncertain formation threshold of 9 mag.
Acknowledgements
This research would not have been possible without the financial support from the Dutch Astrochemistry Network II (DANII). Further support includes a VICI grant of NWO (the Netherlands Organization for Scientific Research) and funding by NOVA (the Netherlands Research School for Astronomy). D.Q. thanks Marc van Hemert for insightful discussions. T.L. is supported by the NWO via a VENI fellowship (722.017.00). G.F. recognizes the financial support from the European Union’s Horizon 2020 research and innovation programme under the Marie Sklodowska-Curie grant agreement no. 664931. S.I. recognizes the Royal Society for financial support and the Holland Research School for Molecular Chemistry (HRSMC) for a travel grant.
References
- Álvarez-Barcia, S., Russ, P., Kästner, J., & Lamberts, T. 2018, MNRAS, 479, 2007 [NASA ADS] [CrossRef] [Google Scholar]
- Andersson, S., Goumans, T., & Arnaldsson, A. 2011, Chem. Phys. Lett., 513, 31 [NASA ADS] [CrossRef] [Google Scholar]
- Andrade, D. P., de Barros, A. L., Pilling, S., et al. 2013, MNRAS, 430, 787 [NASA ADS] [CrossRef] [Google Scholar]
- Arasa, C., Andersson, S., Cuppen, H., van Dishoeck, E., & Kroes, G.-J. 2010, J. Chem. Phys., 132, 184510 [NASA ADS] [CrossRef] [Google Scholar]
- Arasa, C., van Hemert, M. C., van Dishoeck, E. F., & Kroes, G.-J. 2013, J. Phys. Chem. A, 117, 7064 [CrossRef] [Google Scholar]
- Bennett, C. J., Jamieson, C. S., & Kaiser, R. I. 2009a, Phys. Chem. Chem. Phys., 11, 4210 [CrossRef] [Google Scholar]
- Bennett, C. J., Jamieson, C. S., & Kaiser, R. I. 2009b, ApJS, 182, 1 [NASA ADS] [CrossRef] [Google Scholar]
- Bennett, C. J., Hama, T., Kim, Y. S., Kawasaki, M., & Kaiser, R. I. 2010, ApJ, 727, 27 [Google Scholar]
- Bergantini, A., Pilling, S., Rothard, H., Boduch, P., & Andrade, D. 2013, MNRAS, 437, 2720 [NASA ADS] [CrossRef] [Google Scholar]
- Bergin, E. A., Melnick, G. J., Gerakines, P. A., Neufeld, D. A., & Whittet, D. C. 2005, ApJ, 627, L33 [NASA ADS] [CrossRef] [Google Scholar]
- Bisschop, S., Fuchs, G., Boogert, A., Van Dishoeck, E., & Linnartz, H. 2007a, A&A, 470, 749 [NASA ADS] [CrossRef] [EDP Sciences] [Google Scholar]
- Bisschop, S., Fuchs, G., Van Dishoeck, E., & Linnartz, H. 2007b, A&A, 474, 1061 [NASA ADS] [CrossRef] [EDP Sciences] [Google Scholar]
- Boogert, A., Huard, T., Cook, A., et al. 2011, ApJ, 729, 92 [NASA ADS] [CrossRef] [Google Scholar]
- Boogert, A. A., Gerakines, P. A., & Whittet, D. C. 2015, ARA&A, 53, 541 [Google Scholar]
- Boonman, A., Van Dishoeck, E., Lahuis, F. v., & Doty, S. 2003, A&A, 399, 1063 [NASA ADS] [CrossRef] [EDP Sciences] [Google Scholar]
- Bottinelli, S., Ceccarelli, C., Williams, J. P., & Lefloch, B. 2007, A&A, 463, 601 [NASA ADS] [CrossRef] [EDP Sciences] [Google Scholar]
- Bouilloud, M., Fray, N., Bénilan, Y., et al. 2015, MNRAS, 451, 2145 [NASA ADS] [CrossRef] [Google Scholar]
- Butscher, T., Duvernay, F., Danger, G., & Chiavassa, T. 2016, A&A, 593, A60 [NASA ADS] [CrossRef] [EDP Sciences] [Google Scholar]
- Chuang, K. 2018, Ph.D. Thesis, Universiteit Leiden, The Netherlands [Google Scholar]
- Chuang, K.-J., Fedoseev, G., Ioppolo, S., et al. 2016, MNRAS, 455, 1702 [Google Scholar]
- Chuang, K.-J., Fedoseev, G., Qasim, D., et al. 2017, MNRAS, 467, 2552 [NASA ADS] [Google Scholar]
- Chuang, K.-J., Fedoseev, G., Qasim, D., et al. 2018, ApJ, 853, 102 [NASA ADS] [CrossRef] [Google Scholar]
- Cook, A., Whittet, D., Shenoy, S., et al. 2011, ApJ, 730, 124 [NASA ADS] [CrossRef] [Google Scholar]
- Cottin, H., Moore, M. H., & Bénilan, Y. 2003, ApJ, 590, 874 [NASA ADS] [CrossRef] [Google Scholar]
- Cuppen, H., & Herbst, E. 2007, ApJ, 668, 294 [Google Scholar]
- Cuppen, H., Van Dishoeck, E., Herbst, E., & Tielens, A. 2009, A&A, 508, 275 [NASA ADS] [CrossRef] [EDP Sciences] [Google Scholar]
- Cuppen, H., Ioppolo, S., Romanzin, C., & Linnartz, H. 2010, Phys. Chem. Chem. Phys., 12, 12077 [NASA ADS] [CrossRef] [Google Scholar]
- Dartois, E., d’Hendecourt, L., Boulanger, F., et al. 1998, A&A, 331, 651 [NASA ADS] [Google Scholar]
- Dawes, A., Mason, N. J., & Fraser, H. J. 2016, Phys. Chem. Chem. Phys., 18, 1245 [NASA ADS] [CrossRef] [Google Scholar]
- De Graauw, T., Whittet, D., Gerakines, P. a., et al. 1996, A&A, 315, L345 [NASA ADS] [Google Scholar]
- d’Hendecourt, L., & Jourdain de Muizon, M. 1989, A&A, 223, L5 [NASA ADS] [Google Scholar]
- Ehrenfreund, P., Boogert, A., Gerakines, P., et al. 1997, A&A, 328, 649 [NASA ADS] [Google Scholar]
- Favre, C., Fedele, D., Semenov, D., et al. 2018, ApJ, 862, L2 [NASA ADS] [CrossRef] [Google Scholar]
- Fayolle, E. C., Öberg, K., Cuppen, H. M., Visser, R., & Linnartz, H. 2011, A&A, 529, A74 [NASA ADS] [CrossRef] [EDP Sciences] [Google Scholar]
- Fedoseev, G., Chuang, K.-J., Ioppolo, S., et al. 2017, ApJ, 842, 52 [NASA ADS] [CrossRef] [Google Scholar]
- Francisco, J. S., Muckerman, J. T., & Yu, H.-G. 2010, Acc. Chem. Res., 43, 1519 [CrossRef] [Google Scholar]
- Fredon, A., Lamberts, T., & Cuppen, H. 2017, ApJ, 849, 125 [NASA ADS] [CrossRef] [Google Scholar]
- Fuchs, G., Cuppen, H., Ioppolo, S., et al. 2009, A&A, 505, 629 [NASA ADS] [CrossRef] [EDP Sciences] [Google Scholar]
- Garrod, R. T., & Herbst, E. 2006, A&A, 457, 927 [NASA ADS] [CrossRef] [EDP Sciences] [Google Scholar]
- Gerakines, P., Schutte, W., & Ehrenfreund, P. 1996, A&A, 312, 289 [NASA ADS] [Google Scholar]
- Gerakines, P., Whittet, D., Ehrenfreund, P., et al. 1999, ApJ, 522, 357 [NASA ADS] [CrossRef] [Google Scholar]
- Gibb, E., Whittet, D., Boogert, A., & Tielens, A. 2004, ApJS, 151, 35 [NASA ADS] [CrossRef] [PubMed] [Google Scholar]
- Giguere, P., & Harvey, K. 1959, J. Mol. Spectr., 3, 36 [NASA ADS] [CrossRef] [Google Scholar]
- Goumans, T., & Andersson, S. 2010, MNRAS, 406, 2213 [NASA ADS] [CrossRef] [Google Scholar]
- He, J., Emtiaz, S. M., & Vidali, G. 2017, ApJ, 851, 104 [NASA ADS] [CrossRef] [Google Scholar]
- Hidaka, H., Watanabe, N., Shiraki, T., Nagaoka, A., & Kouchi, A. 2004, ApJ, 614, 1124 [NASA ADS] [CrossRef] [Google Scholar]
- Hodyss, R., Johnson, P. V., Stern, J. V., Goguen, J. D., & Kanik, I. 2009, Icarus, 200, 338 [NASA ADS] [CrossRef] [Google Scholar]
- Hudson, R., & Moore, M. 1999, Icarus, 140, 451 [NASA ADS] [CrossRef] [Google Scholar]
- Ikeda, M., Ohishi, M., Nummelin, A., et al. 2001, ApJ, 560, 792 [NASA ADS] [CrossRef] [Google Scholar]
- Ioppolo, S., Cuppen, H., Romanzin, C., Van Dishoeck, E., & Linnartz, H. 2008, ApJ, 686, 1474 [NASA ADS] [CrossRef] [Google Scholar]
- Ioppolo, S., Cuppen, H., Van Dishoeck, E., & Linnartz, H. 2010, MNRAS, 410, 1089 [Google Scholar]
- Ioppolo, S., Van Boheemen, Y., Cuppen, H., Van Dishoeck, E., & Linnartz, H. 2011a, MNRAS, 413, 2281 [NASA ADS] [CrossRef] [Google Scholar]
- Ioppolo, S., Cuppen, H., & Linnartz, H. 2011b, Rend. Lincei., 22, 211 [CrossRef] [Google Scholar]
- Ioppolo, S., Sangiorgio, I., Baratta, G., & Palumbo, M. 2013a, A&A, 554, A34 [NASA ADS] [CrossRef] [EDP Sciences] [Google Scholar]
- Ioppolo, S., Fedoseev, G., Lamberts, T., Romanzin, C., & Linnartz, H. 2013b, Rev. Sci. Instrum., 84, 073112 [NASA ADS] [CrossRef] [Google Scholar]
- Irvine, W. M., Friberg, P., Kaifu, N., et al. 1990, A&A, 229, L9 [NASA ADS] [Google Scholar]
- Jamieson, C. S., Mebel, A. M., & Kaiser, R. I. 2006, ApJS, 163, 184 [NASA ADS] [CrossRef] [Google Scholar]
- Keane, J., Tielens, A., Boogert, A., Schutte, W., & Whittet, D. 2001, A&A, 376, 254 [NASA ADS] [CrossRef] [EDP Sciences] [Google Scholar]
- Kim, H. J., Evans II, N. J., Dunham, M. M., Lee, J.-E., & Pontoppidan, K. M. 2012, ApJ, 758, 38 [NASA ADS] [CrossRef] [Google Scholar]
- Lamberts, T., & Kästner, J. 2017, ApJ, 846, 43 [NASA ADS] [CrossRef] [Google Scholar]
- Lamberts, T., Cuppen, H. M., Ioppolo, S., & Linnartz, H. 2013, Phys. Chem. Chem. Phys., 15, 8287 [CrossRef] [Google Scholar]
- Lamberts, T., de Vries, X., & Cuppen, H. 2014, Faraday Discuss., 168, 327 [NASA ADS] [CrossRef] [Google Scholar]
- Lamberts, T., Samanta, P. K., Köhn, A., & Kästner, J. 2016, Phys. Chem. Chem. Phys., 18, 33021 [CrossRef] [Google Scholar]
- Lamberts, T., Fedoseev, G., Kästner, J., Ioppolo, S., & Linnartz, H. 2017, A&A, 599, A132 [NASA ADS] [CrossRef] [EDP Sciences] [Google Scholar]
- Lannon, J. A., Verderame, F. D., & Anderson, Jr, R. W. 1971, J. Chem. Phys., 54, 2212 [NASA ADS] [CrossRef] [Google Scholar]
- Linnartz, H., Ioppolo, S., & Fedoseev, G. 2015, Int. Rev. Phys. Chem., 34, 205 [CrossRef] [Google Scholar]
- Liu, S.-Y., Mehringer, D. M., & Snyder, L. E. 2001, ApJ, 552, 654 [NASA ADS] [CrossRef] [Google Scholar]
- Liu, S.-Y., Girart, J., Remijan, A., & Snyder, L. 2002, ApJ, 576, 255 [NASA ADS] [CrossRef] [Google Scholar]
- Loeffler, M., Baratta, G., Palumbo, M., Strazzulla, G., & Baragiola, R. 2005, A&A, 435, 587 [NASA ADS] [CrossRef] [EDP Sciences] [MathSciNet] [Google Scholar]
- Loeffler, M. J., Teolis, B. D., & Baragiola, R. A. 2006, J. Chem. Phys., 124, 104702 [NASA ADS] [CrossRef] [Google Scholar]
- Maity, S., Kaiser, R. I., & Jones, B. M. 2014, Faraday Discuss., 168, 485 [Google Scholar]
- Martin, I., Bertin, M., Domaracka, A., et al. 2008, Int. J. Mass Spectrom., 277, 262 [CrossRef] [Google Scholar]
- Martín-Doménech, R., Manzano-Santamaría, J., Caro, G. M., et al. 2015, A&A, 584, A14 [NASA ADS] [CrossRef] [EDP Sciences] [Google Scholar]
- Masunov, A. E., Wait, E., & Vasu, S. S. 2016, J. Phys. Chem. A, 120, 6023 [CrossRef] [Google Scholar]
- McCarthy, M. C., Martinez, Jr, O., McGuire, B. A., et al. 2016, J. Chem. Phys., 144, 124304 [NASA ADS] [CrossRef] [Google Scholar]
- Meisner, J., Lamberts, T., & Kästner, J. 2017, ACS Earth Space Chem., 1, 399 [Google Scholar]
- Minissale, M., Loison, J.-C., Baouche, S., et al. 2015, A&A, 577, A2 [NASA ADS] [CrossRef] [EDP Sciences] [Google Scholar]
- Moore, M., Ferrante, R., & Nuth, III, J. 1996, Planet. Space Sci., 44, 927 [NASA ADS] [CrossRef] [Google Scholar]
- Możejko, P. 2007, Eur. Phys. J. Spec. Top., 144, 233 [CrossRef] [Google Scholar]
- Nguyen, T. L., Xue, B. C., Weston, Jr, R. E., Barker, J. R., & Stanton, J. F. 2012, J. Phys. Chem. Lett., 3, 1549 [CrossRef] [Google Scholar]
- Noble, J. A., Dulieu, F., Congiu, E., & Fraser, H. J. 2011, ApJ, 735, 121 [NASA ADS] [CrossRef] [Google Scholar]
- Oba, Y., Watanabe, N., Kouchi, A., Hama, T., & Pirronello, V. 2010a, ApJ, 712, L174 [NASA ADS] [CrossRef] [Google Scholar]
- Oba, Y., Watanabe, N., Kouchi, A., Hama, T., & Pirronello, V. 2010b, ApJ, 722, 1598 [NASA ADS] [CrossRef] [Google Scholar]
- Öberg, K. I., Garrod, R. T., Van Dishoeck, E. F., & Linnartz, H. 2009, A&A, 504, 891 [NASA ADS] [CrossRef] [EDP Sciences] [Google Scholar]
- Öberg, K. I., Boogert, A. A., Pontoppidan, K. M., et al. 2011, ApJ, 740, 109 [NASA ADS] [CrossRef] [Google Scholar]
- Orient, O., & Strivastava, S. 1987, J. Phys. B, 20, 3923 [NASA ADS] [CrossRef] [Google Scholar]
- Paardekooper, D., Bossa, J.-B., & Linnartz, H. 2016, A&A, 592, A67 [NASA ADS] [CrossRef] [EDP Sciences] [Google Scholar]
- Palumbo, M., Baratta, G., Brucato, J., et al. 1998, A&A, 334, 247 [NASA ADS] [Google Scholar]
- Pontoppidan, K. M. 2006, A&A, 453, L47 [NASA ADS] [CrossRef] [EDP Sciences] [Google Scholar]
- Pontoppidan, K. M., Boogert, A. C., Fraser, H. J., et al. 2008, ApJ, 678, 1005 [NASA ADS] [CrossRef] [Google Scholar]
- Poteet, C. A., Pontoppidan, K. M., Megeath, S. T., et al. 2013, ApJ, 766, 117 [NASA ADS] [CrossRef] [Google Scholar]
- Qasim, D., Chuang, K.-J., Fedoseev, G., et al. 2018, A&A, 612, A83 [NASA ADS] [CrossRef] [EDP Sciences] [Google Scholar]
- Raut, U., & Baragiola, R. 2011, ApJ, 737, L14 [NASA ADS] [CrossRef] [Google Scholar]
- Raut, U., Fulvio, D., Loeffler, M., & Baragiola, R. 2012, ApJ, 752, 159 [NASA ADS] [CrossRef] [Google Scholar]
- Requena-Torres, M. A., Martín-Pintado, J., Rodríguez-Franco, A., et al. 2006, A&A, 455, 971 [NASA ADS] [CrossRef] [EDP Sciences] [Google Scholar]
- Romanzin, C., Ioppolo, S., Cuppen, H., et al. 2011, J. Chem. Phys., 134, 084504 [NASA ADS] [CrossRef] [Google Scholar]
- Roser, J. E., Vidali, G., Manicò, G., & Pirronello, V. 2001, ApJ, 555, L61 [NASA ADS] [CrossRef] [Google Scholar]
- Ryazantsev, S. V., & Feldman, V. I. 2015, Phys. Chem. Chem. Phys., 17, 30648 [CrossRef] [Google Scholar]
- Satorre, M., Palumbo, M., & Strazzulla, G. 2000, Astrophys. Space Sci., 274, 643 [NASA ADS] [CrossRef] [Google Scholar]
- Schutte, W., Boogert, A., Tielens, A., et al. 1999, A&A, 343, 966 [NASA ADS] [Google Scholar]
- Song, L., & Kästner, J. 2017, ApJ, 850, 118 [NASA ADS] [CrossRef] [Google Scholar]
- Strazzulla, G., Brucato, J., Palumbo, M., & Satorre, M. 1997, A&A, 321, 618 [NASA ADS] [Google Scholar]
- Suhasaria, T., Baratta, G., Ioppolo, S., Zacharias, H., & Palumbo, M. 2017, A&A, 608, A12 [NASA ADS] [CrossRef] [EDP Sciences] [Google Scholar]
- Tachikawa, H., & Kawabata, H. 2016, J. Phys. Chem. A, 120, 6596 [CrossRef] [Google Scholar]
- Taquet, V., Wirström, E., Charnley, S. B., et al. 2017, A&A, 607, A20 [NASA ADS] [CrossRef] [EDP Sciences] [Google Scholar]
- Tielens, A., & Hagen, W. 1982, A&A, 114, 245 [NASA ADS] [Google Scholar]
- Trottier, A., & Brooks, R. L. 2004, ApJ, 612, 1214 [NASA ADS] [CrossRef] [Google Scholar]
- Tschersich, K. 2000, J. Appl. Phys., 87, 2565 [NASA ADS] [CrossRef] [Google Scholar]
- Tschersich, K., & Von Bonin, V. 1998, J. Appl. Phys., 84, 4065 [NASA ADS] [CrossRef] [Google Scholar]
- Tschersich, K., Fleischhauer, J., & Schuler, H. 2008, J. Appl. Phys., 104, 034908 [NASA ADS] [CrossRef] [Google Scholar]
- Turner, B., Terzieva, R., & Herbst, E. 1999, ApJ, 518, 699 [NASA ADS] [CrossRef] [Google Scholar]
- van Dishoeck, E. F. 1998, Faraday Discuss., 109, 31 [NASA ADS] [CrossRef] [Google Scholar]
- Van Dishoeck, E. F., Helmich, F., de Graauw, T., et al. 1996, A&A, 315, L349 [NASA ADS] [Google Scholar]
- Vandenbussche, B., Ehrenfreund, P., Boogert, A., et al. 1999, A&A, 346, L57 [NASA ADS] [Google Scholar]
- Watanabe, N., & Kouchi, A. 2002, ApJ, 571, L173 [NASA ADS] [CrossRef] [Google Scholar]
- Watanabe, N., Shiraki, T., & Kouchi, A. 2003, ApJ, 588, L121 [NASA ADS] [CrossRef] [Google Scholar]
- Watanabe, N., Mouri, O., Nagaoka, A., et al. 2007, ApJ, 668, 1001 [NASA ADS] [CrossRef] [Google Scholar]
- Whittet, D., Gerakines, P., Tielens, A., et al. 1998, ApJ, 498, L159 [NASA ADS] [CrossRef] [Google Scholar]
- Winnewisser, G., & Churchwell, E. 1975, ApJ, 200, L33 [NASA ADS] [CrossRef] [Google Scholar]
- Yu, H.-G., Muckerman, J. T., & Francisco, J. S. 2005, J. Phys. Chem. A, 109, 5230 [CrossRef] [Google Scholar]
- Zanchet, A., del Mazo, P., Aguado, A., et al. 2018, Phys. Chem. Chem. Phys., 20, 5415 [NASA ADS] [CrossRef] [Google Scholar]
- Zuckerman, B., Ball, J. A., & Gottlieb, C. A. 1971, ApJ, 163, L41 [NASA ADS] [CrossRef] [Google Scholar]
All Tables
All Figures
|
Fig. 1 TPD-QMS spectra of H2CO + H + O2 (top left; exp. 2) and HCOOH (top right; exp. 6). TPD-QMS spectra of H2CO + H + 18O2 (bottom left; exp. 4) and H213CO + H + 18O2 (bottom right; exp. 5). All spectra are recorded after ice growth at 10 K. |
| In the text | |
|
Fig. 2 The QMS cracking pattern of the desorption feature peaking at 157 K in the H2CO + H + O2 experiment (exp. 2), H2CO + H + 18O2 experiment (exp. 4), H213CO + H + 18O2 experiment (exp. 5), and deposited HCOOH (exp. 6). The patterns are measured for temperatures at 157 K for exps. 2, 4, and 5, and 142 K for exp. 6. m/z = 46 and 45 are the masses of the HCOOH+ and COOH+ ions, respectively. |
| In the text | |
|
Fig. 3 RAIR spectrum of H2CO + H + O2 (exp. 1). Spectra are recorded after deposition at 10 K. The dashed-line box is a zoom-in of the spectrum shown in Fig. 4. |
| In the text | |
|
Fig. 4 RAIR spectra of H2CO + H + O2 (a; exp. 1), the H2CO + H + O2MLR spectrum (b), and its components multiplied by the coefficients derived from the MLR analysis: H2CO + O2 + H2O (c; exp. 7; 1.2 coefficient), HCOOH (d; exp. 6; 0.3 coefficient), H2O (e; exp. 8; 0.7 coefficient), and H + O2 (f; exp. 9; 9.7 coefficient). Spectra are recorded after deposition at 10 K and are offset for clarity. |
| In the text | |
|
Fig. 5 RAIR spectra of H2CO + H + O2 (exp. 1) and H2CO + H + O2 MLR spectra with and without HCOOH inclusion (i.e., component d from Fig. 4). The grey box shows the shoulder found in the RAIR spectrum of exp. 1 that is assigned to the C=O stretching mode of HCOOH. Spectra are recordedafter deposition at 10 K and are offset for clarity. |
| In the text | |
|
Fig. 6 (Left) RAIR and (right) TPD-QMS signals that illustrate the characteristic features of 13COO and 13CO18O found in the H213CO + H + O2 (exp. 3) and H213CO + H + 18O2 (exp. 5) experiments, respectively. Both take place at a substrate temperature of 10 K. RAIR spectra are offset for clarity. |
| In the text | |
|
Fig. 7 TPD-QMS spectra of CO + D + O2 (exp. 10) and CO + H + O2 (exp. 11) recorded after ice growth at 10 K. |
| In the text | |
|
Fig. 8 Illustration of the formation pathways of HCOOH (highlighted in yellow) and CO2 (highlighted in red) ice in the H2O-rich and heavy CO freeze-out stages, as proposed only from the findings from this study (i.e., not all possible reactions are included). Note that an extra pathway to HCOOH formation is found in the heavy CO freeze-out stage due to the presence of H2CO. |
| In the text | |
Current usage metrics show cumulative count of Article Views (full-text article views including HTML views, PDF and ePub downloads, according to the available data) and Abstracts Views on Vision4Press platform.
Data correspond to usage on the plateform after 2015. The current usage metrics is available 48-96 hours after online publication and is updated daily on week days.
Initial download of the metrics may take a while.