| Issue |
A&A
Volume 625, May 2019
|
|
|---|---|---|
| Article Number | A49 | |
| Number of page(s) | 12 | |
| Section | Interstellar and circumstellar matter | |
| DOI | https://doi.org/10.1051/0004-6361/201834713 | |
| Published online | 08 May 2019 | |
Exploring the dimming event of RW Aurigae A through multi-epoch VLT/X-shooter spectroscopy★,★★
1
Dublin Institute for Advanced Studies,
31 Fitzwilliam Place,
Dublin 2,
Ireland
e-mail: This email address is being protected from spambots. You need JavaScript enabled to view it.
2
School of Physics, University College Dublin,
Belfield,
Dublin 4,
Ireland
3
European Southern Observatory,
Karl-Schwarzschild-Strasse 2,
Garching bei München,
85748
Germany
4
INAF/Osservatorio Astrofisico di Arcetri,
Largo E. Fermi 5,
50125
Firenze,
Italy
Received:
22
November
2018
Accepted:
7
March
2019
Abstract
Context. RW Aur A is a classical T Tauri star that has suddenly undergone three major dimming events since 2010. The reason for these dimming events is still not clear.
Aims. We aim to understand the dimming properties, examine accretion variability, and derive the physical properties of the inner disc traced by the CO ro-vibrational emission at near-infrared wavelengths (2.3 μm).
Methods. We compared two epochs of X-shooter observations, during and after the dimming. We modelled the rarely detected CO bandhead emission in both epochs to examine whether the inner disc properties had changed. The spectral energy distribution was used to derive the extinction properties of the dimmed spectrum and compare the infrared excess between the two epochs. Lines tracing accretion were used to derive the mass accretion rate in both states.
Results. The CO originates from a region with physical properties of T = 3000 K, NCO = 1 × 1021 cm−2 and vk sin i = 113 km s−1. The extinction properties of the dimming layer were derived with the effective optical depth ranging from τeff ~2.5−1.5 from the UV to the near-IR. The inferred mass accretion rate Ṁacc is ~1.5 × 10⁻⁸ M⊙ yr−1 and ~2 × 10⁻⁸ M⊙ yr−1 after and during the dimming respectively. By fitting the spectral energy distribution, additional emission is observed in the infrared during the dimming event from dust grains with temperatures of 500–700 K.
Conclusions. The physical conditions traced by the CO are similar for both epochs, indicating that the inner gaseous disc properties do not change during the dimming events. The extinction curve is flatter than that of the interstellar medium, and large grains of a few hundred microns are thus required. When we correct for the observed extinction, the mass accretion rate is constant in the two epochs, suggesting that the accretion is stable and therefore does not cause the dimming. The additional hot emission in the near-IR is located at about 0.5 au from the star and is not consistent with an occulting body located in the outer regions of the disc. The dimming events could be due to a dust-laden wind, a severe puffing-up of the inner rim, or a perturbation caused by the recent star-disc encounter.
Key words: protoplanetary disks / stars: formation / stars: individual: RW Aurigae / stars: variables: T Tauri, Herbig Ae/Be / dust, extinction / accretion, accretion disks
The reduced spectra are only available at the CDS via anonymous ftp to cdsarc.u-strasbg.fr (130.79.128.5) or via http://cdsarc.u-strasbg.fr/viz-bin/qcat?J/A+A/625/A49
Based on observations collected at the European Southern Observatory Paranal, Chile (ESO programme 294.C-5047 and 098.C-0922(A)).
© ESO 2019
1 Introduction
The binary RW Aur system comprises two Classical T Tauri stars (CTTSs), RW Aur A and RW Aur B (see Table 1 for properties of the primary star RW Aur A). The system is located at a distance of 152 pc (Gaia Collaboration 2016, 2018). The primary component has a spectral type between K1 and K4 (Petrov et al. 2001) and Vmag ~ 10.5 (White & Ghez 2001). It has a dusty disc radius of ≤57 au, making it one of the few T Tauri stars with such a small disc (Cabrit et al. 2006; Rodriguez et al. 2018). It is also one of the very few T Tauri stars that have a jet (Dougados et al. 2000; López-Martín et al. 2003; Beck et al. 2008). This system has captured attention mainly through its dimming events, which suddenly started in 2010 (Rodriguez et al. 2013; Petrov et al. 2015). During the first dimming event, the primary star dropped by ~1.5–2 mag in the V band, and the occultation lasted almost 180 days (Rodriguez et al. 2013). The second dimming event was even more significant, as the dimming was more than two magnitudes (Petrov et al. 2015; Bozhinova et al. 2016).
The dimming events of RW Aur are similar (1–3 mag in depth) to those of UX Ori stars (Grinin et al. 1991), which are typically associated with earlier type objects. A few other T Tauri stars are known to undergo similar dimming events, for instance, AA Tau (Bouvier et al. 2013) and V409 Tau (Rodriguez et al. 2015). The origin of these dimming events is still debated, ranging from inner disc warps to puffed-up inner rims. RW Aur is a unique case that may shed light on the origin of this phenomenon, because of the large amount of data that is available before and during the dimming events, with both photometric and spectroscopic monitoring. In particular, for RW Aur A the occulting material hasbeen associated with the inner regions of the disc due to additional emission (excess) at near-IR (NIR) wavelengths and more particularly in L and M bands (Shenavrin et al. 2015; Bozhinova et al. 2016). A large (~600 au) tidal arm in 12CO was detected by Cabrit et al. (2006). This arm was reproduced by Dai et al. (2015) through modelling the dynamical encounter of the two stars. Comparing X-ray observations in the bright and dim states, Schneider et al. (2015) found an increase in the gas column density during the second dimming event. Additional X-ray observations by Günther et al. (2018) also show an increased gas column density as well as an iron enhancement in the stellar corona. They studied the extinction from optical (Antipin et al. 2015) to NIR (Schneider et al. 2015), and found that it is nearly grey, suggesting grain growth in the inner disc. Other authors (see e.g. Petrov et al. 2015) suggested that the extinction could be due to an outburst or a wind. Facchini et al. (2016), on the other hand, argued that these dimming events are due to a perturbation of a misaligned or warped inner disc.
Interestingly, RW Aur A is one of the few T Tauri stars known to date to show the CO bandhead in emission (Carr 1989; Beck et al. 2008; Eisner et al. 2014). These transitions between the CO vibrational states trace the innermost regions of the disc, and changes in the line properties are expected if the inner gaseous disc varies significantly across the dimming events. In this paper, we present spectroscopic observations of RW Aur A obtained with the X-shooter on the Very Large Telescope(VLT/X-shooter), ranging from UV to NIR wavelengths, with a particular focus on the properties of the CO bandhead emission. We also aim to probe whether the dimming events have been caused by a significant variability in the mass accretion rate. Finally, we infer the properties of the dust within the occulting material from the extinction curve across the dimming events. The observations and the data reduction are discussed in Sect. 2, and the results and discussions in Sects. 3–5, respectively. In Sect. 6 we summarise the results and draw our conclusions.
Stellar properties of RW Aur A.
2 Observations and data reduction
RW Aur A was observed using the VLT/X-shooter instrument (Vernet et al. 2011) on 2015 March 19 (DDT Pr.Id. 294.C-5047, PI Facchini) and on 2016 September 30 (Pr.Id. 098.C-0922(A), PI Facchini). The wavelength coverage is from 0.3 to 2.4 μm. For both observing runs, a set of large (1.6 × 11′′, 1.5 × 11′′, 1.2 × 11′′) and narrow (0.5 × 11′′, 0.4 × 11′′, 0.4 × 11′′) slits were used in the UVB, VIS, and NIR arms, respectively. The seeing at the time of the observations was 1.00 for both epochs. The position angle in the 2016 run was 178°, and in the 2015 run it was −156° (east of north). While the data taken with the large slits have lower spectral resolution, they do not have any slit losses, thus they were flux calibrated and were used to calibrate the narrow slit data. In all the observations, care has been taken in order to avoid any contribution from RW Aur B (separation of ~1.5′′). The airmass for the observations was 1.7 and 2 for the 2016 and 2015 observations, respectively. The data were reduced using the X-shooter pipeline version 2.8.4. The spectra were flux calibrated using standard photometric stars observed during the night. They were corrected for telluric absorption using the telluric standards Hip045742 and Hip014898 for the 2016 and 2015 observations, respectively. The resolution of the observations in the NIR was computed to be R = 7000 (Δv = 43 km s−1) from absorption telluric features in the spectrum.
3 Results
3.1 Spectra
Figure 1 shows the light curve of RW Aur during 2007–2018. On 2015 March 19, when the first spectrum was obtained, the star was in a deep minimum, while in 2016 September 30, it was back to its typical brightness. In the following, we refer to the first as the dim state and to the second as the bright state. The two X-shooter spectra are shown in Fig. 2. The dim spectrum is weaker than the bright spectrum by a factor of 11.8 in the B band and up to 2.1 in the K band.
Both spectra are rich in strong emission lines, making RW Aur A an unusual CTTS (e.g. Joy 1945). These lines are quite complex and receive contributions from multiple components.
In both states, there is excess emission at short wavelengths, but there is no evidence of the Balmer jump (0.364 μm) that is oftenseen in many other CTTS (e.g Alcalá et al. 2014, 2017). A zoom-in in the spectra is shown in the appendix.
3.2 CO overtone emission
RW Aur A is one of the very few CTTS that exhibit NIR CO overtone emission in the 2.3 μm region. This emission is detected in both epochs, and the bright state is shown in Fig. 3. Both spectra are continuum-subtracted and normalised to the peak intensity of the second bandhead.
In the bright state, we detect five ro-vibrational transitions (υ = 2−0, 3−1, 4−2, 5−3, and 6−4). The overall profile of the first four bandheads is clearly visible, with a sharp peak and a small but significant “left shoulder”, probably due to Keplerian broadening (e.g. Chandler et al. 1995). The second bandhead peak (υ = 3–1) is slightly brighter than the first (υ = 2–0). At the spectral resolution of the observations, we spectrally resolve several individual J components of the rotational ladder. This is more obvious in the first two bandheads, as is clearly visible in Fig. 3.
The CO spectrum of the dim state along with the model, which will be explained later on, is shown in Fig. 5. The data are convolved to a lower resolution (R ~ 3500). As before, the data are normalised to the peak of the second bandhead and are shown in black. The dim spectrum is more noisy, and the correction for the telluric absorption much more uncertain. However, we clearly detect the first two bandheads and have a convincing signature of emission in the third, even if its profile is poorly retrieved.
3.2.1 Modelling the CO emission
The CO spectrum provides very interesting information on the physical properties of the emitting region. We computed synthetic spectra using the method outlined by Kraus et al. (2000), which is briefly discussed below.
The energy of a diatomic molecule of a rotational level J and vibrational level υ is given by Dunham (1932). We assume that the levels are populated in local thermodynamic equilibrium (LTE).
The CO emitting region is described by a single ring of width Δr, temperature (T), and column density (NCO), in Keplerian rotation around the central star. The υ band consists of 100 rotational transitions, and each J component has a Gaussian profile with width Δv. We created a spectrum over the range covered by the observed bandheads, with very high spectral resolution, so that each individual J transition profile was well sampled, and computed the total optical depth at each wavelength. The intensity is then given as I(υ, J) = Bν(T)(1 − e−τυ,J). The resulting spectrum was then convolved over the Keplerian velocity pattern and reduced to the observed spectral resolution.
The models have four free parameters: temperature (T), column density of the CO (NCO), intrinsic line width (Δν), and projected Keplerian velocity (vk sin i), where i is the inclination with respect to the line of sight (i = 0 for face-on ring).
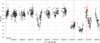 |
Fig. 1 Light curve of the RW Aur system in the visual. The plot is taken from The American Association of Variable Star Observers (AAVSO). The red dots indicate the time of our observations. The magnitudes for the two epochs were computed by producing synthetic photometry from the spectra. |
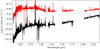 |
Fig. 2 Whole X-shooter spectrum for the bright (red) and the dim (black) state in the wavelength range of 0.3–2.4 μm. The y-axis is in logarithmic scale. A zoom-in of the spectra is shown in the appendix. |
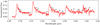 |
Fig. 3 CO continuum-subtracted spectrum of RW Aur A for the bright state. The spectrum has been normalised to the second bandhead. The Earth symbol shows regions with strong telluric features. |
3.2.2 Physical conditions of the CO emitting region in the bright state
We have computed a large grid of models by varying the free parameters over a broad range of values to compare the results to the CO bright state spectrum. The projected Keplerian velocity is quite well constrained even though our spectra do not have very high spectral resolution. As mentioned in Sect. 3.2, a number of components in the tail of the bands are spectrally resolved. The rotational ladder, along with the blue shoulder of the bandhead that is reproduced by the model of Keplerian rotation, constrains the range of possible vk sin i. At our spectral resolution, we find that what appears in the spectrum as a single J component is, in fact, the overlap of the red-shifted and blue-shifted components of two adjacent J transitions. Therefore, the peak position of the lines observed at the tail of the bandhead does not coincide with the wavelength of any individual J component, but depends on vk sin i (see Fig. 6). The best representative value of vk sin(i), reproducing the wavelength of the best measured individual features in the first and second bandhead tails, is 113 km s−1. We can derive the value of vk if the inclination is know. From the literature, there are two values for the inclination of the disc. From ALMA studies, it has been confirmed that the inclination of the outer disc is around 50° (Rodriguez et al. 2018). From KECK interferometric observations of a sample of young stellar objects (YSOs) by Eisner et al. (2014), they estimated an inclination of the inner gaseous disc of RW Aur A of 75°. Table 2 gives the values of vk for the two inclinations.
Temperature and column density determine the shape of the bandheads and the relative intensity of the different bands. We find that we need a relatively warm gas of temperature T ~ 3000 K in order to reproduce the observed profiles. The gas is quite dense, with a CO column density NCO ≈ 1 × 1021 cm−2. While the emission of the first three bandheads is mainly optically thick, the higher υ transitions, namely the fourth and fifth, still remain optically thin. Thus, an increase of the optical depth is associated with a slight change in the J components of the tail of the first three bandheads. In addition, a significant increase in the intensity of the forth and the fifth bandhead would be expected. We give the range of our estimates for T and NCO in Table 2.
The intensity of the bandheads, once T and NCO are known, depends only on the area of the emitting region. In the bright state, we find a value of about 2.5–3.1 × 1023 cm2, where the uncertainty depends mostly on the uncertainty on T.
3.2.3 COspectrum in the dim state
As the dim spectrum is much noisier, we used the fit of the bright state to compare it with the spectrum. In Fig. 5 the dim state spectrum is shown along with the best representative model of the bright state. The model reproduces the observed spectrum well within the errors. The physical conditions of the CO emitting region therefore do not change significantly between the bright and dim states.
3.3 Extinction due to the dimming layer
In this section we explore the possibility that the difference between the bright and dim state spectrum is due to a change in extinction, as previously suggested (e.g Petrov et al. 2015; Schneider et al. 2015; Rodriguez et al. 2016; Lamzin et al. 2017; Dodin et al. 2019). The magnitude and wavelength dependence of the extinction between thetwo states traced by the X-shooter spectra can be obtained by dividing the dim by the bright spectrum. The result is shown in Fig. 7 (top panel), where the red points mark the median of the observed values over intervals of 5 Å, excluding the brightest emission lines, and the error is the standard deviation within the interval. The black crosses correspond to regions where very few emission lines are present. The triangles show the values derived from the ratio of the two CO bandheads seen in the two states, assuming that the difference of the CO bands is due to extinction. They are higher than the value derived from the continuum adjacent to the bandheads, shown by one of the black crosses in Fig. 7. This discrepancy is easily explained if there is additional NIR continuum emission when the star is dimmed, as suggested by Shenavrin et al. (2015). In the following, we assume that this is indeed the case and that the true values of the effective optical depth (τeff) are better measured by the ratio of the CO bandheads.
The dependence of τeff on wavelength is well described by a power law τeff ∝ λ−0.5 for λ < 1.5 μm. This is much flatter than the extinction curve of the interstellar medium (ISM), also shown in Fig. 7 (black dashed curve in thebottom panel). However, the extinction is not grey over this range of wavelengths, ranging from τeff ~ 2.5 at 0.5 μm to ~ 0.7−1.5 at 2.3 μm.
Given the complexity of the dust in the immediate stellar environment and that of its geometry, it is impossible to fully constrain the dust properties from the data shown in Fig. 7. In particular, the actual contribution of scattering to the total extinction depends on a number of parameters, such as the geometry of the dusty layer and the grain properties, namely the phase function. However, some considerations can be of interest. In the following, we only consider silicate grains, because, as mentioned before, there are indications that the dimming layer is close to the star, where carbonaceous materials are likely to evaporate (e.g., Lodders 2003, and Sect. 3.4). In particular, we used olivine (Mg2SiO4), whose optical properties we obtained from the Jena database, Jäger et al. (2003), assuming spherical grains with a 30% porosity. Scattering and absorption efficiency were computed with the Mie theory and the Bruggeman effective medium description of porosity (Krügel 2008). We adopted a power-law grain size distribution with an exponent 3.0 between a minimum size amin = 0.06 μm and a maximum amax. The exact value of the porosity is not important, as long as it is not extreme. For amax = 0.1 μm the dependence on wavelength is very steep, comparable to that of the ISM (blue solid line in the bottom panel of Fig. 7). To reproduce the observed trend of τeff with wavelength, it is necessary to increase amax to much higher values. Such large grains have very high albedo (~1 in our range of wavelengths) but strongly forward-peaking scattering, which in practice reduces the albedo by large factors (e.g., Krügel 2008, 2009; Mulders et al. 2013). We find good agreement with the observations for amax ~ 150 μm, Qtot = Qabs + 0.12Qsca (green curve in the bottom panel of Fig. 7); the effective albedo is ~ 0.7 in the visual range, consistent with the polarimetry results analysed most recently by Dodin et al. (2019). If the scattering is less efficient, amax needs to be larger. On the other hand, the value of amax can be reduced if grains with different optical constants are adopted. For example, the “astronomical silicate” of Draine & Lee (1984), can reproduce the effective optical depth of RW Aur A for a size amax ~ 15 μm.
A detailed discussion of the dust properties requires a number of assumptions on the location and extension of the dimming layer and detailed radiation transfer calculations that include non-isotropic scattering; this is beyond the scope of this paper. However, we have not been able to find any type of dust that does not require grains much larger than those in the ISM.
Inner disc properties.
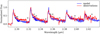 |
Fig. 4 Representative model and data of the bright state of the spectrum. Blue corresponds to the model and red to the observations. The intensity is normalised to the second bandhead and the wavelength is in microns. Five bandheads are shown (υ = 2- 0, 3-1, 4-2, 5-3, and 6-4). The parameters of the model are listed in Table 2. This particular case is for T = 3000 K, NCO = 8 × 1020 cm−2, and vk sin i = 113 km s−1. |
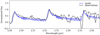 |
Fig. 5 First three bandheads of the dim state in black. In blue we plot the best-fit model of the bright state as in Fig. 4. |
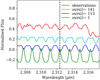 |
Fig. 6 J components for the first bandhead for different vk sin i. The spectra are shifted to facilitate comparison. The dashed vertical line corresponds to the intrinsic wavelength of one of the J components. |
3.4 Infrared excess
In its bright state, RW Aur A has a very strong NIR excess, as shown in Fig. 8. After subtracting the photospheric emission, the excess luminosity in the interval 1.1–2.4 μm is 0.17 L⊙, about 5–15% of the stellar luminosity (see Table 1). In the K band, the observed flux value is three times the photospheric flux. A disc model with Ṁacc ~ 1.0 × 10⁻⁸ M⊙ yr−1 (see Sect. 3.5) can only account for 30% of the photospheric flux at most. A very puffed-up inner rim can increase the NIR excess emission (Dullemond et al. 2003; McClure et al. 2013). The properties of the emitting region can be approximated by fitting a black-body of temperature TBB to the observed spectral energy distribution. We find a good fit for TBB = 1180 K, and a projected area of the emitting region ~ 5.6 × 1024 cm2. The corresponding luminosity ( Area) is 0.16 L⊙. Using Eq. (14) of Dullemond et al. (2001), we estimate that the distance from the star where T = 1180 K is ~ 0.1 au. Assuming that the emitting region is a cylinder of radius 0.1 au, we derive a height H ~ 0.12 au (Area = 2R × H). The ratio H∕R ~ 1 is not consistent with rim properties if hydrostatic equilibrium holds and suggests that even in its bright state RW Aur A is surrounded by an optically thick cloud of dust close to the sublimation temperature that covers a large fraction of 4π.
In the dim state, we firstly assumed that the observed spectrum is that of the bright state, extinguished as discussed in Sect. 3.3. When we adopt the τeff that fits the CO bandheads, then the NIR excess in the dim state is high and increases steeply with wavelength.
A confirmation of this is provided by the WISE archival data at 3.4 and 4.6 μm discussed by Bozhinova et al. (2016). The WISE observations were obtained in one to two consecutive nights in March 2014, when RW Aur A was in a bright state, and in July 2014, February 2015 and July 2015, when the star was in a faint state. Each period has magnitude variations of 0.5–1 mag, but there is clear evidence that while the 3.4 μm luminosity does not vary significantly between the two states, the system is much brighter at 4.6 μm during the dimming than in its bright state (see also Shenavrin et al. 2015). We show the WISE photometry in Fig. 8. Because the WISE photometry includes both RW Aur A and RW Aur B in the beam, we conservatively assumed that both components have similar fluxes in the bright state and that RW Aur B does not vary when RW Aur A enters the dimmed phase. The trends are similar when we assume that the contribution of RW Aur B is negligible in all cases. Moreover, we recall that the WISE and X-shooter observations are not simultaneous.
In spite of these uncertainties, there is strong evidence that in the dim phase there is not only absorption of the radiation of the innermost region of RW Aur A, but also an additional, warm emission, requiring grains with a range of temperatures of between 500–700 K. This is in agreement with Shenavrin et al. (2015).
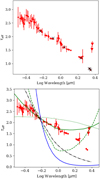 |
Fig. 7 Top panel: effective optical depth of the dimming layer vs. wavelength computed from the ratio of the dim to the bright X-shooter spectra. The red circles are the median of the values over intervals of 5 Å, the error is the standard deviation within the interval. The triangles show the optical depth derived from the ratio of the CObandheads, computed as the median of three points around the peak of the first two bandheads. The black crosses correspond to continuum points in the spectrum. Bottom panel: the red points (circles and triangles) are the same as in the top panel. The black dashed line is the Cardelli extinction law for RV = 3.1 (Cardelli et al. 1989). The green curves plot Qabs (dashed), Qscat (dotted), and Qtot = Qabs + 0.12Qscat (solid) for a distribution of olivine with minimum and maximum size amin = 0.1 μm, amax = 150 μm, q = 3 (see text). The blue curve plot Qtot = Qabs + Qscat (solid) for the same material, amin = 0.06 μm, amax = 0.1 μm, q = 3. All curves are normalised to the observed optical depth at 0.58 μm. |
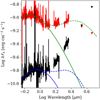 |
Fig. 8 X-shooter spectral energy distribution of the bright state is shown in red. The red triangles show the WISE flux obtained in March 2014, when RW Aur A was in a bright state, assuming that half of the flux is contributed by RW Aur B, which is included in the WISE beam. The green curves show the photosphere, approximated by a black-body with T = 4900 K and L = 1 L⊙, and the total emission of the photosphere plus an additional black-body at T = 1180 K and Area = ~5.6 × 1024 cm2. The X-shooter spectrum in the dim state is shown in black. The black triangles arethe WISE fluxes, computed assuming that RW Aur B does not vary during the period of the observations. The blue curves show the photosphere and the best-fitting model of the bright state emission reddened according to the extinction curve derived in Sect. 3.3. |
3.5 Accretion luminosities and mass accretion rate
Knowledge of the extinction during the dimming event with good wavelength resolution allows us to measure the accretion luminosity when the dimming occurs and compare it with the luminosity in the bright state.
The accretion luminosity can be derived with good accuracy from the luminosity of many different emission lines (see, e.g., Calvet et al. 2004; Alcalá et al. 2014, 2017, and references therein). In RW Aur A, the main difficulty arises from the fact that many lines have very complex profiles, with numerous, deep absorption features overlaying the emission. We selected the set of lines in the bright and the dim spectrum with more regular profiles (e.g. symmetric profiles) and computed their luminosity from the flux-calibrated spectrum by integrating over the continuum-subtracted line profile. The line luminosity was calculated for the distance d = 152 pc and converted into an accretion luminosity Lacc using the correlations between line and accretion luminosity of Alcalá et al. (2014). The results are shown in the left panel of Fig. 9for the bright state, for which we corrected for Av = 0.4 (White & Ghez 2001). For the dim state, we corrected each line for the value of τeff derived in Sect. 3.3 at the wavelength of the line, and show the results in the right panel of Fig. 9.
The average accretion luminosity is very similar in the two states, 0.40 ± 0.05 L⊙ for the bright state and 0.51 ± 0.07 L⊙ for the dim state. The corresponding mass accretion rate, computed using the stellar parameters in Table 1, is Ṁacc ~ 1.7 × 10⁻⁸ M⊙ yr−1 and Ṁacc ~ 2 × 10⁻⁸ M⊙ yr−1 for the bright and dim state, respectively. Therefore, the mass accretion rate of RW Aur A, as estimated above, does not vary during the dimming. This confirms that this is very likely due to dust extinction.
4 Discussion
4.1 Innergaseous disc
Overtone ro-vibrational emission of CO is clearly detected in both spectra. A study of the five bandheads in the bright spectrum allows us to confirm that the CO emission comes from a disc with projected Keplerian velocity ~113 km s−1. Depending on the exact value of the inclination, this corresponds to vk ~120-156 km s−1 and a distance from the star of ~0.06–0.08 au, within the dust sublimation radius. The model in Sect. 3.2.1 of the bandhead emission gives T ~ 3000 K, NCO ~ 1 × 1021 cm−2, consistent with a location in the innermost disc. This is generally the case for all objects where CO overtone emission has been detected (e.g. Ilee et al. 2014).
The models used in Sect. 3.2 make a number of simplifying assumptions. Some appear well justified a posteriori. The value of NCO is much higher than the limit for CO self-shielding (~ 1015 cm−2; van Dishoeck & Black 1988). The assumption of LTE to compute the level population may result in overestimating T if, for example, UV pumping of the vibrational levels is strong. Strong UV pumping cannot be ruled out using simple arguments, but it seems unlikely for a relatively cold object with low stellar and accretion luminosity such as RW Aur A.
The assumption of a single T, single NCO emitting ring can also be called into question. The emitting area required to reproduce the observed CO bandhead flux translates into a narrow ring width Δr∕r ~ 0.08. T and NCO radial gradients in the CO emitting region are very poorly constrained (Ilee et al. 2014), but it is unlikely that significant variations can occur over such a small radial distance. The fact that the emission is dominated by a hot, narrow ring is confirmed by the location of the features detected in the tail of the first two bandheads, as discussed in Sect. 3.2.2.
CO emission in the Δυ = 2 bands is detected in a small fraction of YSOs, ranging from about 17% in massive, embedded objects (Cooper et al. 2013) to 7% in HAeBe stars (Ilee et al. 2014). The frequency in lower mass objects is unclear, as most samples are relatively small and biased toward more luminous and/or exotic objects (Carr 1989; Chandler et al. 1995; Biscaya et al. 1997). However, there seems to be a tendency to lower detection fraction among lower mass objects. For example, Ilee et al. (2014) detect CO in only 2 of the 53 HAeBE stars in their sample with mass < 3 M⊙. We have examined the X-shooter spectra of about 100 T Tauri stars in Lupus (Alcalá et al. 2014, 2017) and found that after subtraction of the photospheric spectrum, none shows CO emission. Of all the bona-fide CTTS in the literature, CO is detected in emission in only 3 (Carr 1989; Eisner et al. 2014, this paper), which are listed in Table 3.
When detected in the overall sample of YSOs, the CO luminosity correlates with the Brγ luminosity (Carr 1989; Ilee et al. 2014; Pomohaci et al. 2017). However, for a given L(Brγ), very many CO upper limits are well below the detected values (Ilee et al. 2014; Eisner et al. 2014; Pomohaci et al. 2017). The correlation has often been interpreted as evidence that accretion and CO emission are physically related because the high temperatureand column density required to produce detectable CO emission may occur only when the accretion rate is sufficiently high (e.g., Carr 1989).
Nevertheless, it is likely that CO emission is only observed in high-mass TTS with high accretion rates. This seems to be a necessary condition, but given the large number of non-detections, not a sufficient one. Ilee et al. (2014) suggested that the inclination of the system with respect to the observer may play a role because CO detections are confined to objects with moderate-to-high inclination. This could be understood if, for example, the CO emission traces not only the inner disc surface but also an inner disc wall, or the base of a disc wind. Of the three TTS in Table 3, the inclination of the outer disc, as measured by ALMA, ranges from 63° for DO Tau to only 28° for DG Tau (Muzerolle et al. 2003; Rigliaco et al. 2013). However, it is possible that the inner disc is misaligned with respect to the outer disc, and that it is much more inclined, as suggested by Eisner et al. (2014) for RW Aur A.
RW Aur A was observed in the past with low resolution by Carr (1989), who detected CO absorption for L(Brγ) = 2.2 × 10⁻⁴ L⊙, peak/continuum ratio ~1.1. Eisner et al. (2014) did not detect any CO in emission. The Brγ line with respectto the continuum is much weaker than in our spectra, while its luminosity is comparable. This may indicate that the continuum emission was much brighter to make the CO lines undetectable at that sensitivity. Beck et al. (2008) detected at least the first four CO bandheads in emission. Their Fig. 3 shows that the Brγ peak is about 1.6 times the adjacent continuum. The CO spectrum is similar to what we observe. It follows that the CO emission from RW Aur A seems to have been remarkably stable over the last ten years. Exploring CO variability and its correlation with other properties, such as the near-IR continuum, and accretion and wind indicators is a promising way to understand the CO emitting region, and it is certainly worth exploring further.
T Tauri stars showing CO emission.
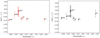 |
Fig. 9 Left panel: accretion luminosities versus wavelength for the bright state. The fluxes of the optical lines have been corrected for Av = 0.4 (White & Ghez 2001). Right panel: accretion luminosities versus wavelength for the dim state. The fluxes have been corrected for the observed extinction curve of Fig. 7. |
4.2 Dust in the dimming layer
The extinction curve derived in Sect. 3.3 suggests that large grains (up to a few hundred microns) exist in the dimming layer. This is consistent with other optical and IR observations (Schneider et al. 2015). Comparing the X-ray absorbing column density and the optical extinction, Günther et al. (2018) found that either the gas-to-dust ratio in the absorber is higher than in the ISM, or the absorber has undergone significant dust evolution.
In its bright state, RW Aur A has a very strong NIR excess, inconsistent with the emission of a disc or rim in hydrostatic equilibrium. It should be noted that the bright state of our observations occurs after a deep dimming but the excess is quite strong even before the start of the minima (Shenavrin et al. 2015).
4.3 Origin of the dimming events
The origin of the dimming events of RW Aur A has been much debated in the past few years. As soon as the dimming events were discovered, several authors interpreted the dimming events as caused by material at ~180 au from star A being ejected along the line of sight by the dynamical interaction between the discs of the system (e.g. Rodriguez et al. 2013, 2016; Dai et al. 2015). Support for this theory is given by hydrodynamical simulations, and by the ingress and egress time of the dimming events (see summary in Rodriguez et al. 2018): assuming a Keplerian velocity for the occulting body, ingress and egress times correspond to a distance of ~180 au.
Recent observational results, together with the spectra shown in this paper, indicate, however, that the dimming events are caused by material that is close to the primary star (0.1−1 au). The first indication is given by the strong NIR excess associated with the dimming events, as clearly shown by the WISE data (Bozhinova et al. 2016, see Fig. 8 of this paper). In Sect. 4.2 we show that the excess seen during the dimming corresponds to material at ~500−700 K, within 1 au from the central star. The surface area of this warm/hot dust component thus increases significantly during dimming, suggesting that the dimming event at shorted wavelengths is due to the same dusty material. A second indication is that the polarisation fraction increases during the dimming event (up to 30% in I band), showing a clear correlation between V magnitude and polarisation fraction (Lamzin et al. 2017). This indicates that while the star has been occulted, most of the circumstellar material has not, and thus constrains the location of the occulting body. Recent models by Dodin et al. (2019) account for the increase in the polarisation fraction due to scattering by a dust layer in a disc wind. This study agrees with our results and locates the dust screen close to the star. The same argument can be used to explain why the O I line at 6300 Å does not vary in flux between bright and dimmed state (e.g. Takami et al. 2016).
Even though we have reasonable evidence that the dust layer screening the central star is from the very inner region of the circumstellar disc, the physical origin of the high column density of dust is still not clear. At least three hypotheses have been proposed as the physical phenomenon that has led to the dimming events. The first hypothesis is a dust-laden wind (e.g. Petrov et al. 2015; Dodin et al. 2019). Facchini et al. (2016, and earlier France et al. 2014) have detected narrow absorption lines at approximately − 60 km s−1 in the optical Na and K doublets, and in the N I, Si II, and Si III UV lines. The absorption features indicate a disc wind, and the velocities are in agreement with a magnetically driven wind (as photoevaporative flows would present much lower velocities, Facchini et al. 2016). However, mass-loss rates from disc winds are correlated with the mass-accretion rate onto the star, and we do not see a variability in the accretion rate in the dimming events. A possibility would then be that while the gas mass-loss rate does not vary, the dimming events trace strong variations in the dust-to-gas ratio of the disc wind (Gárate et al. 2019). This hypothesis is partially supported by the super-solar metallicity of the recently accreted material, as traced by the Fe line seen by Chandra (Günther et al. 2018). From the extinction curve derived in Sect. 3.3, we could constrain the occulting dust to have grains as large as afew hundred microns; connecting the disc wind with the maximum grain size entrained in the flow would be a very interesting dynamical experiment. Models of dust entrainment in magnetohydrodynamic winds indeed suggest that grains as large as 10− 100μm can be entrainedin winds launched within <1 au from the central star (e.g. Miyake et al. 2016). Finally, a dust-laden disc wind can help explain the strong NIR excess, with a significant part of the solid angle around the central star surrounded by dust.
Another possibility is that the dimming events are caused by a severe puffing-up of the very inner disc, as proposed for UX Ori objects, that is due to a thermal instability (e.g., Dullemond et al. 2003). From a simple calculation, the time for a disc to dynamically respond in the vertical direction to a significant change in temperature is ~ H∕cs, where cs is the local sound speed. Because H∕cs = Ω, where Ω is the Keplerian frequency, the ingress and egress timescale of ~30 days corresponds to a radius of ~0.2 au (we have assumed a 1.4 M⊙ stellar mass). This result is in agreement with the radius of the dusty screen as derived from the strong NIR excess during the dimming events. The difficulty arising from this simple model is that the puffing-up would need to be extreme. Rodriguez et al. (2018) showed that the inclination of the outer disc obtained from ALMA is 55° ± 0.13°. Assuming that the disc is co-planar, in order to have the surface of the disc at one scale height across the line of sight would require H∕R ~ 0.76. Some authors have thus suggested that the inner disc could be warped because the inclination of the very inner disc from NIR interferometric measurements is ~75° (Eisner et al. 2014). However, the structure of the inner disc is likely very different from a simple smooth surface, and the visibility coverage of the interferometric observations is very limited, thus the derivation of the inclination from the NIR can be questioned (Eisner et al. 2014).
A third explanation links the dimming events to the recent star-disc encounter undergone by the RW Aur system. The hydrodynamical models by Dai et al. (2015) show that the periastron passage occurred ~500 yr ago. Berdnikov et al. (2017) suggest that the interaction that has perturbed the outer disc has recently arrived at the inner regions, thus causing the dimming events. Dai et al. (2015) have demonstrated that in order to reproduce the morphology of the RW Aur system, the orbital plane of the binary has to be misaligned with respect to the circumprimary disc. The interaction thus generates a bending wave from the outer disc (e.g. Nixon & Pringle 2010), which then propagates inward with a velocity of cs ∕2 (Papaloizou & Lin 1995; Facchini et al. 2013). Assuming a temperature of 30 K at 10 au and a temperature dependence ∝ R−1∕2, half of the sound crossing time (i.e. the time it takes for a bending wave to reach the inner regions) is
 (1)
(1)
where we have taken Rout = 58 au (as measured from the ALMA observations by Rodriguez et al. 2018). The agreement of the two relevant timescales (periastron passage and sound-crossing time) is suggestive, but not conclusive.
5 Summary and conclusions
This paper discussed some properties of RW Aur A and its activity, using two X-shooter spectra, one taken during a deep magnitude minimum in March 2015 and the other about 550 days later (September 2016), when the system was again in its bright state.
5.1 Gaseous inner disc
RW Aur A is one of three T Tauri stars with detected CO overtone emission. We discussed that a high accretion rate seems to be a necessary but not sufficient condition for this emission.
Overtone ro-vibrational emission of CO is clearly detected in both spectra. A study of the five bandheads in the bright spectrum allowed us to determine that the CO emission comes from a disc with projected Keplerian velocity ~113 km s−1. Depending on the exact value of the inclination, this corresponds to vk ~ 155−120 km s−1 and a distance from the star of ~ 0.06–0.08 au, which is within the dust sublimation radius. Simple models of the bandhead emission give T ~ 3000 K, N(CO) ~ 1 × 1021 cm−2 and a de-projected area of 2.5−3.1 × 1023 cm2, consistent with a location in the innermost disc. The first two CO bandheads are also clearly detected in the more noisy dim spectrum. The CO profiles are similar in the bright and dim states, and thus the same CO model fit the two spectra equally well. This suggests that the physical conditions of the inner disc do not change when the dimming occurs.
We derived the mass accretion rate from a set of emission lines, excluding those with more irregular profiles, and obtained a value of ~ 2 × 10⁻⁸ M⊙ yr−1. We obtained a similar value for the dim state, after correcting the line luminosity for the extinction measured by comparing the two X-shooter spectra. This is a typical accretion rate in T Tauri stars of M ~ 1M⊙ (e.g Ardila et al. 2013; Alcalá et al. 2014, 2017).
These results indicate that the innermost gaseous disc and the accretion rate do not change much over the years and are basically constant over the interval of time when the deep minima occur.
5.2 Dimming event
The results on the inner gaseous disc and mass accretion rate indicate that the deep minima are likely due to a layer of dust obscuring the inner 0.05–0.1 au of the system. We derived the extinction due to the layer of dust that causes the dimming by dividing the spectrum of the dim and bright states. The results show a rather flat dependence of the effective optical depth on wavelength, ranging from about 2.7 in the blue part of the spectrum (~0.4 μm) to 1.2–1.5 in the K band. The ratio of the CO bandheads gives a value of τeff that is higher than in the adjacentcontinuum by about 0.3 mag. We discussed this result using simple silicate grain models and conclude that grains need to be much larger than in the ISM, with maximum sizes of a few hundred microns at least. This is roughly in agreement with the results of X-ray observations (Günther et al. 2018). The extinction curve is very well sampled over a wide range of wavelengths, providing a complete set of data to better understand the properties of dust in circumstellar discs.
RW Aur A has a strong NIR excess in both states. During the dimming, we detect excess emission at wavelengths longer than 2 μm that is due to dust at 500–700 K. The location of this dust at about 0.5 au from the star is not consistent with a location in the outer disc (derived assuming that the ingress time of the minima follows the Keplerian rotation velocity of its location).
Our results together with data from the literature (e.g Lamzin et al. 2017) support the scenario that the dimming events are caused by material that is close to the primary star (within 1 au). Still, the cause of the dimming events is not clear. Several hypotheses have been offered to explain this phenomenon, and we list the more pertinent ones below that are consistent with our results.
-
The dimming events are caused by a dust-laden wind as previously proposed by Petrov et al. (2015). This is supported by the narrow absorption lines detected by France et al. (2014) and Facchini et al. (2016) and the high infrared excess.
-
A severe puffing-up of the inner disc due to thermal instabilities as in UX Ori objects. This is consistent with the location of the dimming from fitting the spectral energy distribution.
-
A perturbation of the inner disc through tidal interaction with RW Aur B. According to hydrodynamical simulations of Dai et al. (2015), periastron occured around 500 years ago, which is consistent with the wave reaching the inner disc recently.
Acknowledgements
We would like to acknowledge the referee, H. Takami, for his constructive comments that helped us to improve the manuscript. M.K. is funded by the Irish Research Council (IRC), grant GOIPG/2016/769 and SFI grant 13/ERC/12907. S.F. and C.F.M. acknowledge an ESO Fellowship. R.G.L. has received funding from the European Union’s Horizon 2020 research and innovation programme under the Marie Skłodowska-Curie Grant (agreement No. 706320). R.F. acknowledges support from Science Foundation Ireland (grant No. 13/ERC/12907). A.C.G. and T.P.R. have received funding from the European Research Council (ERC) under the European Union’s Horizon 2020 research and innovation programme (grant agreement No. 743029). A.N. acknowledges the kind hospitality of the DIAS.
Appendix A Spectra
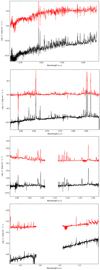 |
Fig. A.1 Zoom into the X-shooter spectra from 0.3–2.4 μm. The bright state is shown in red and the dim state in black. |
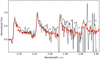 |
Fig. A.2 Continuum-subtracted spectra of the CO-emitting regions in the bright (red) and dim (black) states. The spectra are normalised in the second bandhead. |
References
- Alcalá, J. M., Natta, A., Manara, C. F., et al. 2014, A&A, 561, A2 [NASA ADS] [CrossRef] [EDP Sciences] [Google Scholar]
- Alcalá, J. M., Manara, C. F., Natta, A., et al. 2017, A&A, 600, A20 [NASA ADS] [CrossRef] [EDP Sciences] [Google Scholar]
- Antipin, S., Belinski, A., Cherepashchuk, A., et al. 2015, IBVS, 6126, 1 [NASA ADS] [Google Scholar]
- Ardila, D. R., Herczeg, G. J., Gregory, S. G., et al. 2013, ApJS, 207, 1 [NASA ADS] [CrossRef] [EDP Sciences] [Google Scholar]
- Beck, T. L., McGregor, P. J., Takami, M., & Pyo, T.-S. 2008, ApJ, 676, 472 [NASA ADS] [CrossRef] [Google Scholar]
- Berdnikov, L. N., Burlak, M. A., Vozyakova, O. V., et al. 2017, Astrophys. Bull., 72, 277 [NASA ADS] [CrossRef] [Google Scholar]
- Biscaya, A. M., Rieke, G. H., Narayanan, G., Luhman, K. L., & Young, E. T. 1997, ApJ, 491, 359 [NASA ADS] [CrossRef] [Google Scholar]
- Bouvier, J., Grankin, K., Ellerbroek, L. E., Bouy, H., & Barrado, D. 2013, A&A, 557, A77 [NASA ADS] [CrossRef] [EDP Sciences] [Google Scholar]
- Bozhinova, I., Scholz, A., Costigan, G., et al. 2016, MNRAS, 463, 4459 [NASA ADS] [CrossRef] [Google Scholar]
- Cabrit, S., Pety, J., Pesenti, N., & Dougados, C. 2006, A&A, 452, 897 [NASA ADS] [CrossRef] [EDP Sciences] [Google Scholar]
- Calvet, N., Muzerolle, J., Briceño, C., et al. 2004, AJ, 128, 1294 [NASA ADS] [CrossRef] [Google Scholar]
- Cardelli, J. A., Clayton, G. C., & Mathis, J. S. 1989, ApJ, 345, 245 [NASA ADS] [CrossRef] [Google Scholar]
- Carr, J. S. 1989, ApJ, 345, 522 [NASA ADS] [CrossRef] [Google Scholar]
- Chandler, C. J., Carlstrom, J. E., & Scoville, N. Z. 1995, ApJ, 446, 793 [NASA ADS] [CrossRef] [Google Scholar]
- Dai, F., Facchini, S., Clarke, C. J., & Haworth, T. J. 2015, MNRAS, 449, 1996 [NASA ADS] [CrossRef] [Google Scholar]
- Dodin, A., Grankin, K., Lamzin, S., et al. 2019, MNRAS, 482, 5524 [NASA ADS] [CrossRef] [Google Scholar]
- Dougados, C., Cabrit, S., Lavalley, C., & Ménard, F. 2000, A&A, 357, L61 [NASA ADS] [Google Scholar]
- Draine, B. T., & Lee, H. M. 1984, ApJ, 285, 89 [Google Scholar]
- Dullemond, C. P., Dominik, C., & Natta, A. 2001, ApJ, 560, 957 [NASA ADS] [CrossRef] [Google Scholar]
- Dullemond, C. P., van den Ancker, M. E., Acke, B., & van Boekel, R. 2003, ApJ, 594, L47 [NASA ADS] [CrossRef] [Google Scholar]
- Dunham, J. L. 1932, Phys. Rev., 41, 721 [NASA ADS] [CrossRef] [Google Scholar]
- Eisner, J. A., Hillenbrand, L. A., & Stone, J. M. 2014, MNRAS, 443, 1916 [NASA ADS] [CrossRef] [Google Scholar]
- Facchini, S., Lodato, G., & Price, D. J. 2013, MNRAS, 433, 2142 [NASA ADS] [CrossRef] [Google Scholar]
- Facchini, S., Manara, C. F., Schneider, P. C., et al. 2016, A&A, 596, A38 [NASA ADS] [CrossRef] [EDP Sciences] [Google Scholar]
- France, K., Herczeg, G. J., McJunkin, M., & Penton, S. V. 2014, ApJ, 794, 160 [NASA ADS] [CrossRef] [Google Scholar]
- Gaia Collaboration (Prusti, T., et al.) 2016, A&A, 595, A1 [NASA ADS] [CrossRef] [EDP Sciences] [Google Scholar]
- Gaia Collaboration (Brown, A. G. A., et al.) 2018, A&A, 616, A1 [NASA ADS] [CrossRef] [EDP Sciences] [Google Scholar]
- Gárate, M., Birnstiel, T., Stammler, S. M., & Günther, H. M. 2019, ApJ, 871, 53 [NASA ADS] [CrossRef] [Google Scholar]
- Ghez, A. M., White, R. J., & Simon, M. 1997, ApJ, 490, 353 [NASA ADS] [CrossRef] [Google Scholar]
- Grinin, V. P., Kiselev, N. N., Minikulov, N. K., Chernova, G. P., & Voshchinnikov, N. V. 1991, Ap&SS, 186, 283 [NASA ADS] [CrossRef] [Google Scholar]
- Günther, H. M., Birnstiel, T., Huenemoerder, D. P., et al. 2018, AJ, 156, 56 [NASA ADS] [CrossRef] [Google Scholar]
- Ilee, J. D., Fairlamb, J., Oudmaijer, R. D., et al. 2014, MNRAS, 445, 3723 [NASA ADS] [CrossRef] [Google Scholar]
- Ingleby, L., Calvet, N., Herczeg, G., et al. 2013, ApJ, 767, 112 [NASA ADS] [CrossRef] [Google Scholar]
- Jäger, C., Il’in, V. B., Henning, T., et al. 2003, J. Quant. Spectr. Rad. Transf., 79, 765 [NASA ADS] [CrossRef] [Google Scholar]
- Joy, A. H. 1945, ApJ, 102, 168 [NASA ADS] [CrossRef] [Google Scholar]
- Kraus, M., Krügel, E., Thum, C., & Geballe, T. R. 2000, A&A, 362, 158 [NASA ADS] [Google Scholar]
- Krügel, E. 2008, An Introduction to the Physics of Interstellar Dust (Boca Raton, Florida: CRC Press), 377 [Google Scholar]
- Krügel, E. 2009, A&A, 493, 385 [NASA ADS] [CrossRef] [EDP Sciences] [Google Scholar]
- Lamzin, S., Cheryasov, D., Chuntonov, G., et al. 2017, in Stars: From Collapse to Collapse, eds. Y. Y. Balega, D. O. Kudryavtsev, I. I. Romanyuk, & I. A. Yakunin, ASP Conf. Ser., 510, 356 [NASA ADS] [Google Scholar]
- Lodders, K. 2003, ApJ, 591, 1220 [NASA ADS] [CrossRef] [Google Scholar]
- López-Martín, L., Cabrit, S., & Dougados, C. 2003, A&A, 405, L1 [NASA ADS] [CrossRef] [EDP Sciences] [Google Scholar]
- McClure, M. K., D’Alessio, P., Calvet, N., et al. 2013, ApJ, 775, 114 [NASA ADS] [CrossRef] [Google Scholar]
- Miyake, T., Suzuki, T. K., & Inutsuka, S.-i. 2016, ApJ, 821, 3 [NASA ADS] [CrossRef] [EDP Sciences] [Google Scholar]
- Mulders, G. D., Min, M., Dominik, C., Debes, J. H., & Schneider, G. 2013, A&A, 549, A112 [NASA ADS] [CrossRef] [EDP Sciences] [Google Scholar]
- Muzerolle, J., Calvet, N., Hartmann, L., & D’Alessio, P. 2003, ApJ, 597, L149 [NASA ADS] [CrossRef] [Google Scholar]
- Nixon, C. J., & Pringle, J. E. 2010, MNRAS, 403, 1887 [NASA ADS] [CrossRef] [Google Scholar]
- Papaloizou, J. C. B., & Lin, D. N. C. 1995, ApJ, 438, 841 [NASA ADS] [CrossRef] [Google Scholar]
- Petrov, P. P., Gahm, G. F., Gameiro, J. F., et al. 2001, A&A, 369, 993 [NASA ADS] [CrossRef] [EDP Sciences] [Google Scholar]
- Petrov, P. P., Gahm, G. F., Djupvik, A. A., et al. 2015, A&A, 577, A73 [NASA ADS] [CrossRef] [EDP Sciences] [Google Scholar]
- Pomohaci, R., Oudmaijer, R. D., Lumsden, S. L., Hoare, M. G., & Mendigutía, I. 2017, MNRAS, 472, 3624 [NASA ADS] [CrossRef] [Google Scholar]
- Rigliaco, E., Pascucci, I., Gorti, U., Edwards, S., & Hollenbach, D. 2013, ApJ, 772, 60 [NASA ADS] [CrossRef] [Google Scholar]
- Rodriguez, J. E., Pepper, J., Stassun, K. G., et al. 2013, AJ, 146, 112 [NASA ADS] [CrossRef] [Google Scholar]
- Rodriguez, J. E., Pepper, J., Stassun, K. G., et al. 2015, AJ, 150, 32 [NASA ADS] [CrossRef] [Google Scholar]
- Rodriguez, J. E., Reed, P. A., Siverd, R. J., et al. 2016, AJ, 151, 29 [NASA ADS] [CrossRef] [Google Scholar]
- Rodriguez, J. E., Loomis, R., Cabrit, S., et al. 2018, ApJ, 859, 150 [NASA ADS] [CrossRef] [Google Scholar]
- Schneider, P. C., Günther, H. M., Robrade, J., et al. 2015, A&A, 584, L9 [NASA ADS] [CrossRef] [EDP Sciences] [Google Scholar]
- Shenavrin, V. I., Petrov, P. P., & Grankin, K. N. 2015, IBVS, 6143, 1 [NASA ADS] [Google Scholar]
- Takami, M., Wei, Y.-J., Chou, M.-Y., et al. 2016, ApJ, 820, 139 [NASA ADS] [CrossRef] [Google Scholar]
- van Dishoeck, E. F., & Black, J. H. 1988, ApJ, 334, 771 [NASA ADS] [CrossRef] [Google Scholar]
- Vernet, J., Dekker, H., D’Odorico, S., et al. 2011, A&A, 536, A105 [NASA ADS] [CrossRef] [EDP Sciences] [Google Scholar]
- White, R. J., & Ghez, A. M. 2001, ApJ, 556, 265 [Google Scholar]
- Woitas, J., Leinert, C., & Köhler, R. 2001, A&A, 376, 982 [NASA ADS] [CrossRef] [EDP Sciences] [Google Scholar]
All Tables
All Figures
|
Fig. 1 Light curve of the RW Aur system in the visual. The plot is taken from The American Association of Variable Star Observers (AAVSO). The red dots indicate the time of our observations. The magnitudes for the two epochs were computed by producing synthetic photometry from the spectra. |
| In the text | |
|
Fig. 2 Whole X-shooter spectrum for the bright (red) and the dim (black) state in the wavelength range of 0.3–2.4 μm. The y-axis is in logarithmic scale. A zoom-in of the spectra is shown in the appendix. |
| In the text | |
|
Fig. 3 CO continuum-subtracted spectrum of RW Aur A for the bright state. The spectrum has been normalised to the second bandhead. The Earth symbol shows regions with strong telluric features. |
| In the text | |
|
Fig. 4 Representative model and data of the bright state of the spectrum. Blue corresponds to the model and red to the observations. The intensity is normalised to the second bandhead and the wavelength is in microns. Five bandheads are shown (υ = 2- 0, 3-1, 4-2, 5-3, and 6-4). The parameters of the model are listed in Table 2. This particular case is for T = 3000 K, NCO = 8 × 1020 cm−2, and vk sin i = 113 km s−1. |
| In the text | |
|
Fig. 5 First three bandheads of the dim state in black. In blue we plot the best-fit model of the bright state as in Fig. 4. |
| In the text | |
|
Fig. 6 J components for the first bandhead for different vk sin i. The spectra are shifted to facilitate comparison. The dashed vertical line corresponds to the intrinsic wavelength of one of the J components. |
| In the text | |
|
Fig. 7 Top panel: effective optical depth of the dimming layer vs. wavelength computed from the ratio of the dim to the bright X-shooter spectra. The red circles are the median of the values over intervals of 5 Å, the error is the standard deviation within the interval. The triangles show the optical depth derived from the ratio of the CObandheads, computed as the median of three points around the peak of the first two bandheads. The black crosses correspond to continuum points in the spectrum. Bottom panel: the red points (circles and triangles) are the same as in the top panel. The black dashed line is the Cardelli extinction law for RV = 3.1 (Cardelli et al. 1989). The green curves plot Qabs (dashed), Qscat (dotted), and Qtot = Qabs + 0.12Qscat (solid) for a distribution of olivine with minimum and maximum size amin = 0.1 μm, amax = 150 μm, q = 3 (see text). The blue curve plot Qtot = Qabs + Qscat (solid) for the same material, amin = 0.06 μm, amax = 0.1 μm, q = 3. All curves are normalised to the observed optical depth at 0.58 μm. |
| In the text | |
|
Fig. 8 X-shooter spectral energy distribution of the bright state is shown in red. The red triangles show the WISE flux obtained in March 2014, when RW Aur A was in a bright state, assuming that half of the flux is contributed by RW Aur B, which is included in the WISE beam. The green curves show the photosphere, approximated by a black-body with T = 4900 K and L = 1 L⊙, and the total emission of the photosphere plus an additional black-body at T = 1180 K and Area = ~5.6 × 1024 cm2. The X-shooter spectrum in the dim state is shown in black. The black triangles arethe WISE fluxes, computed assuming that RW Aur B does not vary during the period of the observations. The blue curves show the photosphere and the best-fitting model of the bright state emission reddened according to the extinction curve derived in Sect. 3.3. |
| In the text | |
|
Fig. 9 Left panel: accretion luminosities versus wavelength for the bright state. The fluxes of the optical lines have been corrected for Av = 0.4 (White & Ghez 2001). Right panel: accretion luminosities versus wavelength for the dim state. The fluxes have been corrected for the observed extinction curve of Fig. 7. |
| In the text | |
|
Fig. A.1 Zoom into the X-shooter spectra from 0.3–2.4 μm. The bright state is shown in red and the dim state in black. |
| In the text | |
|
Fig. A.2 Continuum-subtracted spectra of the CO-emitting regions in the bright (red) and dim (black) states. The spectra are normalised in the second bandhead. |
| In the text | |
Current usage metrics show cumulative count of Article Views (full-text article views including HTML views, PDF and ePub downloads, according to the available data) and Abstracts Views on Vision4Press platform.
Data correspond to usage on the plateform after 2015. The current usage metrics is available 48-96 hours after online publication and is updated daily on week days.
Initial download of the metrics may take a while.