Fig. 8
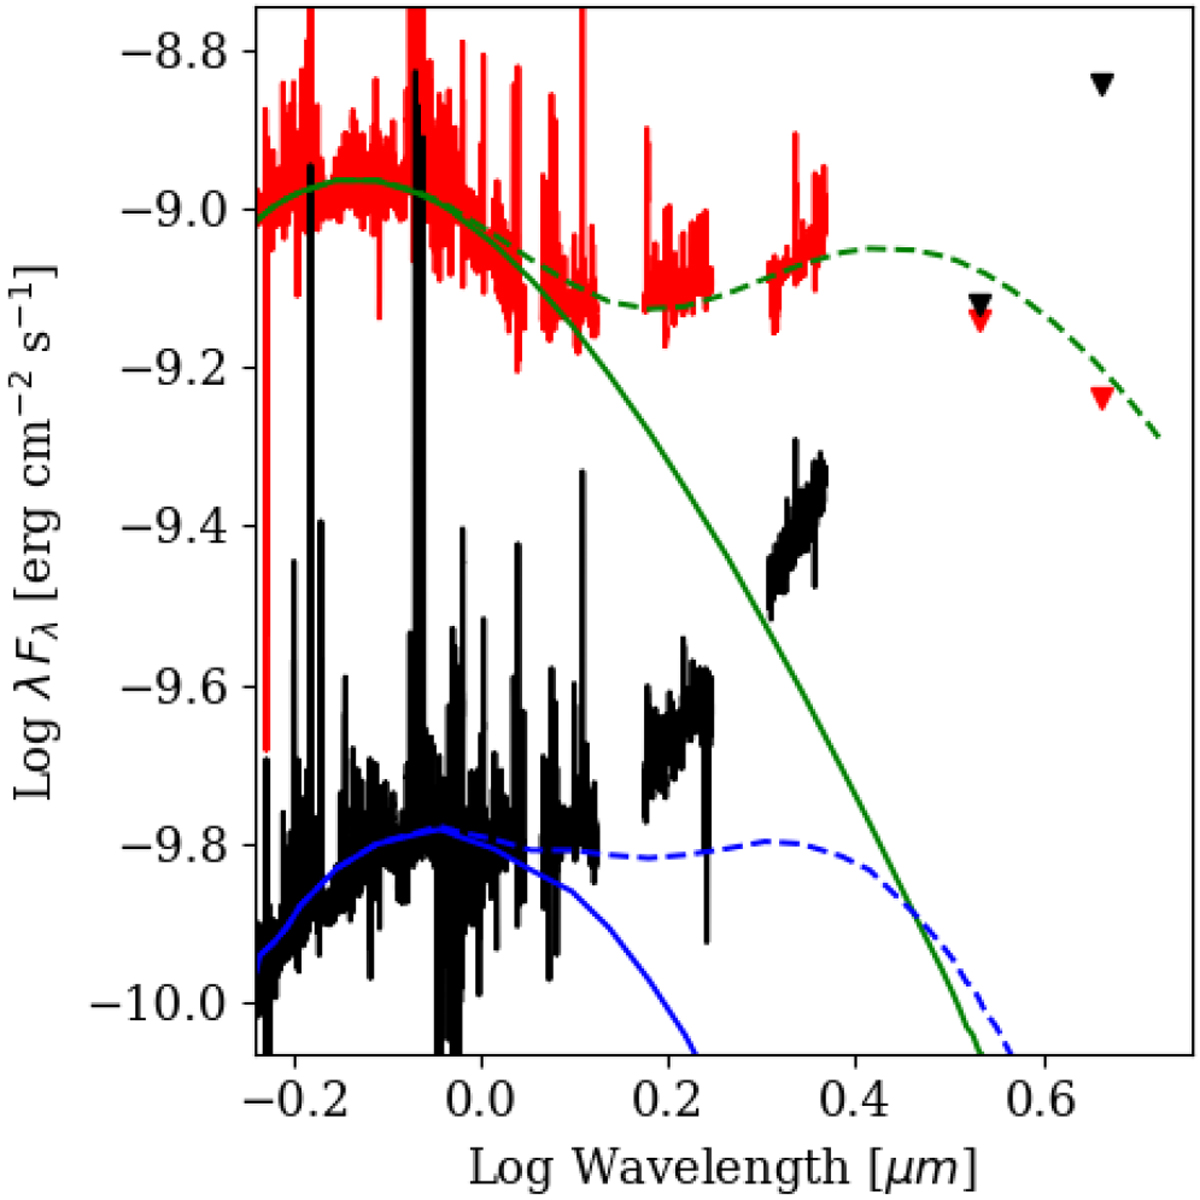
X-shooter spectral energy distribution of the bright state is shown in red. The red triangles show the WISE flux obtained in March 2014, when RW Aur A was in a bright state, assuming that half of the flux is contributed by RW Aur B, which is included in the WISE beam. The green curves show the photosphere, approximated by a black-body with T = 4900 K and L = 1 L⊙, and the total emission of the photosphere plus an additional black-body at T = 1180 K and Area = ~5.6 × 1024 cm2. The X-shooter spectrum in the dim state is shown in black. The black triangles arethe WISE fluxes, computed assuming that RW Aur B does not vary during the period of the observations. The blue curves show the photosphere and the best-fitting model of the bright state emission reddened according to the extinction curve derived in Sect. 3.3.
Current usage metrics show cumulative count of Article Views (full-text article views including HTML views, PDF and ePub downloads, according to the available data) and Abstracts Views on Vision4Press platform.
Data correspond to usage on the plateform after 2015. The current usage metrics is available 48-96 hours after online publication and is updated daily on week days.
Initial download of the metrics may take a while.