Fig. 4
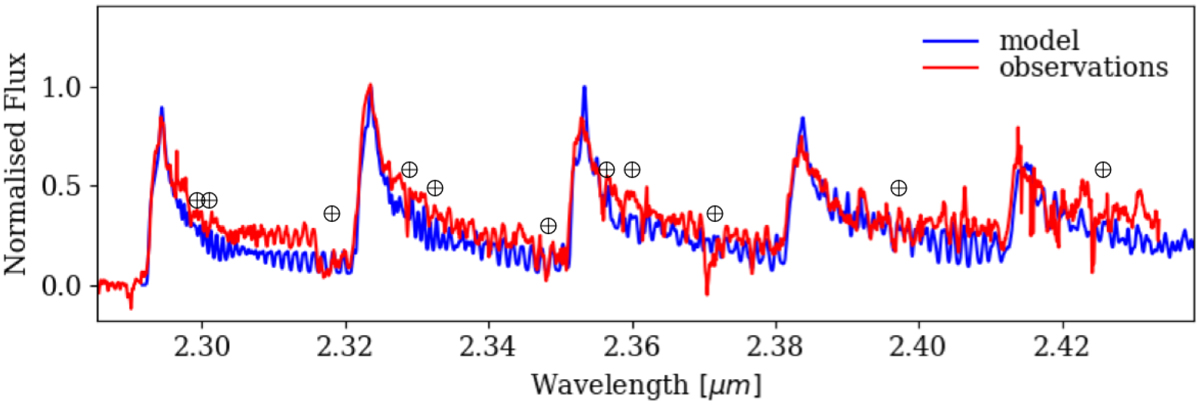
Representative model and data of the bright state of the spectrum. Blue corresponds to the model and red to the observations. The intensity is normalised to the second bandhead and the wavelength is in microns. Five bandheads are shown (υ = 2- 0, 3-1, 4-2, 5-3, and 6-4). The parameters of the model are listed in Table 2. This particular case is for T = 3000 K, NCO = 8 × 1020 cm−2, and vk sin i = 113 km s−1.
Current usage metrics show cumulative count of Article Views (full-text article views including HTML views, PDF and ePub downloads, according to the available data) and Abstracts Views on Vision4Press platform.
Data correspond to usage on the plateform after 2015. The current usage metrics is available 48-96 hours after online publication and is updated daily on week days.
Initial download of the metrics may take a while.