Fig. 7
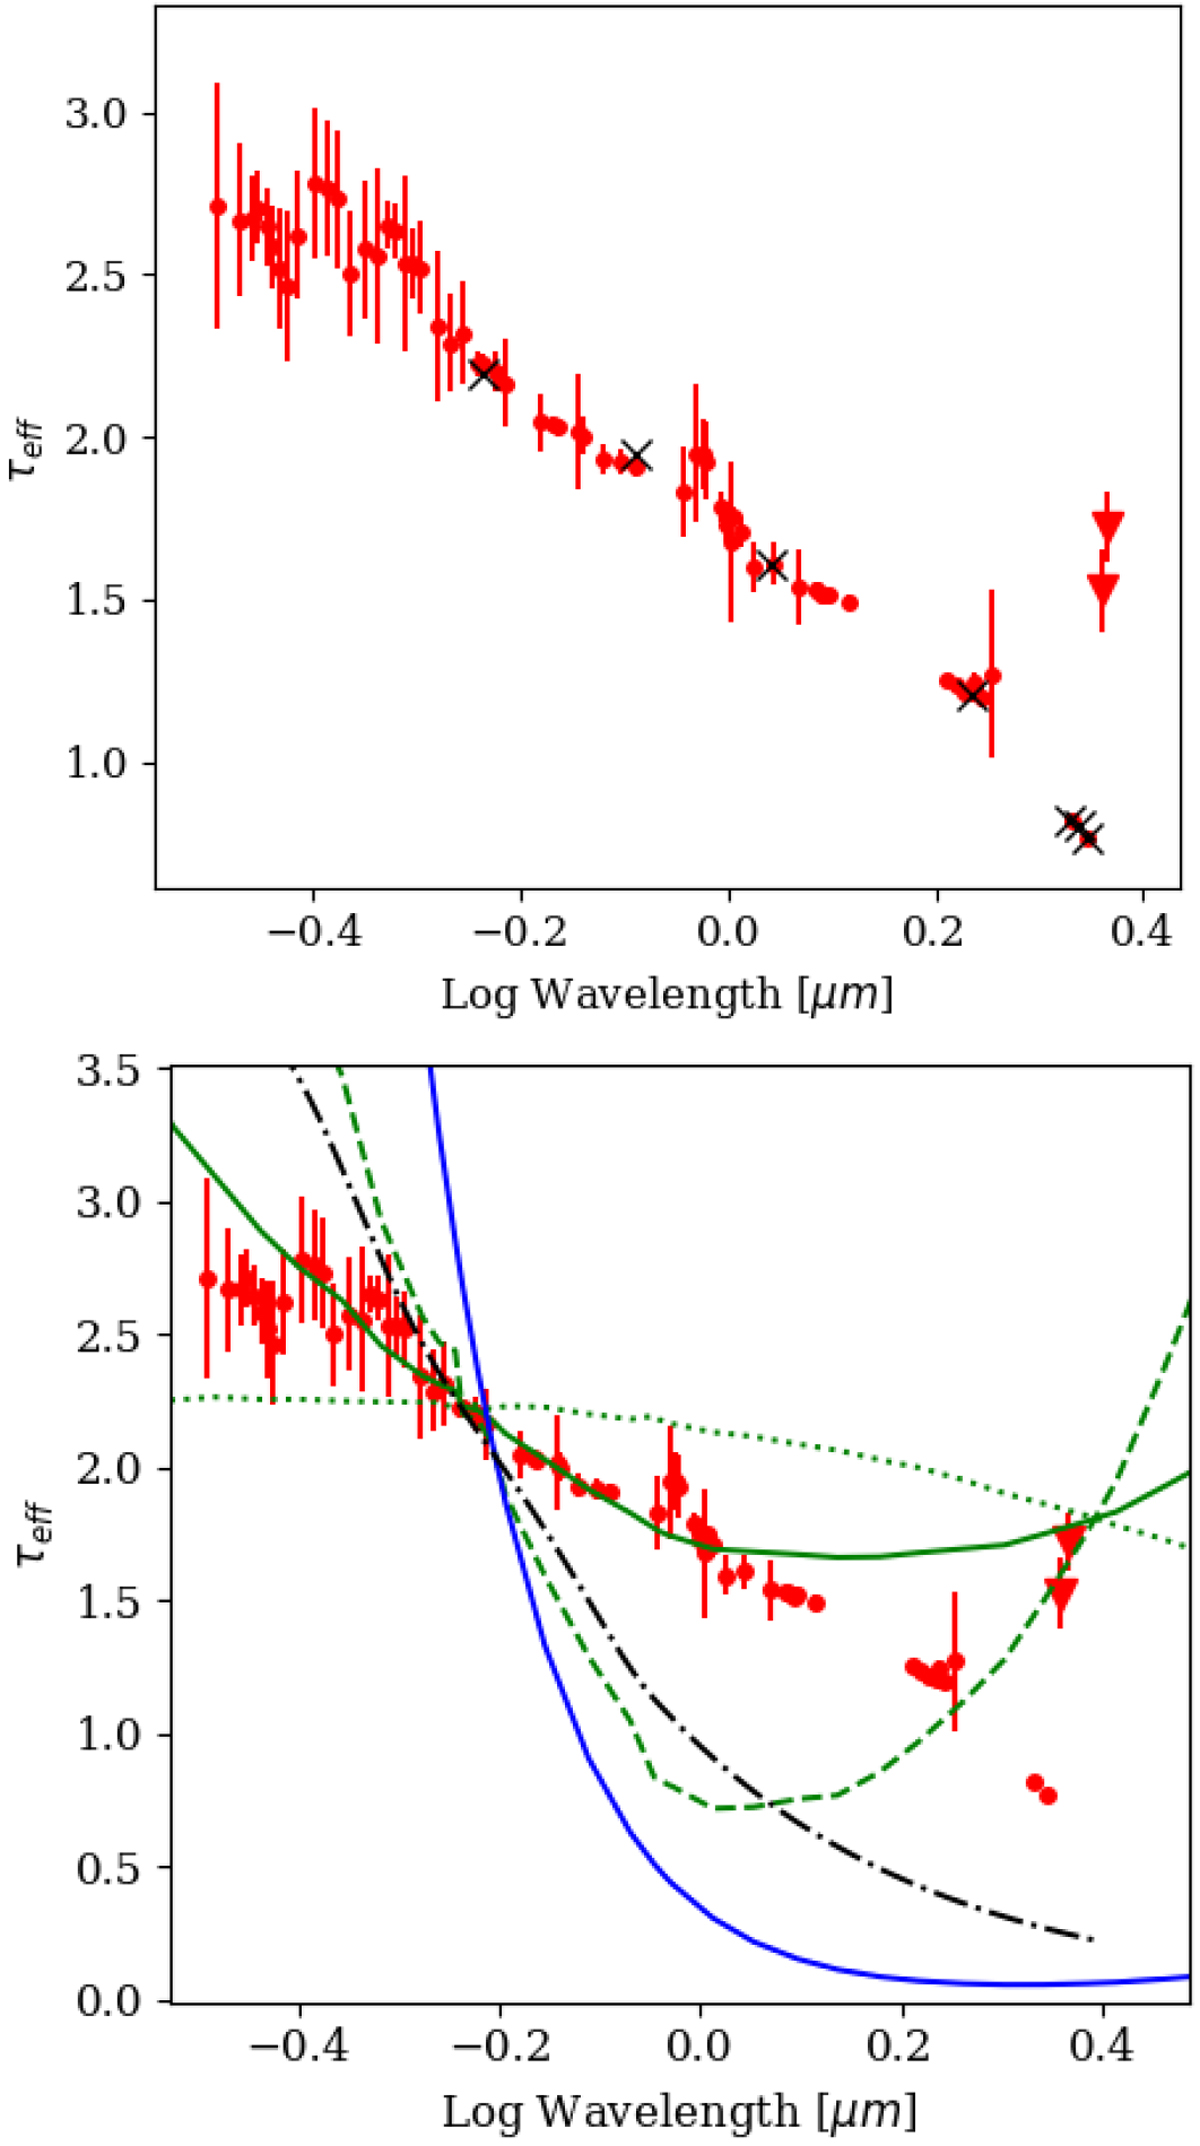
Top panel: effective optical depth of the dimming layer vs. wavelength computed from the ratio of the dim to the bright X-shooter spectra. The red circles are the median of the values over intervals of 5 Å, the error is the standard deviation within the interval. The triangles show the optical depth derived from the ratio of the CObandheads, computed as the median of three points around the peak of the first two bandheads. The black crosses correspond to continuum points in the spectrum. Bottom panel: the red points (circles and triangles) are the same as in the top panel. The black dashed line is the Cardelli extinction law for RV = 3.1 (Cardelli et al. 1989). The green curves plot Qabs (dashed), Qscat (dotted), and Qtot = Qabs + 0.12Qscat (solid) for a distribution of olivine with minimum and maximum size amin = 0.1 μm, amax = 150 μm, q = 3 (see text). The blue curve plot Qtot = Qabs + Qscat (solid) for the same material, amin = 0.06 μm, amax = 0.1 μm, q = 3. All curves are normalised to the observed optical depth at 0.58 μm.
Current usage metrics show cumulative count of Article Views (full-text article views including HTML views, PDF and ePub downloads, according to the available data) and Abstracts Views on Vision4Press platform.
Data correspond to usage on the plateform after 2015. The current usage metrics is available 48-96 hours after online publication and is updated daily on week days.
Initial download of the metrics may take a while.