| Issue |
A&A
Volume 623, March 2019
|
|
|---|---|---|
| Article Number | A83 | |
| Number of page(s) | 19 | |
| Section | Stellar structure and evolution | |
| DOI | https://doi.org/10.1051/0004-6361/201834245 | |
| Published online | 08 March 2019 | |
A VLT/FLAMES survey for massive binaries in Westerlund 1
V. The X-ray selected blue stragglers Wd1-27 and -30a⋆⋆⋆
1
School of Physical Science, The Open University, Walton Hall, Milton Keynes MK7 6AA, UK
e-mail: This email address is being protected from spambots. You need JavaScript enabled to view it.
2
Departamento de Astrofísica, Centro de Astrobiología, (CSIC-INTA), Ctra. Torrejón a Ajalvir, km 4, 28850 Torrejón de Ardoz, Madrid, Spain
3
Departamento de Física Aplicada, Facultad de Ciencias, Universidad de Alicante, Carretera San Vicente del Raspeig s/n, 03690 San Vicente del Raspeig, Spain
4
Institute of Astronomy, University of Cambridge, Madingley Road, Cambridge CB3 0HA, UK
Received:
14
September
2018
Accepted:
12
November
2018
Abstract
Context. Recent observational studies indicate that a large number of OB stars are found within binary systems which may be expected to interact during their lifetimes. Significant mass transfer or indeed merger of both components is expected to modify evolutionary pathways, facilitating the production of exceptionally massive stars which will present as blue stragglers. Identification and characterisation of such objects is crucial if the efficiency of mass transfer is to be established; a critical parameter in determining the outcomes of binary evolutionary channels.
Aims. The young and coeval massive cluster Westerlund 1 hosts a rich population of X-ray bright OB and Wolf–Rayet stars where the emission is attributed to shocks in the wind collision zones of massive binaries. Motivated by this, we instigated a study of the extremely X-ray luminous O supergiants Wd1-27 and -30a.
Methods. We subjected a multi-wavelength and -epoch photometric and spectroscopic dataset to quantitative non-LTE model atmosphere and time-series analysis in order to determine fundamental stellar parameters and search for evidence of binarity. A detailed examination of the second Gaia data release was undertaken to establish cluster membership.
Results. Both stars were found to be early/mid-O hypergiants with luminosities, temperatures and masses significantly in excess of other early stars within Wd1, hence qualifying as massive blue stragglers. The binary nature of Wd1-27 remains uncertain but the detection of radial velocity changes and the X-ray properties of Wd1-30a suggest that it is a binary with an orbital period ≤10 days. Analysis of Gaia proper motion and parallactic data indicates that both stars are cluster members; we also provide a membership list for Wd1 based on this analysis.
Conclusions. The presence of hypergiants of spectral types O to M within Wd1 cannot be understood solely via single-star evolution. We suppose that the early-B and mid-O hypergiants formed via binary-induced mass-stripping of the primary and mass-transfer to the secondary, respectively. This implies that for a subset of objects massive star-formation may be regarded as a two-stage process, with binary-driven mass-transfer or merger yielding stars with masses significantly in excess of their initial “birth” mass.
Key words: blue stragglers / binaries: general / stars: early-type / stars: evolution / stars: individual: Wd1-27 / stars: individual: Wd1-30a
Reduced spectra are only available at the CDS via anonymous ftp to cdsarc.u-strasbg.fr (130.79.128.5) or via http://cdsarc.u-strasbg.fr/viz-bin/qcat?J/A+A/623/A83
Based on observations made at the European Southern Observatory, Paranal, Chile under programs ESO 081.D-0324, 383.D-0633, 087.D-0440, 091.D-0179, and 097.D-0367.
© ESO 2019
1. Introduction
Given the importance of radiative and mechanical feedback from massive stars to galactic evolution, and their role as the progenitors of electromagnetic and, ultimately, gravitational wave transients, current uncertainties regarding the physics of many stages of their lifecycles is a serious concern. A particular issue is the mechanism by which they form. Reviews of this process by Zinnecker & Yorke (2007) and Krumholz (2015) suggest two “families” of models – accretion or merger. The first comprises both the fragmentation and subsequent monolithic collapse of a molecular cloud – essentially a scaled-up version of low-mass star-formation – and the competitive accretion scenario of Bonnell et al. (2001), which occurs in a (proto-)clustered environment. The second scenario envisages the formation of very massive objects by the merger of lower-mass (proto-)stars (e.g. Bonnell et al. 1998); under such a scenario massive star formation becomes a multi-stage process.
However, as with competitive accretion, collisional merger requires (exceptionally) dense stellar environments to be viable, and it is not clear that even clusters as extreme as the Arches and R136 supply the required conditions (Krumholz 2015). Moreover recent observational findings challenge the assertion that massive stars form exclusively in highly clustered environments, with Rosslowe & Crowther (2018) reporting that only ∼25% of galactic Wolf–Rayets (WRs) are associated with young massive clusters (YMCs). Wright et al. (2016) demonstrate that the Cyg OB2 association – and the high-mass stars that formed within it – did not originate in high-density clusters that subsequently dissolved into the wider environment, instead being born in the current dispersed configuration.
Nevertheless, there has been considerable recent interest in a variant of the merger scenario, in which binary interaction leads to the rejuvenation of the binary product via mass transfer and/or merger (e.g. van Bever & Vanbeveren 1998)1. Such attention has been driven by two related observational assertions; that the core of R136 may contain a handful of stars with masses exceeding the canonical upper mass limit of ∼150 M⊙ (Crowther et al. 2010; Oey & Clarke 2005) and that the most massive stars in e.g. the Arches and Quintuplet YMCs appear younger than lower-mass cluster members (e.g. Martins et al. 2008; Liermann et al. 2012; but see Sect. 5.2 for discussion of recent countervailing analyses). Schneider et al. (2014a; 2015; see also de Mink et al. 2014) were able to replicate these findings under the assumption of high binary fractions for both clusters, with the most luminous stars being post-binary interaction systems; essentially the high-mass analogues of the classical “blue stragglers” seen in globular clusters (e.g. Sandage 1953).
That binary-driven mass transfer or merger should lead to rejuvenation is an uncontroversial statement, with both Algols and W Serpentis stars serving as exemplars (e.g. Tarasov 2000). A more massive analogue would be the interacting binary RY Scuti, where the primary is less massive than the secondary, which is currently veiled by an accretion disc (e.g. 7.1 ± 1.2 M⊙ and 30.0 ± 2.1 M⊙; Grundstrom et al. 2007). An example of a massive post-interaction system is NGC346-13, where the more evolved early-B giant is less massive than its late-O dwarf companion (11.9 ± 0.6 M⊙ and 19.1 ± 1.0 M⊙; Ritchie et al. 2012). Unfortunately RY Scuti is not associated with a cluster, while NGC 346 has experienced a complex star formation history over at least 6 Myr (Cignoni et al. 2011). As a consequence it is difficult to reconstruct the mass-transfer history of either system to determine the quantity of mass transferred to the secondary (and that lost to the system) and hence whether they represent ‘bona fide’ massive blue stragglers; one is instead forced to rely on theoretical predictions (e.g. Petrovic et al. 2005) which are inevitably subject to uncertainties in the input physics.
Given its comparative youth and exceptional integrated mass, the galactic cluster Westerlund 1 (Wd1) would appear to be an ideal laboratory to search for the products of binary interaction (Clark et al. 2005). It appears to be highly co-eval (Negueruela et al. 2010; Kudryavtseva et al. 2012) and, as a result, is characterised by a remarkably homogeneous population of early supergiants, extending smoothly in spectral morphology from ∼O9.5-B4 Ia (Negueruela et al. 2010; Clark et al. 2015). Intensive multiwavelength and multi-epoch observational campaigns (e.g. Clark et al. 2008, 2011, 2019; Ritchie et al. 2009a, 2010, and in prep.) have revealed a rich binary population comprising pre-interaction (e.g. Wd1-43a; Ritchie et al. 2011), interacting (Wd1-9; Clark et al. 2013; Fenech et al. 2017) and post-interaction binaries (Wd1-13 and -239; Ritchie et al. 2010; Clark et al. 2011).
Historically X-ray data have proved extremely useful in identifying massive interactive binaries. Single OB stars are expected to emit X-rays of luminosity LX ∼ 10−7 Lbol via shocks embedded within their stellar winds (Long & White 1980; Lucy & White 1980; Seward & Chlebowski 1982; Berghoefer et al. 1997). Detailed analyses reveal thermal spectra for such sources, with a characteristic energy of kT = 0.6 keV (Gayley & Owocki 1995; Feldmeier et al. 1997). Stars demonstrating greater luminosities and/or harder X-ray spectra are typically assumed to be massive binaries, with the excess (hard) emission arising in shocks generated by their colliding winds.
For stellar luminosities of Lbol ∼ 6 × 10⁵ L⊙ we would expect LX ∼ 2 × 1032 erg s−1 for single late-O/early B supergiants within Wd1 (Negueruela et al. 2010). However a number of supergiants are found to be more luminous than this, with Wd1-27 and -53 approaching and Wd1-30a and -36 in excess of LX ∼ 1033 erg s−1 (Clark et al. 2008, 2019). Of these the X-ray spectra of Wd1-27, -36 and -53 are comparatively soft (kT ∼ 0.5−0.7 keV) and hence consistent with emission from a single star while, with kT = 1.3 ± 0.1keV, the emission from Wd1-30 is substantially harder than this expectation. Photometric monitoring of Wd1-36 and -53 reveals periodic modulation with periods of 3.18d and 1.3d respectively (Bonanos 2007). Wd1-36 is clearly an eclipsing system, while the lightcurve of Wd-53 likely results from ellipsoidal modulation; hence both appear compelling binary candidates. However to date there is no corroborative evidence for binarity for Wd1-27 and -30a and in this paper we investigate their nature with a multi-epoch optical and near-IR (NIR) spectroscopic dataset.
2. Data acquisition and reduction
2.1. Spectroscopy
A single spectrum of Wd1-27 was obtained on 2006 February 17 with the NTT/EMMI with grism #6 covering the range 5800–8650 Å at a resolution R ∼ 1500; reduction details may be found in Negueruela et al. (2010). This is presented in Fig. 1 and encompasses the prime mass-loss diagnostic Hα, the higher Paschen series and a selection of He I and He II photospheric features.
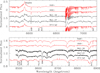 |
Fig. 1. R- and I-band spectra of Wd1-27 and -30a (black) with prominent transitions indicated (note the difference in spectral resolutions between the two observations). Template spectra of HD 15570 (O4 If+), HD 14947 (O5 If+) and HD 192639 (O7.5 Iaf) are shown for comparison (red). |
Subsequently one and three epochs of I−band observations were made during 2011 and 2013 April–September, respectively, with VLT/FLAMES. We utilised the GIRAFFE spectrograph in MEDUSA mode with setup HR21 to cover the 8484–9001 Å range with resolution R ∼ 16 200; full details of data acquisition and reduction are given in Ritchie et al. (2009a). The resultant spectra encompass the Paschen series photospheric lines and were obtained with the intention of searching for radial velocity (RV) variability. However the presence of temperature sensitive He I photospheric features also permits spectral classification utilising such data (e.g. Clark et al. 2005).
A further three spectra were obtained between 2016 May and June with VLT/UVES (Dekker et al. 2000). In each observation run, two 1482 s exposures were taken sequentially, and the blue and red arms were operated in parallel using the dichroic beam splitter, resulting in usable wavelength coverage over the ranges ∼5695−7530 Å and ∼7660−9460 Å. The 0.7″ slit was used, giving a resolving power R ∼ 60 000. Basic reductions (bias subtraction, interorder background subtraction, flat-field correction, echelle order extraction, sky subtraction, rebinning to wavelength scale and order merging) were carried out using the ESO UVES pipeline software (version 5.7.0) running under Gasgano. A custom IDL code was then used to identify and remove bad lines by comparing the two exposures for each epoch, before summing the cleaned spectra.
Turning to Wd1-30a and eleven epochs of I-band spectroscopy, also utilising the GIRAFFE+HR21 configuration of VLT/FLAMES, were made between 2008 June and 2009 August, with a further five epochs between 2013 April and September. These were supplemented by a single observation with VLT/FLAMES with the low-resolution grating LR6, yielding an R-band spectrum with a wavelength range of 6438–7184 Å at a resolution of R ∼ 8500 that was designed to sample Hα. Examples of the former and latter spectra are presented in Fig. 1.
Finally, K-band spectra of Wd1-27, 30a and other evolved stars within Wd1 were obtained with VLT/ISAAC between 2004 August 1–3 under programme 073.D-0837 and were extracted from the ESO archive. Observations were made in the short wavelength mode and employed the medium resolution grating with a central wavelength of 2.13825 μm and 0.6″ slit, yielding a resolution of R ∼ 4400 between ∼2.077−2.199 μm. The spectra were reduced and extracted using the ISAAC pipeline provided by ESO. Due to the high stellar density, often two or more objects fall into the slit, and particular care was taken in extracting all these secondary spectra, along with the identification of the corresponding sources. The wavelength calibration was refined using the abundant telluric features present in the NIR, and a transmission curve of the atmosphere+telescope system built using observations of telluric standards. These comprised both early-type and solar-like stars; for the latter the subtle mismatches between the stellar absorption lines in each adopted model and the observed standard were corrected by fitting these lines using a family of gaussians. Observations of targets were corrected utilising the resultant transmission curves before continuum nomalisation was undertaken. A subset of the resulting spectra are presented in Fig. 2, comprising Wd1-27, -30a and a representative group of supergiants in order to place these into context.
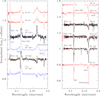 |
Fig. 2. Left panel: K-band spectra of Wd1-27 and -30a (black) with prominent transitions indicated. Template spectra of HD 15570 (O4 If+), HD 14947 (O5 If+) and HD 192639 (O7.5 Iaf) shown for comparison (red; data from Hanson et al. 2005). Additional comparators from the Arches cluster are plotted in blue (data from Clark et al. 2018a). Right panel: spectra of “representative” early-B cluster supergiants Wd1-28, -41 and -78 shown for comparison (black) with additional template spectra (red; Hanson et al. 2005) of HD 30614 (O9 Ia), HD 154368 (O9.5 Iab), HD 37128 (B0 Ia), HD 115842 (B0.5 Ia), HD 13854 (B1 Iab) and HD 134959 (B2 Ia). |
2.2. Photometry
Optical and NIR photometry derive from Clark et al. (2005), Negueruela et al. (2010) and Crowther et al. (2006a) and are summarised in Table 1. Due to crowding and saturation no mid-IR fluxes may be determined for either source. Wd1-30a has a 3 mm flux of 0.17 ± 0.06 mJy (Fenech et al. 2018), while Wd1-27 is a non-detection with a 3σ upper limit of 0.13 mJ; neither star is detected at radio wavelengths (3.6 cm and longer) with 3σ upper limits of 0.17 mJy (Dougherty et al. 2010).
Optical and NIR photometry.
Finally, neither star is reported to be a short- or long-term photometric variable (timescale of ∼days and ∼years respectively; Bonanos 2007; Clark et al. 2010).
3. Observational properties and cluster membership
3.1. Spectral classification
Turning first to the optical spectra of both Wd1-27 and -30a (Fig. 1) and the Hα profiles in both stars appear somewhat broader than those of the late-O/early-B supergiants that characterise Wd1 (Negueruela et al. 2010), being suggestive (at best) of an earlier spectral type. Inflections in the profiles appear likely to be the result of P Cygni absorption (∼6558 Å) and He II photospheric absorption (∼6527.7 Å versus a rest wavelength of 6527 Å). The features at ∼6681.5 Å may represent blends of the He I 6678Å and He I 6683 Å lines, while the strong He I 7065 Å photospheric line is present in both stars.
Moving to the I-band and the photometric Paschen series lines in both systems are seen to be anomalously weak in comparison to the majority of other late-O/early-B supergiants within Wd1 (e.g. Ritchie et al. 2009a); consistent with an earlier spectral classifiction (Fig. 1). However this phenomenon has also been observed in binaries, notably the similarly X-ray bright system Wd1-36 (Clark et al. 2015, 2019), although in this case the profiles of the stronger Paschen lines appear notably broader than seen in Wd1-27 and -30a, suggestive of contributions from two stellar components. With the possible exception of He I 8777 Å and He I 8847 Å in Wd1-27, none of the other He I photospheric features (e.g. 8583 Å and 8733 Å) that characterise O9.5-B2.5 supergiants are present (Ritchie et al. 2009a; Negueruela et al. 2010).
However the K-band spectra are the most diagnostically valuable. Specifically, the presence of strong C IV 2.079 μm emission and He II 2.189 μm absorption unambiguously exclude classifications of O9 Ia or later (cf. Fig 2). Indeed, while weak He II 2.189 μm absorption is present in the template spectra of O9-9.5 Ia stars, it is absent for the remaining supergiants within Wd1 for which K-band spectra are available. In combination with these features, the presence of pronounced emission in the He I+N III ∼2.11 μm blend argues for a mid-O classification for Wd1-30a. Combined with weaker C IV emission, the increased strength of He I 2.112 μm photospheric absorption in Wd1-27 suggests a slightly later classification for that star. Finally, while the narrow Brγ emission component seen in Wd1-27 is present in a subset of the spectra of supergiants over a wide range of spectral types (mid-O to early-B), the strong, pure emission line present in Wd1-30a is restricted to high-luminosity early-mid O super-/hypergiants (Hanson et al. 2005; Clark et al. 2018a,b). Indeed, employing the scheme utilised for the Arches cluster (Clark et al. 2018a) and K-band spectra from that work as classification templates we assign O4-5 Ia+ and O7-8 Ia+ for Wd1-30a and -27, respectively.
These classifications are consistent with the properties of the optical spectra, but are substantially earlier than the remaining late-O/early-B super-/hypergiant population of Wd1 which, as can be seen from Fig. 2, are well represented by the B0-1 Ia(b) K-band templates of Hanson et al. (2005). Indeed, both Wd1-27 and -30a would appear to fit seamlessly into the stellar population of the Arches cluster (Fig. 2), which at ∼2−3 Myr is significantly younger than Wd1 (Clark et al. 2005, 2018a). Finally, we see no evidence for a putative binary companion in the spectra of either star.
3.2. Spectral variability
Considering Wd1-27 first and the seven epochs of I-band spectra were searched for RV variability. The RVs measurements were based on Levenberg-Marquardt nonlinear least-squares fits to Lorentzian profiles for Pa11 and Pa13, with errors based on the internal statistical fit. No statistical robust RV variability was identified. Both the Pa11 and Pa13 lines are well defined and of high S/N (cf. Fig. 3) and the presence of a DIB at 8620Å provides an excellent check for zero-point errors in the reduction and wavelength calibration; as a consequence we consider this conclusion to be robust. Thus Wd1-27 would appear to be either a single star - potentially in tension with its X-ray properties – or a binary seen under an unfavourable inclination and/or with a low-mass companion.
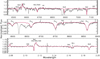 |
Fig. 3. Comparison of the synthetic spectrum of Wd1-27 derived from model-atmosphere analysis (red line) to observational data (black solid line). See Sect. 4 for further details. The units of wavelength for the top and middle panels are Angstroms and the bottom panel microns. |
Turning to Wd1-30a which, as described in Negueruela et al. (2010), appears spectroscopically variable. Specifically the emission line profile of Hα appears changeable on short (∼day) timescales (Fig. 4), while in the I-band data there is also the suggestion of He II 8236 Å in some spectra and changes in the strength of the C III 8500 Å line. Examining the I-band data and despite the weak Paschen series lines we can rule out the null hypothesis (that there are no RV variations) at >99% confidence (>4σ). Even if we arbitrarily double the errors, we still reject the null hypothesis at >99% confidence. We find a systemic velocity of −39 ± 2 km s−1; fully consistent with the cluster mean (cf. Clark et al. 2014, and in prep.); supportive of the conclusion that our RV measurements are accurate. We find a low semi-amplitude for the variability of ΔRV ∼ 12 ± 3 km s−1. The standard deviation in RVs is ∼8 km s−1; this is approximately twice the mean internal error, which implies that determining a unique period(s) from these data will be difficult.
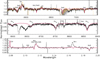 |
Fig. 4. Comparison of the synthetic spectrum of Wd1-30a derived from the optimised model-atmosphere solution described in Sect. 4 (red) to observational data (black). A further R-band spectrum is overplotted (orange) to demonstrate the night to night variability of the Hα profile (spectra from 2004 June 12 and 13). The units of wavelength for the top and middle panels are Angstroms and the bottom panel microns. |
Such behaviour could derive from either stellar pulsations or orbital motion. Unfortunately the low semi-amplitude of the variability precludes searches for multiple pulsational modes in these data such as are observed in other cluster members (cf. Wd1-71; Clark et al., in prep.). However observations of the wider cluster population (Ritchie et al. 2009a; see also Simón-Díaz et al. 2017) suggests that pulsations become apparent around spectral type ∼B0.5-1 Ia as the stars start to evolve redwards and consequently the earlier spectral type of Wd1-30a might be taken as circumstantial evidence that orbital motion is a more likely source of the RV variability; a conclusion seemingly well-supported by its X-ray properties.
As a consequence a period search was carried out using the reference implementation of the fast χ2 algorithm (Palmer 2009) with a single harmonic component. A number of periodicities of ≤10 days were returned, with the strongest peak in the resultant periodogram found at ∼4.5 days. This was found not to be statistically significant in comparison to other periods returned, while additional peaks in the periodogram above ∼10days were found to be aliases of shorter periods. With limited sampling and a low semi-amplitude, false periods arising from noise and aliasing are problematic, and k − 1 cross-validation was therefore used to assess the periodicities found. In each resampled subset false peaks in the periodogram are expected to vary while a peak due to the true orbital period will remain constant, providing some confirmation that the true period has been identified. Unfortunately, none of the periods returned in our analysis appear robust to such verification.
However, we do see a statistically-significant RV shift from −28.3 ± 2.6 km s−1 on MJD 54665.03556 to −42.8 ± 2.3 km s−1 on MJD 54671.13430 (6.099 days later), which supports the inference of a short orbital period for Wd1-30a. Such a conclusion would be fully consistent with scenarios whereby Wd1-30a is either (i) a pre-interaction system with a rather extreme mass-ratio and/or is observed under unfavourable inclination or (ii) a post-interaction system that is now dominated by the mass-gainer, which shows relatively low RV shifts as a result of a greatly reduced mass for the original primary star. However the former hypothesis would potentially struggle to explain both the X-ray properties of Wd1-30a, which appear indicative of a massive CWB (Sect. 1), and the anomalously early spectral type inferred for it (Sect. 3.1).
3.3. Cluster membership
Given the properties of the wider cluster population, the spectral types reported above for Wd1-27 and -30a appear anomalously early. An obvious question is therefore whether they are bona fide cluster members or instead interlopers located along the line of sight to Wd1. Their apparent magnitudes and reddenings are certainly consistent with cluster membership (e.g. Negueruela et al. 2010, Sect. 4), though their X-ray properties, though extreme, are also within the envelope defined for Wd1 by other massive OB supergiant and WR binaries (Clark et al. 2008). As highlighted in the previous subsection, the systemic radial velocities of both systems are directly comparable to the cluster mean value.
Critically however, we may employ analysis of the second Gaia data release (DR2; Gaia Collaboration 2016, 2018) to help address this question for these and, indeed, other putative cluster members. For reasons of continuity we present the detailed analysis of these data in Appendix A, simply summarising the essential points here. Upon consideration of the parallaxes reported, it is immediately obvious that these may not, in isolation, be utilised to determine the distance to individual stars within Wd1. As a consequence, after an initial photometric colour cut to exclude foreground objects, we utilised a combination of parallax and proper motion data to construct an astrometrically defined cluster population. We find the properties of both Wd1-27 and -30a to be consistent with cluster membership on this basis.
4. Quantitative modelling
4.1. Methodology
In order to determine the underlying physical parameters of Wd1-27 and -30a we employed the non-LTE model-atmosphere code CMFGEN (Hillier & Miller 1998, 1999) in a two-stage process. Initially we just employed the spectroscopic datasets for both stars and utilised a χ2 minimisation technique to find the best-fits to them from a grid of ∼3500 unique models
sampling the parameter space suggested by previous analysis of stars of comparable spectral type and luminosity class (cf. Najarro et al. 2004). Specifically, the grid well samples primary physical parameters such as Teff, log g, He abundance and wind density and allows reliable estimates of their uncertainties from our χ2 fitting. By computational necessity the rest of the parameters are more sparsely sampled, which unfortunately does not allow for a simultaneous determination of the uncertainties for all physical properties. Instead, errors for metal-abundances (C, N, O and Si), v∞ and β, were estimated by means of smaller grids where we let these parameters vary after fixing the primary ones. Each spectral diagnostic line (Sect. 4.1.1) was given a weight for the fitting which was set by the S/N of the spectral region in question. Special weighting was also applied to investigate the role of diagnostics in specific bands (R-, I- or K-band) in constraining the stellar properties, of particular relevance to the evaluation of Wd1-30a (Sect. 4.3); however we emphasise that final fitting was accomplished via the former methodology.
Spectroscopic modelling yields all stellar properties (cf. Tables 2 and 3) except the absolute values for bolometric luminosity, mass-loss rate and stellar radius, which can be obtained by the application of an appropriate scaling factor determined via fitting the model spectral energy distribution (SED) to the observed photometry after accounting for distance (assumed to be 5 kpc) and interstellar extinction (Sect. 4.1.2). To accomplish this a Marquardt–Levenberg technique was applied to obtain the best fitting model. Once the final model was constructed, the 3 mm continuum flux was obtained from the scaled SED in order to confront it with the ALMA observations.
Model parameters for Wd1-27.
Model parameters for Wd1-30a.
4.1.1. Spectral diagnostics
We employed a large number of line diagnostics in order to constrain the bulk properties of both stars.
– Temperature. The He I 6678 Å/He II 6683 Å ratio is a prime diagnostic in the R-band, but in the parameter domain in question the He I 6678 Å component is unfortunately extremely sensitive to the effect of the Fe IV extreme ultraviolet (EUV) lines which overlap with the He I singlet 1s21S – 1s2p11Po resonance line at 584.334 Å (cf. Najarro et al. 2006). Nevertheless, and subject to S/N, the apparent lack of He I 6678 Å sets a lower limit on Teff for both stars. Similarly the S V lines at 6717, 6722 and 6729 Å also provide a lower bound, while the absence of the N IV 7103–7122 lines provides an upper limit to Teff.
In the K-band the He I 2.112 μm triplet absorption component is a “classical” diagnostic for spectral type/Teff for O stars. However for O If+ stars, where Brγ is typically seen in emission, the He I 2.112 μm transition demonstrates an additional dependence on mass-loss and surface gravity. As such, inspection of the spectra (Fig. 2) suggests that while it constitutes a good diagnostic for Teff in Wd1-27, it only provides a lower limit for Wd1-30a. The He I 2.113 μm singlet component displays a similar behaviour to He I 6678 Å (via EUV coupling), although, for Teff < 34 kK, it plays a significant role in the 2.113–2.116 μm emission blend. In this domain He II transitions show a strong temperature dependence, with the He II 2.189 μm line serving as a prime diagnostic. Finally the C IV lines also show a temperature dependence, although their sensitivity to other physical properties (mass-loss, C abundance, velocity field and surface gravity) limit their utility.
– Surface gravity. Despite the uncertainty induced by the placement of the continuum and the presence of multiple DIBs, the detailed shape of the photospheric Paschen absorption lines in the I-band provide a valuable constraint on log g.
– Elemental abundances. Turning first to helium and the strength of the He II 6527, 6683, 6890 Å and 2.189 μm lines may all be utilised, although poor S/N and tellurics/DIBs detract from 6527 and 6890 Å, while the powerful wind of Wd1-30a affects the 2.189 μm transition. For He I one can employ the 7065 Å transition (although located within a telluric region), the lines at 8733, 8776 and 8845 Å in the I-band and 2.112 μm and the He I 7-4 transitions around Brγ in the K-band (though the latter are also strongly dependent on the turbulent velocity and clumping structure).
For nitrogen our primary diagnostic is the N III 2.1035 μm line, with the N III 2.155 μm transition that is blended with C III and O III also useful. Given the high temperature regime considered, the N IV lines between 7103 and 7122Å may also be employed as secondary diagnostics.
Despite their dependence on multiple stellar prarameters we are forced to employ the K-band C IV transitions – with the abundance fixed only after all other physical properties are set – although a weak C III line at 2.11 μm may be used as a secondary diagnostic.
The O III 8-7 transitions dominate the red part of the 2.115 broad emission feature and can be used to constrain the oxygen abundance to within 0.2 dex, while the 6-5 O III lines in the I-band also provide an upper limit.
Finally, despite being located within a noisy, strong telluric region of the spectrum, we are forced to employ the Si IV line at 8957 Å to determine the silicon abundance, although due to its additional dependence on both Teff and log g, it may only be determined once the rest of the parameters are set.
– Wind properties. The shape and strength of the profiles of both Hα and Brγ are extremely sensitive to mass-loss rates (Ṁ), wind clumping and the velocity law. He II 2.189 μm can also be used as a secondary diagnostic for mass-loss and clumping, especially for the O If+ models, where Brγ is in emission.
4.1.2. Interstellar extinction
For stars suffering significant interstellar reddening, application of the correct extinction law is essential if reliable physical parameters are to be returned. The Arches and Quintuplet clusters illustrate this issue, with differences in bolometric luminosities for cluster members of up to ∼0.6 dex being returned depending on the extinction law employed (Clark et al. 2018a,b). As a consequence significant effort was employed in testing a number of differing models, an identical (but expanded) approach to that adopted for analysis of Wd1-5 (Clark et al. 2014). The following reddening laws were compared 2:
-
Our current tailored prescription consisting of the recipe provided by Cardelli et al. (1989) below 1 μm, a modified Rieke & Lebofsky (1985) law for the 1.0–2.5 μm range and the Moneti et al. (2001) formulation for longer wavelengths.
-
A family of NIR-α laws of the kind Aλ = AKs(λKs/λ)α for a number of different power-law indices (α ∼ 1.53−2.32)
-
The extinction law by Maíz Apellániz et al. (2014).
-
The Fitzpatrick (1999) prescription.
-
The optical-NIR law specifically constructed for Wd1 by Damineli et al. (2016).
Our extinction law provides the best fit (minimum χ2) to the optical (SUSI) and NIR (SOFI) photometry. The same results were obtained when replacing our optical SUSI data by those of Lim et al. (2013), which were utilized by Damineli et al. (2016). Contrasting the different laws shows that simple power-law formulations with canonical exponents yielded systematically fainter bolometric luminosities. Similar behaviour was found for members of the Arches and Quintuplet, where unphysically low luminosities were returned (Clark et al. 2018a,b). Indeed, while single power laws may be appropriate for the NIR (1 μm < λ < 2.5 μm), they clearly fail when extended to optical wavelengths (cf. Fig. 4 of Damineli et al. 2016). Our extinction law reveals Rv ∼ 2.2−2.5 and Av ∼ 11.7 for both stars and yields results that are broadly comparable to those returned by application of the Fitzpatrick (1999) and Maíz Apellániz et al. (2014) prescriptions, with the bolometric luminosities resulting from the latter two formulations less than 0.1 dex in excess of those reported in Sect. 4.2; this close equivalence provides confidence in our approach. Conversely, while we obtain similar Av values to Damineli et al. (2016) for both objects, their AKs ∼ 0.73 is slightly lower than ours (AKs ∼ 1.2) implying lower luminosities (∼0.2 dex) if their extinction law is used3.
4.2. Wd1-27 results
The results of modelling Wd1-27 are presented in Table 2, with comparison of (non-simultaneous) observational data to the synthetic spectrum and SED in Figs. 3 and 5. An excellent match is found to both spectroscopic and photometric data, with the sole exception of the emission component present in Brγ; nevertheless with Hα in emission and Brγ substantially infilled the wind properties are well defined. The stellar temperature is consistent with our spectral classification, while the elemental abundances are consonant with this picture, being indicative of moderate CNO processing. Both bolometric luminosity and spectroscopic mass (ultimately derived from the high S/N Paschen series lines) are surprisingly high for cluster members, a finding we return to in Sect. 5. We predict a 3 mm flux of ∼0.15 mJy; slightly larger than the 0.13 mJy 3σ observational upper limit, which implies a wind-clumping factor, fcl ≥ 0.4 at radii where the mm-continuum arises; larger than inferred for the line forming regions and hence suggestive of a radial dependence to this property4.
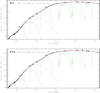 |
Fig. 5. Comparison of the synthetic spectral energy distributions of Wd1-27 and -30a derived from model-atmosphere analysis to observations (Sect. 4). The band-passes of the filters are delineated by green dashed lines, photometry with red diamonds and the (reddened) synthetic spectra by the solid black line. Errors on photometric data are smaller than the symbol sizes. Reddening parameters and resultant bolometric luminosity are also indicated. |
We utilised the Bonnsai tool (Schneider et al. 2014b) to compare these parameters to the evolutionary models of de Brott et al. (2011) in order to infer an age and initial mass for Wd1-27. Utilising the values of Lbol, Teff, log g and surface helium abundance from Table 2 Bonnsai returns an age of 2.6 Myr and initial and current masses of 65.8 M⊙ and 54.6 M⊙ respectively. As expected for the current mass predicted by Bonnsai, the value of log g ∼ 3.35 is slightly smaller than found via modelling, although within the uncertainty on this parameter (Table 2). Intriguingly, Bonnsai did not return the surface helium abundance found by modelling. Foreshadowing Sect. 5 we suspect that both Wd1-27 and -30a have experienced significant binary interaction, which has led to the anomalously high He-abundances suggested by our analysis and may in turn explain the resultant discrepancy between our modelling and the predictions of Bonnsai, which assumes a single-star evolutionary channel.
4.3. Wd1-30a results
Modelling results for Wd1-30a are presented in Table 3 and Figs. 4 and 5. Unlike Wd1-27, while we reproduce the SED we fail to simultanously replicate the R-, I- and K-band spectroscopy. Comparison of our best-fit synthetic spectrum to observational data shows that while most spectral diagnostics are well fit, we fail to duplicate the Brγ emission profile – despite success with Hα and the Paschen series lines – and the bluewards emission in the 2.11 μm blend (attributed to He I 2.112 μm). It is possible to fully replicate the K-band spectrum, including Brγ, but at the cost of grossly over-estimating the strength of Hα emission and depth of the photospheric Paschen series lines (Fig. B.1). How might we explain this discrepancy? We highlight that the differing spectra (and photometry) are non-contemporaneous and furthermore that the star is clearly spectroscopically variable (Sect. 3.2 and Fig. 4); hence we consider it most likely that the K-band spectrum was obtained at an epoch (or orbital phase) in which mass-loss was temporarily enhanced. Clearly further simultaneous spectroscopic observations will be necessary to test this hypothesis5.
Nevertheless proceeding under this scenario and, mirroring Wd1-27, Wd1-30a is an hot, highly luminous and massive star with a powerful (albeit slower) wind; again consonant with expectations from our spectroscopic classification. The predicted 3 mm-continuum flux of 0.19 mJy is consistent with observations (0.17 ± 0.06 mJy) assuming only a minor evolution in the clumping factor between the line- (fcl ∼ 0.035) and continuum-forming (fcl ∼ 0.085) regions of the wind. Finally we note that nitrogen appears anomalously enhanced given that both carbon and oxygen seem barely depleted.
Following Sect. 4.2 Bonnsai predicts an age of 2.3 Myr and initial and final masses of 56.6 M⊙ and 51.0 M⊙ respectively; as with Wd1-27 the latter being lower than our spectroscopic estimate. Likewise, the surface helium abundance was not returned and the value of log g ∼ 3.56 was also lower than anticipated, although just within the uncertainty on this parameter (Table 3).
5. Discussion
Both qualitative classification and quantitative analysis suggest that Wd1-27 and -30a are very massive mid-O hypergiants. Indeed, the bulk properties of both stars (Lbol, M*, Teff, Ṁ and V∞) are directly comparable to other known Galactic examples6, corroborating our analyses and conclusions. Under the assumption that both objects evolved via a single star channel, the Bayesian evolutionary tool Bonnsai (Schneider et al. 2014b) predicts that both stars are young (2.3–2.6 Myr) and of high initial and current mass, although we caution that it is unable to replicate all physical parameters derived from quantitative modelling.
In contrast, the remaining OB supergiant(hypergiant) population of Wd1 demonstrate spectral types ranging from O9-B4 Ia (B0-B9 Ia+); consistent with a cluster age of ∼5Myr inferred from consideration of the complete stellar census of both hot and cool stars (Clark et al. 2005, 2015; Crowther et al. 2006a; Negueruela et al. 2010). Quantitative model-atmosphere analysis has yet to be performed for the majority of cluster members, but construction of a semi-empirical HR-diagram and application of appropriate bolometric corrections according to spectral type suggests log(Lbol/L⊙)∼5.7−5.8 for the OB supergiants and mid- to late-B hypergiants (Clark et al. 2005; Negueruela et al. 2010). Similar luminosities are also suggested for the cooler yellow hypergiants within the cluster (Clark et al. 2005). Indeed only the luminous blue variable Wd1-243 is of apparently higher luminosity, with quantitative analysis by Ritchie et al. (2009b) suggesting log(Lbol/L⊙)∼5.95; however such stars are known bolometric luminosity variables (e.g. Clark et al. 2009 and references therein).
On the basis of their spectral classifications, temperatures for the population of early-type stars within Wd1 range from 32 kK for the O9 Ib-III stars, through to 28 kK for the B0 Ia cohort and ∼13.5 kK for the mid-B hypergiants (Negueruela et al. 2010). As expected from their spectral types, the temperatures determined for Wd1-27 and -30a from modelling are in excess of these estimates. Evolutionary masses of ∼35 M⊙ are inferred for the wider OB supergiant population (Negueruela et al. 2010); consistent with the analysis of Crowther et al. (2006b) who find evolutionary masses for galactic B0-3 supergiants to range from ∼25−40 M⊙. Furthermore we are fortunate to be able to determine a current dynamical mass estimate of  for the OB supergiant within the eclipsing binary Wd1-13 (Ritchie et al. 2010). Both results suggest an upper limit of ∼40 M⊙ for the OB supergiants within Wd1; even allowing for the large formal uncertainties on the mass estimates for Wd1-27 and -30a they are both still in excess of this value. Moreover, as described above, the consonance between our spectroscopic masses and the dynamical mass estimates for other galactic mid-O hypergiants gives confidence in the conclusion that Wd1-27 and -30a are indeed signficantly more massive than the cluster supergiants.
To summarise, comparing the above properties to those of Wd1-27 and -30a (Tables 2 and 3) reveals the latter to be hotter, more luminous and massive than the other members of Wd1 and, as a consequence, apparently younger7. As such they fulfill the classical definition of blue stragglers. The origin of low-mass blue stragglers has been the subject of much discussion, with mass transfer or merger in binaries (e.g. McCrea 1964) and stellar collisions (e.g. Hills & Day 1976) seen as the prime formation channels, although the relative weighting of each is still uncertain (cf. review by Knigge et al. 2015).
With the additional information afforded by the RV observations and quantitative modelling, it is appropriate to revisit the nature of both Wd1-27 and -30a. As highlighted in Sect. 1, Wd1-27 has an X-ray flux and spectrum consistent with the short-period binaries Wd1-26 and -53. However the X-ray luminosity is within a factor of two of expectations given its extreme bolometric luminosity, with recent work by Nebot Gómez-Morán & Oskinova (2018) suggesting considerable scatter in the LX/Lbol ratio. Given this, and in the absence of RV shifts, we cannot at present determine whether Wd1-27 is a binary or single star and hence whether it formed via mass transfer or merger, respectively.
In contrast Wd1-30a has an X-ray flux a factor of five greater than expected and, critically, a spectrum considerably harder than predicted for a single star (Sect. 1). In conjunction with the presence of RV variability (with an apparent periodicity of ≤10 days) we consider it likely that it was initially the secondary in a massive binary system that has subsequently experienced extensive mass transfer, such that it now dominates emission from the system. The chemical abundances derived for Wd1-30a support such a scenario (Table 3), with the enhancement of nitrogen in the absence of carbon and oxygen depletion inconsistent with expectations for the exposure of nuclear burning products at the stellar surface due to rotational mixing. Instead, one might suppose they result from the transfer of significant quantities of mass due to binary interaction (e.g. Hunter et al. 2008, 2009; Langer et al. 2008).
5.1. Stellar evolution in Wd1
One of the most striking findings derived from this work is that Wd1 possesses a uniquely rich population of both hot and cool super-/hypergiants, extending from early/mid-O spectral types (O4-5 Ia+; Wd1-30a) through to the most luminous red supergiants known (M2-5 Ia; Wd1-26). To the best of our knowledge no other cluster replicates this range and no models for single star evolution in a co-eval cluster can reproduce this distribution (e.g. de Brott et al. 2011; Ekström et al. 2012).
Binary interaction potentially offers an explanation for this observation. Previously two evolutionary channels had been inferred to operate within Wd1 (Clark et al. 2011, 2014). The first, for single stars and long period binaries is responsible for the formation of the B5-9 hypergiants (Wd1-7, -33 and -42) and their progression through yellow hypergiant (e.g. Wd1-4, 12a and 16a) and red supergiant (Wd1-20, 26 and 237) phases prior to evolving bluewards across the HR diagram to become H-depleted WRs. The second envisages stripping of the outer layers of the primary in a close binary system undergoing case-A/early case-B mass transfer. Examples of this evolutionary channel would be Wd1-13 (Ritchie et al. 2010) and the putative binary which contained Wd1-5 (Clark et al. 2014) and it yields a population of chemically peculiar early-B hypergiant/WNVLh stars that are overluminous for their current mass, but underluminous in comparison to other cluster BHGs8. These will subsequently avoid a red loop across the HR-diagram, remaining at high temperatures and evolving directly to the WR phase.
Finally our results support the (third) channel suggested by de Mink et al. (2014) and Schneider et al. (2014a) in which quasi-conservative mass-transfer in a close binary leads to the rejuvenation of the secondary via mass transfer or merger. The nature of the resultant binary product obviously depends on the initial mass of the secondary and the quantity of mass transferred, but at this instance leads to the production of early-mid O hypergiants within Wd1 (implying that three distinct evolutionary pathways can lead to the formation of blue hypergiants)9.
Unfortunately the efficiency at which matter may be accreted by the secondary in a close binary is highly uncertain (although this will not affect the evolution of the primary). Simulations by Petrovic et al. (2005) suggest that mass-transfer is highly non-conservative once the secondary has been (quickly) spun-up to critical rotation; the evolutionary calculations for Wd1-13 by Ritchie et al. (2010) were undertaken under this assumption. Conversely Popham & Narayan (1991) suggest that sufficient angular momentum may be lost via an accretion disc around the secondary that it may continue to accrete even if at critical rotation, leading to quasi-conservative mass transfer. This is a significant difference over the approach of Petrovic et al. (2005) since it favours pronounced rejuvenation of the secondary. The evolutionary code employed by de Mink et al. (2014) and the cluster population synthesis studies of Schneider et al. (2014a, 2015) employ this formulation, and it was utilised to calculate the initial evolution of the putative Wd1-5 binary (Clark et al. 2014). Unfortunately, to date there is little observational data to favour one scenario over the other; indeed it is to be hoped that studying binaries within co-eval clusters may help resolve this issue.
Focusing on Wd1, and the evidence appears equivocal. Both the spectroscopic and evolutionary mass estimates for Wd1-27 and -30a are sufficiently high (Sects. 4.2 and 4.3) that one must presume a high mass accretion efficiency in a primordial binary in which both components were initially very massive. Conversely multiwavelength observations of the sgB[e] star Wd1-9, an object thought to be a binary currently undergoing rapid case A mass-transfer, reveals the presence of a cold, dusty circumbinary torus and massive bipolar outflow (Clark et al. 2013; Fenech et al. 2017). While mass loss through the disc has yet to be quantified, mm-continuum and radio recombination line observations suggest a current mass-loss rate of ∼10−4 M⊙ yr−1 (Fenech et al. 2017) via the bipolar outflow; comparable to the non-conservative mass-transfer/loss rates of Petrovic et al. (2005) during certain phases of case A mass-transfer.
Moreover Wd1-27 and -30a are the only clear examples of blue stragglers within Wd1, despite a population of ≳100 O9-B4 stars of luminosity class I-III within Wd1 (Negueruela et al. 2010, Clark et al., in prep.). This is despite Schneider et al. (2015) suggesting a peak in their occurrence at the age of Wd1 (∼5 Myr), with a ratio of blue stragglers to stars below (and within two magnitudes of) the main-sequence turn-off of ∼0.2. Taken at face value this might be interpreted as potentially disfavouring efficient, quasi-conservative mass-transfer.
However caution needs to be applied when interpreting such numbers. Firstly, due to the difficulty of observing cluster members in the crowded core regions, the census of evolved massive stars within Wd1 is currently incomplete. Moreover one could easily imagine that a subset of putative blue stragglers could have already evolved to the WR phase. The WR population of Wd1 is known to be binary rich (e.g. Clark et al. 2008) and at this point (post-)blue stragglers would become difficult to distinguish from stars evolving via alternative channels. Similarly a fraction of the current OB supergiant population may have already accreted significant quantities of mass, even if not appearing as bona fide blue stragglers at this time10. Finally the frequency of occurrence of blue stragglers is a function of both the mass-transfer efficiency and the properties assumed for the parent binary population. Schneider et al. (2015) assume a primordial binary frequency of 100%, offering considerable scope for reducing the number of massive blue stragglers simply by reducing this fraction; indeed the large number of cluster members within Wd1 which appear to have followed a single-star channel reflect this possibility.
Nevertheless, the simple and hopefully uncontroversial result that blue stragglers are present within Wd1 indicates that in certain circumstances mass-transfer from primary to secondary in massive compact binaries can be efficient and lead to rejuvenation of the latter. An immediate consequence of this is that, for a subset of objects, massive star formation can be regarded as a two-stage process, with accretion initially forming high-mass progenitor stars and a subsequent episode of binary-driven mass-transfer or merger further increasing their masses.
Such a pathway also has important implications for the production of post-SNe relativistic remnants. Wd1 serves as an examplar of this process, with the magnetar CXOU J1647-45 hypothesised to have formed from the core-collapse of a massive blue straggler progenitor (Clark et al. 2014). Indeed, with a mass in the range ∼51−56.6 M⊙ (evolutionary) to  (spectroscopic; Sect. 4.3), Wd1-30a is broadly comparable to predictions for the nature of the companion in the putative Wd1-5 binary after rapid, quasi-conservative case-A mass-transfer (Clark et al. 2014). If such a scenario is applicable to Wd1-30a, it will next evolve through an LBV phase at which point a second interaction with the primary will eject its outer H-rich layers in a common envelope phase before it proceeds directly to a WR phase and subsequent core-collapse and potential magnetar formation if sufficient mass has been lost from, and angular momentum retained within the core.
Indeed the observational finding that within Wd1 there exist the products of both high- and low-efficiency mass transfer and a single-star channel suggests that in general massive stellar evolution depends very sensitively on the initial orbital parameters of the binary population and that the concept of a simple one-to-one relation between initial stellar mass and final (relativistic) remnant is likely incorrect.
5.2. Massive blue stragglers in other stellar aggregates?
Following the above discussion, are any further examples of massive blue stragglers present in other stellar aggregates? An early survey for high-mass blue stragglers was undertaken by Mermilliod (1982), and Ahumada & Lapasset (2007) providing a modern catalogue of blue stragglers within open clusters11. We employ the latter as our primary resource, reviewing those clusters with age ≤10 Myr, corresponding to a main sequence turn-off mass of ∼20 M⊙. The resulting population is supplemented with the YMC lists of Clark et al. (2013) and the clusters and associations surveyed by Massey et al. (1995, 2000, 2001).
Upon reassessment, the candidacy of many massive blue stragglers is subject to a degree of uncertainty, typically for one of three reasons. Firstly the stellar aggregate appears younger than assumed by Ahumada & Lapasset (2007) and as a consequence the nature of the blue straggler is uncertain; an example being WR 133 (WN5) within NGC 6871/Cyg OB3 (Massey et al. 1995). Secondly the aggregate is potentially non-coeval, such that the putative blue straggler is instead the natural product of ongoing star formation. Cyg OB2 presents a clear example of this, with the presence of O3 supergiants reported by Negueruela et al. (2008) naturally accommodated under the star formation history subsequently advocated by Wright et al. (2015). Similar issues afflict NGC 6231/Sco OB1, with studies suggesting a complicated and extended star formation history for both cluster and OB association (Clark et al. 2012 and refs. therein)12. Finally putative blue stragglers may be field stars randomly projected against the cluster. This is most clearly illustrated by the O6.5 V star HD 14434; significantly younger than the ∼14 Myr age inferred for χ Persei, but considered a likely interloper (Slesnick et al. 2002; Walborn 2002; Currie et al. 2010).
Nevertheless, the three clusters located within the Galactic centre merit individual discussion, not least because they motivated the analysis of Schneider et al. (2014a). These authors suggested that a large number of the most luminous stars within the Arches (9 ± 3) and Quintuplet (8 ± 3) were likely the rejuvenated products of binary interaction based upon the findings of Martins et al. (2008) and Liermann et al. (2012). Clark et al. (2018a) revisited the Arches, finding that the treatment of interstellar reddening in previous works was oversimplified. This results in significantly underestimated uncertainties in the stellar luminosities derived and that, in turn, were used to assert that the population of WNLha stars within the Arches were likely binary products. Furthermore Clark et al. (2018a) found a much larger population of mid-O hypergiants than Martins et al. (2008) reported, which appear to smoothly bridge the divide between O supergiants and WNLha stars, implying a close evolutionary relationship. These findings in themselves do not rule out that binary products may be present within the Arches, but we find no compelling evidence for them at this juncture – and any present would appear to be spectroscopically indistinguishable from other cluster members.
Turning to the Quintuplet and the re-analysis of Clark et al. (2018b) revealed a much more homogeneous stellar population than previously reported for the cluster by Liermann et al. (2009). Critically the observed distribution of spectral types closely follows the predictions for the evolution of a single 60 M⊙ star (Groh et al. 2014) up to the H-free WR phase. This includes the Pistol star, for which a downwards revision of its luminosity removes the apparent requirement for a binary-modified evolutionary pathway to explain its presence in the cluster (Figer et al. 1998; Najarro et al. 2009). However there is a small subset of five stars13 which, by virtue of their spectral morphologies, appear anomalously young (Clark et al. 2018b). In the absence of quantitative modelling their origin is uncertain but, as with the cohort of WN9-11h/BHGs within Wd1, one might envisage mass-stripping from the primary in a binary system (Sect. 5.1) since they do not appear significantly hotter than other cluster members (cf. Wd1-27 and -30a).
Next we address the Galactic Centre cluster. As with the Quintuplet and Wd1 it has not proved possible to define the main sequence turn-off, but the least evolved objects present appear to be a population of ∼O9.5-B2 supergiants, with mean Teff ∼ 27.5 kK and log (Lbol/L⊙)∼5.3 (Martins et al. 2007). However Geballe et al. (2006) report a classification of an O5-6 I-III star associated with the bow-shock IRS8, with modelling of IRS8* suggesting Teff ∼ 36 ± 2 kK and log(Lbol/L⊙)∼5.6 ± 0.214. The orientation of the bow-shock suggests an origin within the Galactic Centre cluster, while the combination of modelling results and a cluster age of 6 ± 2 Myr is consistent with a blue straggler identification. However Pfuhl et al. (2014) note that the relatively large displacement of IRS8* from the galactic centre and the steep radial profile of early-type stars within the central cluster casts some residual doubt on its membership and hence nature. Clearly radial velocity monitoring to identify potential signatures of binarity would be of considerable interest in resolving this issue.
Finally and for completeness we turn to the WN5ha stars within R136, which appear exceptionally massive (Sect. 1). Crowther et al. (2016) discuss these stars, and the possibility that they are blue stragglers, in depth, suggesting that the youth and mass of R136, when combined with the comparable ages of both the WN5ha and O stars render the possibility unlikely.
To summarise, a critical reappraisal of extant data reveals a comparative lack of confirmed massive blue stragglers within galactic and Magellanic YMCs – in the sense that stars are unambiguously hotter and more luminous and massive that their siblings. Binary interaction may be inferred for a small cohort of Quintuplet members while, if physically associated with the Galactic centre cluster, IRS 8* appears the strongest blue straggler candidate after Wd1-27 and -30a. At first glance this finding may appear to be in tension with the predictions of de Mink et al. (2014) and Schneider et al. (2014a, 2015). However we highlight that (i) the disparate nature of the data employed makes it impossible to systemically evaluate observational biases or uncertainties and (ii) we cannot discount the possibility that some of the most massive stars within clusters such as the Arches are indeed the product of binary mass-transfer or merger, simply that current data do not as yet mandate such an hypothesis. More detailed quantitative analysis, incorporating potential mass transfer diagnostics such as rotational velocity and chemical composition, will be required to confirm this provisional conclusion.
6. Conclusions
We present a detailed quantitative analysis of multi-wavelength and -epoch data compiled for two members of Wd1 selected on the basis of their anomalously high X-ray luminosities. Both Wd1-27 and -30a are found to be hotter and more luminous than other cluster members, with spectroscopic and evolutionary mass determinations considerably in excess of those inferred for the current supergiant population. These findings imply that both stars are younger than the remaining population of Wd1, which previous studies have suggested is remarkably co-eval (Negueruela et al. 2010; Kudryavtseva et al. 2012). We conclude that both stars are genuine cluster members from consideration of systemic radial velocities and analysis of both proper motion and parallactic measurements provided by Gaia DR2. This implies that Wd1-27 and -30a are the first examples of (massive) blue stragglers within Wd1. Analysis of both X-ray and RV data provides no evidence of current binarity for Wd1-27, although it may not be excluded. Conversely the hard X-ray spectrum of Wd1-30a and the presence of RV variability at over 99% likelihood, suggests it is a binary with an orbital period of ≤10 days. Likewise, significant surface nitrogen enhancement in the absence of carbon and oxygen depletion is difficult to understand under single star evolution.
Following the classification and analysis of Wd-27 and -30a, Wd1 is seen to host a unique population of hypergiants ranging in spectral type from O4-5 Ia+ (Wd1-30a) through to F8 Ia+ (Wd1-8a) and, arguably, given the extreme luminosity of Wd1-26, M6 Ia (Clark et al. 2010). Such a spread cannot be explained via a single star evolutionary channel for a coeval cohort. Instead we suppose three distinct pathways, with hypergiants of spectral type B5 and later evolving in isolation, the early B hypergiants/WNVLh stars via mass stripping of the primary in close binaries and the O hypergiants considered here by significant mass transfer onto the secondary in compact systems leading to rejuvenation (e.g. Wd1-30a) or, in extreme cases stellar merger (potentially Wd1-27).
The frequency of occurrence of the latter evolutionary channel and the degree of rejuvenation possible is a critical function of how much mass massive stars can accrete (and hence how much angular momentum can be shed and via what mechanism) and the physics of common envelope evolution and stellar merger. The extreme current masses suggested for Wd1-27 and -30a imply that mass-transfer must be rather efficient, although the intense mass-loss exhibited by the interacting binary Wd1-9 (Clark et al. 2013; Fenech et al. 2017) is potentially in tension with this finding. Likewise Schneider et al. (2015) suggest that one might expect a large number of rejuvenated binary products within Wd1 at this epoch but we fail to identify any further examples. Moreover, with the possible exceptions of the Quintuplet and Galactic centre clusters, there appears to be a lack of unambiguous massive blue stragglers in other stellar aggregates; Wd1-27 and -30a appear to represent the most extreme examples of this phenomenon to date. However such a qualitative assessment clearly requires systematic quantitative verification via interrogation of potential binary-interaction diagnostics such as surface abundances and rotational velocity.
Nevertheless the discovery that such a pathway is viable has important implications, implying that in a subset of cases massive star formation is a two-stage process, with mass transfer during core-H burning leading to masses significantly in excess of the initial ‘birth-mass’ of the recipient. As highlighted in Schneider et al. (2014a) this will impact on the nature of the upper-limit to stellar mass, feedback from such very massive stars and ultimately the nature of their death (i.e. direct collapse or pair production SNe) and hence the relative frequency of such events. Regarding the latter and we might expect the massive stars resulting from this evolutionary channel to be rapidly rotating with potential consequences for the occurrence of e.g. γ-ray bursts and the formation of magnetars via the dynamo mechanism. As a case in point we highlight the apparent similarity of Wd1-30a to predictions for the properties of the magnetar progenitor within Wd1 (Clark et al. 2014); thus providing corroboration for the formation channel proposed and indicative of the diversity of physical outcomes rendered possible by binary interaction.
See also Banerjee et al. (2012a,b), who suggest very massive stars may form in dense environments via dynamically-induced mergers of massive binaries, rather than being driven by stellar evolution.
We did not make use of the tailored recent formulation of Hosek et al. (2018) as it does not extend to optical wavelengths.
Note that if this law were adopted then previous luminosity (and consequently mass) determinations (e.g. Negueruela et al. 2010; Clark et al. 2014) used for comparison to Wd1-27 and -30a would also have to be systematically revised downwards; thus the overal conclusions of this paper would still be valid (e.g. Sects. 4.2, 5 and 6).
It is expected that both optical and NIR line formation regions will be physically distinct and much closer to the photosphere than the zone in which the 3 mm continuum arises. Hence the 3mm flux may be matched by simply scaling the clumping in the outer wind without altering the R-,I- and K-band spectra (cf. Najarro et al. 2011).
One might assume that we have erroneously observed different stars in the R- and K-bands. We consider this unlikely given the IR spectroscopy of other cluster members matches that expected from optical observations; hence one would have to invoke this solely for Wd1-30a. Moreover, if the K-band spectrum did not correspond to Wd1-30a it would imply the presence of an additional star of anomalously early spectral type within the core of Wd1, which would have to be an exceptionally strong Hα emitter. No such star has been identified in any of our long- and multi-slit spectroscopic programs (e.g. Clark et al. 2005; Negueruela et al. 2010), nor in our NTT/EMMI and VLT/FORS slitless spectroscopy of the whole cluster (e.g. Negueruela & Clark 2005) or the narrow-band Hα imaging employed by Wright et al. (2014). And even if such an hypothetical star were to be discovered, its presence would still be consonant with the central conclusion of this paper, namely that it and Wd1-27 – for which spectroscopic modelling is consistent and unambiguous – are of earlier spectral type and more massive and luminous than expected given the remaining stellar population of Wd1.
The secondary in Arches F2 (Lohr et al. 2018), the primary in Cyg OB2 B17 (Stroud et al. 2010) and the primary of the X-ray binary HD 153919 (Clark et al. 2002).
If we were to apply the Damineli et al. (2016) extinction law (Sect. 4), Bonnsai returns initial masses of 47.2 M⊙ and 44.4 M⊙ and ages of ∼2.8 Myr and ∼2.6 Myr for Wd1-27 and -30a, respectively (assuming single star evolution). Therefore the conclusion that the stars are more massive and younger than the remaining cluster members appears robust.
Wd1-5 has log(Lbol/L⊙)∼5.38 and Wd1-13 log(Lbol/L⊙)∼5.2 (Ritchie et al. 2010; Clark et al. 2014) compared to log(Lbol/L⊙)∼5.97 for Wd1-27, log(Lbol/L⊙)∼5.87 for Wd1-30a and log(Lbol/L⊙)∼5.8 for the apparently single B5 Ia+ hypergiants Wd1-7 and -33 (Negueruela et al. 2010).
While there is no evidence for binary evolution in the Arches (Clark et al. 2018a), the presence of both O7-8 Ia+ and B0-3 Ia+ hypergiants within the Quintuplet suggest that both single and binary channels are in operation in that cluster (Clark et al. 2018b; Sect. 5.2).
Unfortunately, the limitations of our current spectroscopic datasets for many cluster members precludes quantitative determination of elemental abundances and rotational velocities, which would help identify candidate post-binary interaction systems.
Schneider et al. (2015) report a deficit of blue stragglers within the young clusters of the Ahumada & Lapasset (2007) census in comparison to the results of their simulations.
However the authors note that with the exception of HD 152233 (O5.5 III(f)+O7.5) and HD 152248 (O7.5III(f)+O7 III(f)), NGC 6231 appears essentialy co-eval, with an age of 5Myr; are these stars therefore blue stragglers, or are they simply symptomatic of an extended episode of star formation?
LHO-01 (O7-8 Ia+), -54 (O7-8Ia+) and -99 (WN8-9ha), qF274 (WN8-9ha) and 406 (O7-8 Ia+).
Following the discussions regarding extinction towards the Galactic centre in Clark et al. (2018a), we might anticipate that the errors associated with the luminosities derived for these stars are likely to be significantly underestimated.
Acknowledgments
This research was supported by the UK Science and Technology Facilities Council. and the Spanish Government Ministerio de Economía y Competitivad (MINECO/FEDER) under grants AYA2015-68012-C2-2-P (Negueruela) and ESP2015-65597-C4-1-R and ESP2017-86582-C4-1-R (Najarro). This research has made use of the Simbad, Vizier and Aladin services developed at the Centre de Données Astronomiques de Strasbourg, France. This work has made use of data from the European Space Agency (ESA) mission Gaia (https://www.cosmos.esa.int/gaia), processed by the Gaia Data Processing and Analysis Consortium (DPAC, https://www.cosmos.esa.int/web/gaia/dpac/consortium). Funding for the DPAC has been provided by national institutions, in particular the institutions participating in the Gaia Multilateral Agreement.
References
- Ahumada, J. S., & Lapasset, E. 2007, A&A, 463, 789 [NASA ADS] [CrossRef] [EDP Sciences] [Google Scholar]
- Anders, E., & Grevesse, N. 1989, GeCoA, 53, 197 [Google Scholar]
- Andrews, H., Fenech, D., Prinja, R. K., Clark, J. S., & Hindson, L. 2018, MNRAS, 477, L55 [NASA ADS] [CrossRef] [Google Scholar]
- Asplund, M., Grevesse, N., & Jacques Sauval, A. 2006, NuPhA, 777, 1 [Google Scholar]
- Banerjee, S., Kroupa, P., & Oh, S. 2012a, ApJ, 746, 15 [Google Scholar]
- Banerjee, S., Kroupa, P., & Oh, S. 2012b, MNRAS, 426, 1416 [NASA ADS] [CrossRef] [Google Scholar]
- Berghoefer, T. W., Schmitt, J. H. M. M., Danner, R., & Cassinelli, J. P. 1997, A&A, 322, 167 [NASA ADS] [Google Scholar]
- Bonanos, A. Z. 2007, AJ, 133, 2696 [NASA ADS] [CrossRef] [Google Scholar]
- Bonnell, I. A., Bate, M. R., & Zinnecker, H. 1998, MNRAS, 298, 93 [NASA ADS] [CrossRef] [Google Scholar]
- Bonnell, I. A., Bate, M. R., Clarke, C. J., & Pringle, J. E. 2001, MNRAS, 323, 785 [NASA ADS] [CrossRef] [Google Scholar]
- de Brott, I., Mink, S. E., Cantiello, M., et al. 2011, A&A, 530, A115 [NASA ADS] [CrossRef] [EDP Sciences] [Google Scholar]
- Capitanio, L., Lallement, R., Vergely, J. L., Elyajouri, M., & Monreal-Ibero, A. 2017, A&A, 606, A65 [NASA ADS] [CrossRef] [EDP Sciences] [Google Scholar]
- Cardelli, J. A., Clayton, G. C., & Mathis, J. S. 1989, ApJ, 345, 245 [NASA ADS] [CrossRef] [Google Scholar]
- Clark, J. S., Goodwin, S. P., Crowther, P. A., et al. 2002, A&A, 392, 909 [NASA ADS] [CrossRef] [EDP Sciences] [Google Scholar]
- Clark, J. S., Negueruela, I., Crowther, P. A., & Goodwin, S. P. 2005, A&A, 434, 949 [NASA ADS] [CrossRef] [EDP Sciences] [Google Scholar]
- Clark, J. S., Muno, M. P., Negueruela, I., et al. 2008, A&A, 347, 147 [NASA ADS] [CrossRef] [EDP Sciences] [Google Scholar]
- Clark, J. S., Crowther, P. A., Larionov, V. M., et al. 2009, A&A, 507, 1555 [NASA ADS] [CrossRef] [EDP Sciences] [Google Scholar]
- Clark, J. S., Ritchie, B. W., & Negueruela, I. 2010, A&A, 514, A87 [NASA ADS] [CrossRef] [EDP Sciences] [Google Scholar]
- Clark, J. S., Ritchie, B. W., Negueruela, I., et al. 2011, A&A, 531, A28 [NASA ADS] [CrossRef] [EDP Sciences] [Google Scholar]
- Clark, J. S., Najarro, F., Negueruela, I., et al. 2012, A&A, 541, A145 [NASA ADS] [CrossRef] [EDP Sciences] [Google Scholar]
- Clark, J. S., Ritchie, B. W., & Negueruela, I. 2013, A&A, 560, A11 [NASA ADS] [CrossRef] [EDP Sciences] [Google Scholar]
- Clark, J. S., Ritchie, B. W., Najarro, F., Langer, N., & Negueruela, I. 2014, A&A, 565, A90 [NASA ADS] [CrossRef] [EDP Sciences] [Google Scholar]
- Clark, J. S., Negueruela, I., Ritchie, B., et al. 2015, The Messenger, 159, 30 [NASA ADS] [Google Scholar]
- Clark, J. S., Lohr, M. E., Najarro, F., Dong, H., & Martins, F. 2018a, A&A, 617, A65 [Google Scholar]
- Clark, J. S., Lohr, M. E., Patrick, L. R., et al. 2018b, A&A, 618, A2 [NASA ADS] [CrossRef] [EDP Sciences] [Google Scholar]
- Clark, J. S., Ritchie, B. W., & Negueruela, I. 2019, A&A, accepted [arXiv:1902.05322] [Google Scholar]
- Cignoni, M., Tosi, M., Sabbi, E., Nota, A., & Gallagher, J. S. 2011, AJ, 141, 31 [NASA ADS] [CrossRef] [Google Scholar]
- Crowther, P. A., Hadfield, L. J., Clark, J. S., Negueruela, I., & Vacca, W. D. 2006a, MNRAS, 372, 1407 [NASA ADS] [CrossRef] [Google Scholar]
- Crowther, P. A., Lennon, D. J., & Walborn, N. R. 2006b, A&A, 446, 279 [NASA ADS] [CrossRef] [EDP Sciences] [Google Scholar]
- Crowther, P. A., Schnurr, O., Hirschi, R., et al. 2010, MNRAS, 408, 731 [NASA ADS] [CrossRef] [Google Scholar]
- Crowther, P. A., Caballero-Nieves, S. M., Bostroem, K. A., et al. 2016, MNRAS, 458, 624 [NASA ADS] [CrossRef] [Google Scholar]
- Currie, T., Hernandez, J., Irwin, J., et al. 2010, ApJS, 186, 191 [NASA ADS] [CrossRef] [MathSciNet] [Google Scholar]
- Damineli, A., Almeida, L. A., Blum, R. D., et al. 2016, MNRAS, 463, 2653 [NASA ADS] [CrossRef] [Google Scholar]
- Davies, B., Clark, J. S., Trombley, C., et al. 2012, MNRAS, 419, 1871 [NASA ADS] [CrossRef] [Google Scholar]
- Dekker, H., D’Odorico, S., Kaufer, A., Delabre, B., & Kotzlowski, H. 2000, Proc. SPIE, 4008, 534 [Google Scholar]
- de Mink, S. E., Langer, N., Izzard, R. G., Sana, H., & de Koter, A. 2013, ApJ, 764, 166 [NASA ADS] [CrossRef] [Google Scholar]
- de Mink, S. E., Sana, H., Langer, N., Izzard, R. G., & Schneider, F. R. N. 2014, ApJ, 782, 7 [NASA ADS] [CrossRef] [Google Scholar]
- Dougherty, S. M., Clark, J. S., Negueruela, I., Johnson, T., & Chapman, J. M. 2010, A&A, 511, A58 [NASA ADS] [CrossRef] [EDP Sciences] [Google Scholar]
- Ekström, S., Georgy, C., Eggenberger, P., et al. 2012, A&A, 537, A146 [NASA ADS] [CrossRef] [EDP Sciences] [Google Scholar]
- Feldmeier, A., Puls, J., & Pauldrach, A. W. A. 1997, A&A, 322, 878 [NASA ADS] [Google Scholar]
- Fenech, D. M., Clark, J. S., Prinja, R. K., et al. 2017, MNRAS, 464, L75 [NASA ADS] [CrossRef] [Google Scholar]
- Fenech, D. M., Clark, J. S., Prinja, R. K., et al. 2018, A&A, 617, A137 [NASA ADS] [CrossRef] [EDP Sciences] [Google Scholar]
- Figer, D. F., Najarro, F., Morris, M., et al. 1998, ApJ, 506, 384 [NASA ADS] [CrossRef] [Google Scholar]
- Fitzpatrick, E. L. 1999, PASP, 111, 63 [NASA ADS] [CrossRef] [Google Scholar]
- Gaia Collaboration (Prusti, T., et al.) 2016, A&A, 595, A1 [NASA ADS] [CrossRef] [EDP Sciences] [Google Scholar]
- Gaia Collaboration (Brown, A. G. A., et al.) 2018, A&A, 616, A1 [NASA ADS] [CrossRef] [EDP Sciences] [Google Scholar]
- Gayley, K. G., & Owocki, S. P. 1995, ApJ, 446, 801 [NASA ADS] [CrossRef] [Google Scholar]
- Geballe, T. R., Najarro, F., Rigaut, F., & Roy, J.-R. 2006, ApJ, 652, 370 [NASA ADS] [CrossRef] [Google Scholar]
- Gosnell, N. M., Mathieu, R. D., Geller, A. M., et al. 2014, ApJ, 783, L8 [NASA ADS] [CrossRef] [Google Scholar]
- Groh, J. H., Meynet, G., Ekström, S., & Georgy, C. 2014, A&A, 564, A30 [NASA ADS] [CrossRef] [EDP Sciences] [Google Scholar]
- Grundstrom, E. D., Gies, D. R., Hillwig, T. C., et al. 2007, ApJ, 667, 505 [NASA ADS] [CrossRef] [Google Scholar]
- Hanson, M. M., Conti, P. S., & Rieke, M. J. 1996, ApJS, 107, 281 [Google Scholar]
- Hanson, M. M., Kudritzki, R.-P., Kenworthy, M. A., Puls, J., & Tokunaga, A. T. 2005, ApJS, 161, 154 [NASA ADS] [CrossRef] [EDP Sciences] [MathSciNet] [Google Scholar]
- Hosek, M. W., Lu, J. R., Anderson, J., et al. 2018, ApJ, 855, 13 [NASA ADS] [CrossRef] [Google Scholar]
- Hillier, D. J., & Miller, D. L. 1998, ApJ, 496, 407 [NASA ADS] [CrossRef] [Google Scholar]
- Hillier, D. J., & Miller, D. L. 1999, ApJ, 519, 354 [NASA ADS] [CrossRef] [Google Scholar]
- Hills, J. G., & Day, C. A. 1976, ApJ, 17, L87 [NASA ADS] [Google Scholar]
- Hunter, I., Brott, I., Lennon, D. J., et al. 2008, ApJ, 676, L29 [NASA ADS] [CrossRef] [Google Scholar]
- Hunter, I., Brott, I., Langer, N., et al. 2009, A&A, 496, 841 [NASA ADS] [CrossRef] [EDP Sciences] [Google Scholar]
- Knigge, C. 2015, in Ecology of Blue Straggler Stars, eds. H. M. J. Boffin, G. Carraro, & G. Beccari, Astrophys. Space Sci. Lib., 413, 295 [NASA ADS] [Google Scholar]
- Krumholz, M. R. 2015, in Very Massive Stars in the Local, Universe, ed. J. Vink, Astrophys. Space Sci. Lib., 412, 43 [NASA ADS] [Google Scholar]
- Kudryavtseva, N., Brandner, W., Gennaro, M., et al. 2012, ApJ, 750, L44 [NASA ADS] [CrossRef] [Google Scholar]
- Langer, N., Cantiello, M., Yoon, S. C., et al. 2008, IAU Symp., 250, 167 [Google Scholar]
- Liermann, A., Hamann, W.-R., & Oskinova, L. M. 2009, A&A, 494, 1137 [NASA ADS] [CrossRef] [EDP Sciences] [Google Scholar]
- Liermann, A., Hamann, W.-R., & Oskinova, L. M. 2012, A&A, 540, A14 [NASA ADS] [CrossRef] [EDP Sciences] [Google Scholar]
- Lim, B., Chun, M.-Y., Sung, H., Park, B.-G., Lee, J.-J., Sohn, S. T., Hur, H., & Bessell, M. S. 2013, AJ, 145, 46 [NASA ADS] [CrossRef] [Google Scholar]
- Lohr, M. E., Clark, J. S., Najarro, F., et al. 2018, A&A, 617, A66 [NASA ADS] [CrossRef] [EDP Sciences] [Google Scholar]
- Long, K. S., & White, R. L. 1980, APJ, 239, L65 [NASA ADS] [CrossRef] [Google Scholar]
- Lucy, L. B., & White, R. L. 1980, ApJ, 241, 300 [NASA ADS] [CrossRef] [Google Scholar]
- Luri, X., Brown, A. G. A., Sarro, L. M., et al. 2018, A&A, 616, A9 [NASA ADS] [CrossRef] [EDP Sciences] [Google Scholar]
- Maíz Apellániz, J., & Barbá, R. H. 2018, A&A, 613, A9 [NASA ADS] [CrossRef] [EDP Sciences] [Google Scholar]
- Maíz Apellániz, J., Evans, C. J., Barba, R. H., et al. 2014, A&A, 564, A63 [NASA ADS] [CrossRef] [EDP Sciences] [Google Scholar]
- Martins, F., Genzel, R., Hillier, D. J., et al. 2007, A&A, 468, 233 [NASA ADS] [CrossRef] [EDP Sciences] [Google Scholar]
- Martins, F., Hillier, D. J., Paumard, T., et al. 2008, A&A, 478, 219 [NASA ADS] [CrossRef] [EDP Sciences] [Google Scholar]
- Massey, P., Johnson, K. E., & DeGioia-Eastwood, K. 1995, ApJ, 454, 151 [NASA ADS] [CrossRef] [Google Scholar]
- Massey, P., Waterhouse, E., & DeGioia-Eastwood, K. 2000, AJ, 119, 2214 [NASA ADS] [CrossRef] [Google Scholar]
- Massey, P., Waterhouse, E., & DeGioia-Eastwood, K. 2001, AJ, 121, 1050 [NASA ADS] [CrossRef] [Google Scholar]
- McCrea, W. H. 1964, MNRAS, 128, 147 [NASA ADS] [CrossRef] [Google Scholar]
- Mermilliod, J.-C. 1982, A&A, 109, 37 [NASA ADS] [Google Scholar]
- Moneti, A., Stolovy, S., Blommaert, J. A. D. L., Figer, D. F., & Najarro, F. 2001, A&A, 366, 106 [NASA ADS] [CrossRef] [EDP Sciences] [Google Scholar]
- Muno, M. P., Clark, J. S., Crowther, P. A., et al. 2006, ApJ, 636, L41 [NASA ADS] [CrossRef] [Google Scholar]
- Najarro, F., Figer, D. F., Hillier, D. J., & Kudritzki, R. P. 2004, ApJ, 611, L105 [NASA ADS] [CrossRef] [Google Scholar]
- Najarro, F., Hillier, D. J., Puls, J., Lanz, T., & Martins, F. 2006, A&A, 456, 659 [NASA ADS] [CrossRef] [EDP Sciences] [Google Scholar]
- Najarro, F., Figer, D. F., Hillier, D. J., Geballe, T. R., & Kudritzki, R. P. 2009, ApJ, 691, 1816 [NASA ADS] [CrossRef] [Google Scholar]
- Najarro, F., Hanson, M. M., & Puls, J. 2011, A&A, 535, A32 [NASA ADS] [CrossRef] [EDP Sciences] [Google Scholar]
- Nebot Gómez-Morán, A., & Oskinova, L. M. 2018, A&A, 620, A89 [NASA ADS] [CrossRef] [EDP Sciences] [Google Scholar]
- Negueruela, I., & Clark, J. 2005, A&A, 436, 541 [NASA ADS] [CrossRef] [EDP Sciences] [Google Scholar]
- Negueruela, I., Marco, A., Herrero, A., & Clark, J. S. 2008, A&A, 487, 575 [NASA ADS] [CrossRef] [EDP Sciences] [Google Scholar]
- Negueruela, I., Clark, J. S., & Ritchie, B. W. 2010, A&A, 516, A78 [NASA ADS] [CrossRef] [EDP Sciences] [Google Scholar]
- Oey, M. S., & Clarke, C. J. 2005, ApJ, 620, L43 [NASA ADS] [CrossRef] [Google Scholar]
- Palmer, D. M. 2009, ApJ, 695, 496 [NASA ADS] [CrossRef] [Google Scholar]
- Petrovic, J., Langer, N., & van der Hucht, K. A. 2005, A&A, 435, 1013 [NASA ADS] [CrossRef] [EDP Sciences] [Google Scholar]
- Pfuhl, O., Alexander, T., Gillessen, S., et al. 2014, ApJ, 782, 101 [NASA ADS] [CrossRef] [Google Scholar]
- Popham, R., & Narayan, R. 1991, ApJ, 370, 604 [NASA ADS] [CrossRef] [Google Scholar]
- Rieke, G. H., & Lebofsky, M. J. 1985, ApJ, 288, 618 [NASA ADS] [CrossRef] [Google Scholar]
- Ritchie, B. W., Clark, J. S., Negueruela, I., & Crowther, P. A. 2009a, A&A, 507, 1585 [NASA ADS] [CrossRef] [EDP Sciences] [Google Scholar]
- Ritchie, B. W., Clark, J. S., Negueruela, I., & Najarro, F. 2009b, A&A, 507, 1597 [NASA ADS] [CrossRef] [EDP Sciences] [Google Scholar]
- Ritchie, B. W., Clark, J. S., Negueruela, I., & Langer, N. 2010, A&A, 520, A48 [NASA ADS] [CrossRef] [EDP Sciences] [Google Scholar]
- Ritchie, B. W., Clark, J. S., & Negueruela, I. 2011, BSRSL, 80, 628 [Google Scholar]
- Ritchie, B. W., Stroud, V. E., Evans, C. J., et al. 2012, A&A, 537, A29 [NASA ADS] [CrossRef] [EDP Sciences] [Google Scholar]
- Rosslowe, C. K., & Crowther, P. A. 2018, MNRAS, 473, 2853 [NASA ADS] [Google Scholar]
- Sana, H., de Mink, S. E., de Koter, A., et al. 2012, Science, 337, 444 [Google Scholar]
- Sandage, A. R. 1953, AJ, 58, 61 [NASA ADS] [CrossRef] [Google Scholar]
- Schneider, F. R. N., Izzard, R. G., de Mink, S. E., et al. 2014a, ApJ, 780, 117 [NASA ADS] [CrossRef] [Google Scholar]
- Schneider, F. R. N., Langer, N., de Koter, A., et al. 2014b, A&A, 570, L13 [NASA ADS] [CrossRef] [EDP Sciences] [Google Scholar]
- Schneider, F. R. N., Izzard, R. G., Langer, N., & de Mink, S. E. 2015, ApJ, 805, 20 [NASA ADS] [CrossRef] [Google Scholar]
- Seward, F. D., & Chlebowski, T. 1982, ApJ, 256, 530 [NASA ADS] [CrossRef] [Google Scholar]
- Simón-Díaz, S., Godart, M., Castro, N., et al. 2017, A&A, 597, A22 [NASA ADS] [CrossRef] [EDP Sciences] [Google Scholar]
- Slesnick, C. L., Hillenbrand, L. A., & Massey, P. 2002, ApJ, 576, 880 [NASA ADS] [CrossRef] [Google Scholar]
- Stroud, V. E., Clark, J. S., Negueruela, I., et al. 2010, A&A, 511, A84 [NASA ADS] [CrossRef] [EDP Sciences] [Google Scholar]
- Tarasov, A. E. 2000, ASPC, 214, 644 [NASA ADS] [Google Scholar]
- van Bever, J., & Vanbeveren, D. 1998, A&A, 334, 21 [NASA ADS] [Google Scholar]
- Walborn, N. R. 2002, AJ, 124, 507 [NASA ADS] [CrossRef] [Google Scholar]
- Wright, N. J., Wesson, R., Drew, J. E., et al. 2014, MNRAS, 437, L1 [NASA ADS] [CrossRef] [Google Scholar]
- Wright, N. J., Drew, J. E., & Mohr-Smith, M. 2015, MNRAS, 449, 741 [NASA ADS] [CrossRef] [Google Scholar]
- Wright, N. J., Bouy, H., Drew, J. E., et al. 2016, MNRAS, 460, 2593 [NASA ADS] [CrossRef] [Google Scholar]
- Yusef-Zadeh, F., & Morris, M. 1991, ApJ, 371, L59 [NASA ADS] [CrossRef] [Google Scholar]
- Zinnecker,& H., Yorke, H. W. 2007, ARA&A, 45, 481 [NASA ADS] [CrossRef] [Google Scholar]
Appendix A: An analysis of DR2 data on Westerlund 1
The second Gaia data release (DR2; Gaia Collaboration 2018) has made available precise positions, parallaxes and proper motions for over a billion stars, and thus represents a major step forward in our understanding of stellar physics. Unfortunately, it appears that DR2 measurements in the field of Wd 1 are not necessarily reliable. Extreme examples are the parallaxes to well-known members of the cluster, such as the Wolf–Rayet binary Wd1-241 (WR77p; π = 3.91 ± 0.48 mas), the yellow hypergiant Wd1-4 (π = 0.97 ± 0.14 mas) and the LBV Wd1-243 (π = 0.98 ± 0.16 mas). These values imply distances that are far too small to be compatible with any previous estimates, but are also impossible to reconcile with the run of extinction with distance observed along the line-of-sight to Wd 1. Specifically Capitanio et al. (2017) demonstrate that the total extinction out to ∼1 kpc in the direction to Wd 1 produces a colour excess of only E(B − V)∼0.3 ± 0.1, whereas these objects each exhibit E(B − V) > 4 mag. Moreover, the foreground O9 Ib supergiant HD 151018, which is projected just on top of the cluster, has E(B − V)≈0.9 and a spectrophotometric distance of 3.1 kpc (Maíz Apellániz & Barbá 2018), suggesting that these cluster members must be at a greater distance still given their reddening; a conclusion incompatible with their parallaxes.
To explore the source of these unexpected values, we downloaded all the DR2 data within a circle of radius  around the nominal centre of Westerlund 1. This area contains more than 3500 Gaia DR2 sources, but only 2265 of them have an astrometric solution. If we look at the astrometric_excess_noise_sig flag, close to 1300 sources – including almost every source in the central concentration – have D > 2, a value suggestive of significant excess noise ϵi for the fit. In fact, less than 400 sources have ϵi ≈ 0, indicating that the residuals of the fit statistically agree with the assumed observational noise.
The low average quality of the astrometric solutions is made evident in Fig. A.1, where we compare our field to another crowded region of the Galactic plane, the core of the old open cluster NGC 7789. A circle of the same radius contains more than 1300 sources, of which more than 90% have astrometric solutions. The left panel of Fig. A.1 compares the typical errors in parallax at a given magnitude for both fields (plots displaying proper motion errors evidence the same behaviour). Errors are always larger for the Wd 1 field and a very significant fraction of stars have much larger errors than the NGC 7789 objects of the same G magnitude.
Almost all the stars with larger than typical errors lie in the central concentration, suggesting that crowding is the main source of the increased uncertainties. To test this explanation, in the right panel of Fig. A.1, we plot the typical errors in an even more crowded region, the central  of the intermediate-age cluster M11. This field contains more than 6800 sources, of which nearly 4000 have astrometric solutions. The plot shows not only that errors are typically larger than in Wd 1, but also that several “families” of solutions exist at a given G magnitude with different typical errors. It is thus clear that crowding introduces major uncertainties in DR2 astrometric solutions and therefore individual values must be taken with extreme care.
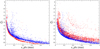 |
Fig. A.1. Comparison of the typical errors in parallax determination within Gaia DR2 for Wd 1 and other crowded regions of the Galactic plane. Left panel: core of the old open cluster NGC 7789. Right panel: core of the intermediate-age open cluster M11. In both panels, data for Wd 1 is plotted as blue dots, while data for the other cluster is plotted as red dots. |
Given the huge number of sources and the large uncertainties, in order to identify cluster members, we performed an initial selection by taking only stars with (BP − RP > 3.4, a condition that removes all the foreground population without leaving out any known cluster member (in fact, exploration of DR2 data for a large area around Wd 1 shows that cluster members are the reddest stars with Gaia photometry in the region). When we plotted the resulting sample in the proper motion (pmRA/pmDec) plane, the cluster appears as a strong overdensity (Fig. A.2), from which we can select candidate members.
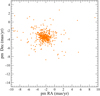 |
Fig. A.2. Gaia DR2 proper motions for targets within |

From this initial sample, we calculated the average proper motions by weighting every value with the inverse of its error and then cleaned the sample via an iterative procedure, by discarding outliers and recalculating the average, until the standard deviation of the proper motion values in the sample was comparable to the typical error of an individual value (evaluated as the median of the errors). Removal of the outliers does not imply any judgement on their cluster membership, but was simply intended to define a clean sample of objects with moderately low errors. The procedure proved to be very robust, with the weighted averages not changing significantly throughout. We were finally left with a sample of 168 objects, which yielded weighted averages for the proper motions of Wd 1 of pmRA = −2.3 mas yr−1 and pmDec = −3.6 mas yr−1, with standard deviations of ∼0.3 mas yr−1, comparable to the (very large) median errors. For this sample, we calculated a weighted average value of the parallax, finding π = 0.19 mas. Most of the objects included in the sample have errors comparable to or even larger than their individual parallaxes. We removed those objects that were incompatible with this average within their own uncertainty, coming to a final “clean” sample of 146 objects that are compatible with the average proper motion and parallax values within one sigma. We find both a weighted and unweighted average parallax of π = 0.19 mas for this cohort, while the median parallax is π = 0.16 mas, with a standard deviation of 0.15 mas. Taken at face value, these results favour a distance of 5–6 kpc for Wd 1, in good agreement with estimates based on its high-mass stellar population. However, systematic uncertainties of up to ±0.1 mas cannot be ruled out (Luri et al. 2018), implying a range of values (which we will assume are distances not discarded by the astrometry) between 3.5 kpc and unphysically large distances.
While the average values obtained may be considered reliable since they are based on a large number of objects, any given individual value is suspect, because of the large uncertainties. It is, however, extremely unlikely that an erroneous astrometric solution will result in parameters compatible with cluster averages. For this reason, we can expect objects whose proper motions and parallaxes are consistent with those averages to be cluster members, while a final decision on stars with discrepant values must await further Gaia data releases.
To validate this methodology, we utilised the photometric and spectroscopic censuses of Wd1 presented by Clark et al. (2005), Crowther et al. (2006a), Ritchie et al. (2009a), and Negueruela et al. (2010) to produce a master list of “spectroscopic members” – and then inspected their individual DR2 parameters in order to determine whether they were flagged as astrometric cluster members. The following stars were found among the “clean” sample defined above and therefore may be considered proper-motion and parallax validated members of the cluster (ordered by brightness): Wd1-57a, -2a, -11, -61a, -52, -56a, -373, -10, -5, -34, -27, -239, -3005, -3004, -54, -53, -6a, -74, -3003, -84, -60, -3002, -61b, -58, -17, -1, -59, -63a, -65, -15, -56b, -49, -86, -48, and -228b. We highlight the inclusion of Wd1-27 within this group of stars.
A large subset of the remaining spectroscopic cluster members have proper motions that are compatible (i.e. within twice their individual errors) with the average cluster proper motion. Their parallaxes have very large errors, but again all are within two error bars of the cluster mean; this cohort comprises Wd1-18, -20, -23a, -29, -30a, -37, -38, -43a, -50b, -55, -70, -78, and -238 and WR O, WR R, WR T, and WR V. We emphasise the appearance of Wd1-30a within this grouping. This subset also includes the red hypergiant Wd1-20 and one of the WR stars furthest from the cluster core (WR T). While the yellow hypergiant Wd1-265 has a proper motion compatible with that of Wd1, as with Wd1-4 it has an anomalous parallax (π = 0.80 ± 0.17). An additional subset of stars have astrometric solutions consistent with the average proper motion of Wd1 at approximately 2σ, although many of them are not consonant with the average cluster parallax; these comprise Wd1-7, -8a, -12a, -13, -21, -19, -24, -33, -35, -39, -43c, -46a, -72, -75, and -237 and WR C and WR N. This list includes about half the hypergiants and the most distant WR star, WR N.
The list of known members whose DR2 solution is incompatible with the average values comprises Wd1-4, -6b, -8b, -16a, -26, -28, -31a, -32, -42a, -46b, -50a, -62a, -71, -238, -241, and -243 and WR B, WR D, WR G, WR M, and WR P. Finally, a small number of stars have no astrometric solution in DR2, namely: Wd1-9, -14a, -41, -43b, and -44 and WR H, WR I, WR J, and WR K.
Figure A.3 shows the proper motion plane for stars that have been classified as members. The vast majority are compatible within two of their error bars with the average cluster proper motions; indeed re-evaluating the cluster proper motion including all the spectroscopic members yields proper motions of pmRA = −2.1 mas yr−1 and pmDec = −3.7 mas yr−1, which remain compatible with those derived from the “clean” sample within the respective errors. Agreement with the average parallax is worse, but even including objects with unphysically high parallaxes, such as the aforementioned Wd1-4, -241, and -243, only shifts the weighted average from 0.19 to 0.22 mas, All the astrometric and photometric values available within DR2 for known cluster members are listed in Table A.1.
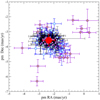 |
Fig. A.3. Gaia DR2 proper motions for possible members of Wd 1. The small filled (violet) circles are spectroscopically selected cluster members that form a subset of the “clean” population defined on the basis of proper motions and parallaxes; the remaining members of this grouping (i.e. those stars without spectral classifications) are shown as black dots. Larger (blue) circles are spectroscopically selected members with astrometric properties compatible with the cluster averages within approximately two of their own error bars. Diamonds are spectroscopic cluster members that are not compatible at 2σ in at least one of the three astrometric values. The large (red) circle represents the average cluster value. Its error bars are the median value of the errors for the sample of objects used to calculate it. |
Gaia DR2 data for previously catalogued members of Westerlund 1.
Finally, we highlight that none of the very luminous blue, yellow or red hypergiants within Wd1 appear in the list of proper-motion and parallax validated cluster members, the brightest star being the B4 Ia supergiant Wd1-57a. Nevertheless, aside from their high reddenings, there are compelling observational reasons to believe that they are indeed cluster members. Firstly the Gaia DR2 includes radial velocities for four of the cool hypergiants (Table A.1) which are all consistent with the cluster average and velocity dispersion (Ritchie et al. 2009a, Clark et al. 2014, and in prep.). Secondly, their locations in both colour/magnitude and HR diagrams are consonant with the proper-motion validated cohort (Clark et al. 2005; Negueruela et al. 2010; Ritchie et al. 2010). There is also a smooth and continuous progression in spectroscopic morphologies from the early- and mid-B supergiants within Wd1 through to the late B hypergiants, yellow hypergiants and finally red supergiants (Clark et al. 2005; Negueruela et al. 2010). Finally mm- and radio-continuum observations reveal prominent cometary nebulae associated with the majority of the cool hypergiants which are all orientated towards the cluster core; a phenomenon attributed to the ionisation and sculpting of their stellar outflows by the radiation and wind pressure of the host of WR and O-type stars within Wd1 (Andrews et al. 2018; Fenech et al. 2018). This behaviour, replicating that of the red supergiant GC IRS7 (associated with the nuclear star cluster; Yusef-Zadeh & Morris 1991), conclusively proves a physical association between cluster and the hypergiants.
To summarise, our analysis shows that both Wd1-27 and -30a are confirmed as proper-motion and parallax validated cluster members. The former is part of the core “clean” sample used to define the averages, while the second is compatible within approximately 2 σ. At present, we can only speculate about the reasons why the majority of the most luminous spectroscopic cluster members have untenably high parallaxes, although we highlight that many of these stars are sufficiently large that their disks may be resolved by Gaia, even at a distance of ∼5 kpc. Moreover many of the wider cluster population are found to be binaries (cf. Clark et al. 2008; Ritchie et al. 2009a), an occurence which is known to affect the reliability of Gaia DR2 astrometric solutions. We suspect these circumstances conspire with the very high stellar density to yield unreliable astrometric solutions. Future Gaia data releases will undoubtedly provide a much sharper view of membership in Wd 1, while very likely confirming the average cluster values determined here.
Appendix B: Model results for Wd1-30a via fitting the Brγ line
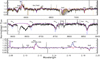 |
Fig. B.1. Comparison of synthetic spectra of Wd1-30a derived from the best-fit model-atmosphere solution (red line) and the alternative optimised to fit the K-band spectrum and in paticular the Brγ profile (blue line; see Sect. 4.3 for details). Observational data are presented in black, with an additional R-band spectrum (orange) overplotted to demonstrate the variability in the Hα profile (spectra from 2004 June 12 and 13). While it is possible to reproduce the Brγ emission it comes at the cost of greatly overestimating the strength of Hα emission and the depth of the photospheric Paschen series lines. For completeness we note that such a model implies a cooler (Teff ∼ 34 kK versus 37.25 kK) and lower luminosity (log(Lbol/L⊙)∼5.7 versus 5.89) star with a slower wind (V∞ ∼ 800 km s−1 versus 1200 km s−1). The units of wavelength for the top and middle panels are Angstroms and the bottom panel microns. |
All Tables
All Figures
|
Fig. 1. R- and I-band spectra of Wd1-27 and -30a (black) with prominent transitions indicated (note the difference in spectral resolutions between the two observations). Template spectra of HD 15570 (O4 If+), HD 14947 (O5 If+) and HD 192639 (O7.5 Iaf) are shown for comparison (red). |
| In the text | |
|
Fig. 2. Left panel: K-band spectra of Wd1-27 and -30a (black) with prominent transitions indicated. Template spectra of HD 15570 (O4 If+), HD 14947 (O5 If+) and HD 192639 (O7.5 Iaf) shown for comparison (red; data from Hanson et al. 2005). Additional comparators from the Arches cluster are plotted in blue (data from Clark et al. 2018a). Right panel: spectra of “representative” early-B cluster supergiants Wd1-28, -41 and -78 shown for comparison (black) with additional template spectra (red; Hanson et al. 2005) of HD 30614 (O9 Ia), HD 154368 (O9.5 Iab), HD 37128 (B0 Ia), HD 115842 (B0.5 Ia), HD 13854 (B1 Iab) and HD 134959 (B2 Ia). |
| In the text | |
|
Fig. 3. Comparison of the synthetic spectrum of Wd1-27 derived from model-atmosphere analysis (red line) to observational data (black solid line). See Sect. 4 for further details. The units of wavelength for the top and middle panels are Angstroms and the bottom panel microns. |
| In the text | |
|
Fig. 4. Comparison of the synthetic spectrum of Wd1-30a derived from the optimised model-atmosphere solution described in Sect. 4 (red) to observational data (black). A further R-band spectrum is overplotted (orange) to demonstrate the night to night variability of the Hα profile (spectra from 2004 June 12 and 13). The units of wavelength for the top and middle panels are Angstroms and the bottom panel microns. |
| In the text | |
|
Fig. 5. Comparison of the synthetic spectral energy distributions of Wd1-27 and -30a derived from model-atmosphere analysis to observations (Sect. 4). The band-passes of the filters are delineated by green dashed lines, photometry with red diamonds and the (reddened) synthetic spectra by the solid black line. Errors on photometric data are smaller than the symbol sizes. Reddening parameters and resultant bolometric luminosity are also indicated. |
| In the text | |
|
Fig. A.1. Comparison of the typical errors in parallax determination within Gaia DR2 for Wd 1 and other crowded regions of the Galactic plane. Left panel: core of the old open cluster NGC 7789. Right panel: core of the intermediate-age open cluster M11. In both panels, data for Wd 1 is plotted as blue dots, while data for the other cluster is plotted as red dots. |
| In the text | |
|
Fig. A.2. Gaia DR2 proper motions for targets within |
| In the text | |
|
Fig. A.3. Gaia DR2 proper motions for possible members of Wd 1. The small filled (violet) circles are spectroscopically selected cluster members that form a subset of the “clean” population defined on the basis of proper motions and parallaxes; the remaining members of this grouping (i.e. those stars without spectral classifications) are shown as black dots. Larger (blue) circles are spectroscopically selected members with astrometric properties compatible with the cluster averages within approximately two of their own error bars. Diamonds are spectroscopic cluster members that are not compatible at 2σ in at least one of the three astrometric values. The large (red) circle represents the average cluster value. Its error bars are the median value of the errors for the sample of objects used to calculate it. |
| In the text | |
|
Fig. B.1. Comparison of synthetic spectra of Wd1-30a derived from the best-fit model-atmosphere solution (red line) and the alternative optimised to fit the K-band spectrum and in paticular the Brγ profile (blue line; see Sect. 4.3 for details). Observational data are presented in black, with an additional R-band spectrum (orange) overplotted to demonstrate the variability in the Hα profile (spectra from 2004 June 12 and 13). While it is possible to reproduce the Brγ emission it comes at the cost of greatly overestimating the strength of Hα emission and the depth of the photospheric Paschen series lines. For completeness we note that such a model implies a cooler (Teff ∼ 34 kK versus 37.25 kK) and lower luminosity (log(Lbol/L⊙)∼5.7 versus 5.89) star with a slower wind (V∞ ∼ 800 km s−1 versus 1200 km s−1). The units of wavelength for the top and middle panels are Angstroms and the bottom panel microns. |
| In the text | |
Current usage metrics show cumulative count of Article Views (full-text article views including HTML views, PDF and ePub downloads, according to the available data) and Abstracts Views on Vision4Press platform.
Data correspond to usage on the plateform after 2015. The current usage metrics is available 48-96 hours after online publication and is updated daily on week days.
Initial download of the metrics may take a while.