Fig. B.1.
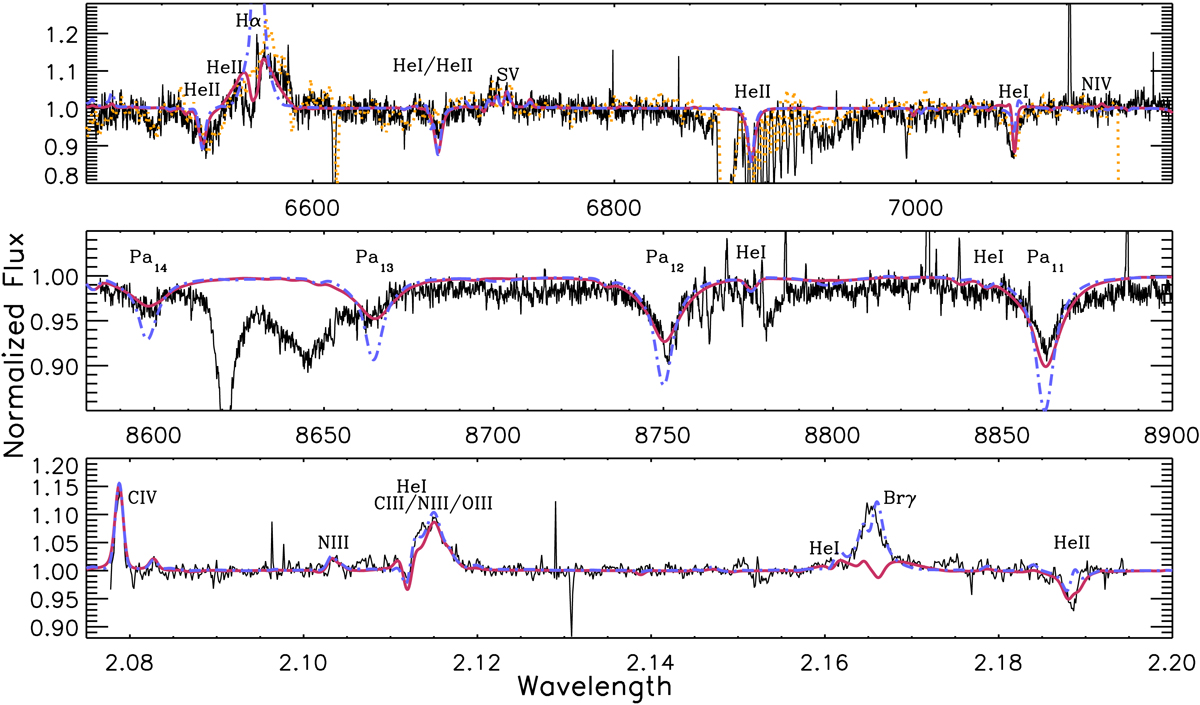
Comparison of synthetic spectra of Wd1-30a derived from the best-fit model-atmosphere solution (red line) and the alternative optimised to fit the K-band spectrum and in paticular the Brγ profile (blue line; see Sect. 4.3 for details). Observational data are presented in black, with an additional R-band spectrum (orange) overplotted to demonstrate the variability in the Hα profile (spectra from 2004 June 12 and 13). While it is possible to reproduce the Brγ emission it comes at the cost of greatly overestimating the strength of Hα emission and the depth of the photospheric Paschen series lines. For completeness we note that such a model implies a cooler (Teff ∼ 34 kK versus 37.25 kK) and lower luminosity (log(Lbol/L⊙)∼5.7 versus 5.89) star with a slower wind (V∞ ∼ 800 km s−1 versus 1200 km s−1). The units of wavelength for the top and middle panels are Angstroms and the bottom panel microns.
Current usage metrics show cumulative count of Article Views (full-text article views including HTML views, PDF and ePub downloads, according to the available data) and Abstracts Views on Vision4Press platform.
Data correspond to usage on the plateform after 2015. The current usage metrics is available 48-96 hours after online publication and is updated daily on week days.
Initial download of the metrics may take a while.