Fig. 4.
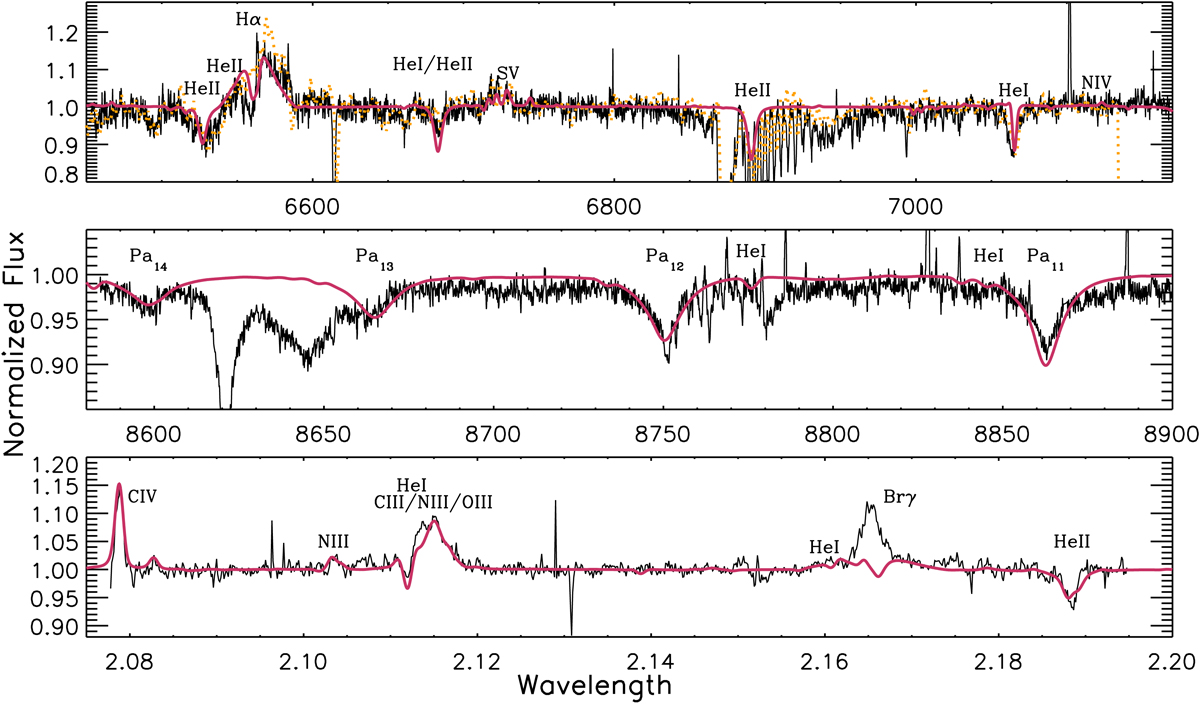
Comparison of the synthetic spectrum of Wd1-30a derived from the optimised model-atmosphere solution described in Sect. 4 (red) to observational data (black). A further R-band spectrum is overplotted (orange) to demonstrate the night to night variability of the Hα profile (spectra from 2004 June 12 and 13). The units of wavelength for the top and middle panels are Angstroms and the bottom panel microns.
Current usage metrics show cumulative count of Article Views (full-text article views including HTML views, PDF and ePub downloads, according to the available data) and Abstracts Views on Vision4Press platform.
Data correspond to usage on the plateform after 2015. The current usage metrics is available 48-96 hours after online publication and is updated daily on week days.
Initial download of the metrics may take a while.